Transcription
Finding Anomalies in Windows Event Logs UsingStandard DeviationJohn DwyerTraian Marius TrutaDepartment of Computer ScienceNorthern Kentucky UniversityHighland Heights, KY 41099, USAdwyerj1@nku.eduDepartment of Computer ScienceNorthern Kentucky UniversityHighland Heights, KY 41099, USAtrutat1@nku.eduAbstract— Security is one of the biggest concerns of any companythat has an IT infrastructure. Windows event logs are a veryuseful source of data for security information, but sometimes canbe nearly impossible to use due to the complexity of log data orthe number of events generated per minute. For this reason,event log data must be automatically processed so that anadministrator is given a list of events that actually need theadministrator’s attention. This has been standard in intrusiondetection systems for many years to find anomalies in networktraffic, but has not been common in event log processing. Thispaper will adapt these intrusion detection techniques forWindows event log data sets to find anomalies in these log datasets.Keywords-WindowsAnomaly ONSecurity is one of the biggest concerns of any company thathas an IT infrastructure. It is very important for anadministrator to always know the security posture of thenetwork and servers that they manage. One way to alwaysknow the state of an environment is through logs [1]. Whilethere are hundreds or thousands of devices that create logs on anetwork, most logs are hardly ever read due to the complexityand volume of the log data. This creates a problem for theadministrator as logs must be reviewed, but if the whole day isspent reviewing logs (and this will not be enough time giventhe size and the complexity of these logs), there is never anytime left over to react to the problems found in the logs.Windows event logs are one of the best tools that can beused to find and remedy problems and vulnerabilities inWindows operating systems [2]. While Windows event logs area very important source of information, they can be difficult toreview as the default “Event Viewer” in Windows only givesoptions for basic filtering of events and doesn’t give anyoptions for correlation or other useful tools that could help anadministrator find a problem quickly and efficiently [2, 3].Another problem with trying to review Windows event logs isthe speed at which they are created. If it takes an administrator1 minute to review a log entry and logs are coming in at a rateof 50 per-minute, it becomes impossible for an administrator toreview the logs. For this reason, the logs must be reviewed by athird-party software solution to remove the events thatwouldn’t concern the administrator and only show theadministrator events that could help find problems andvulnerabilities.This paper will introduce a novel approach to identifyanomalies in Windows event log data using standard deviation.With a set of event logs, it is possible to use SQL queries toaverage the average number of events of a specific type at anytime of the day for any server or user in the dataset. With this,the average number of events of a specific type can bedetermined and the standard deviation of those events can bedetermined. This allows alerting for times that go outside of thestandard deviation. For example, if a specific server usuallysees 150 login attempts at 8:30 AM on Monday and it receives1000 login attempts at that time, an alert can be created to showthat there is a possible breach. With these functions, it is alsopossible to alert on events that are not based on securityproblems. For example, if a large number of I/O errors arewritten to the event log by a failing hard drive, an administratorwould be alerted due to the anomaly created by the influx ofevents. This proposed anomaly detection in Windows eventlogs is implemented with the help of SQL queries andTransact-SQL.The remaining of the paper is structured as follows. SectionII describes the data set used in this paper. Section III discussesthe techniques used to de-identify the data set. Section IVdocuments the implementation of the anomaly detectiontechniques used in this research. Section V presents thepreliminary findings that were gathered with the anomalydetection. The paper ends with future work directions andconclusions.II. DATA DESCRIPTIONThe data used in this paper was gathered from the eventlogs of approximately 30 production servers over the span of 6months. This amounts to approximately 23GB of log data. Theservers included a Citrix farm, Domain Controllers, Exchangeservers, web servers, application servers, and database servers[4, 5]. All servers had auditing enabled for successful andfailed logon attempts to track the number of logons at anyspecific time of day [6]. The log data was collected byconverting the event logs into a syslog format and sending thelogs to a central data store. This was implemented using Snarefor Windows and a Snare server [7, 8]. The event logs werethen imported into a SQL database using the Transact-SQL
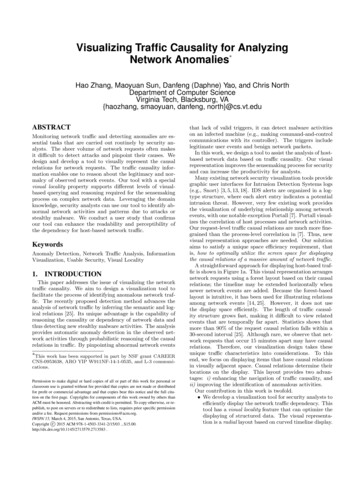
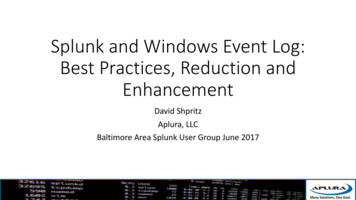
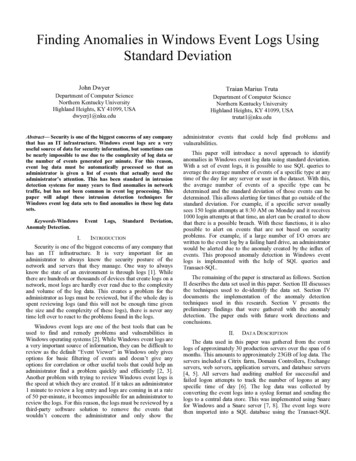
bulk import statement [9]. Once in the database, all identifiableinformation was transformed using a multitude hashingalgorithms to protect the identity of the entity that provided thedataset [11]. These algorithms are described in Section III.The standard Windows event log format contains manyfields such as the server the log was generated from, the timeand date the log was generated, the process or program thatgenerated the log, a description of the event, the account thatthe event occurred under, and many other fields [11]. In astandard implementation, many of these fields may be used togive the administrator more information such as a descriptionof the event to lower the amount of research that must be doneto trace down a problem. An example of the data used can beseen in Fig.1. In this paper, only the following fields will beused: Event Log – Contains the name of the event log inwhich the log originated [10]. Only the Application,Security, and System event logs are used in this paper. Event Source – The program or process that generatedthe event. Many event sources are used in this paper[10]. For example, all login and logoff events are fromthe event source Security. In this instance both theevent log and the event source have the same name butare separate fields, this is not the case with all events. Event ID – The unique ID of the event based on whichSource generated the event. Event IDs are not uniquebetween sources but are always unique within theirown source. An Event ID is not specific to each eventjust each event of a specific type [10]. For example, allWindows account lockout events are placed in theSecurity log with a source of Security and an event IDof 644 [6].Event Type – This field describes the type of eventthat occurred and can be useful for determining whattype of activity generated the event [10]. In theexample events above, all events are of the typeSuccess Audit which shows the events were created bysuccessful login attempts. Event Category – This categorizes events into specificgroups based on the type of event [10]. For example,the category Logon/Logoff events contains multipleevent IDs which relate to the category. Time/Date – The time and date of the event is used tocalculate the number of a specific event at any point intime throughout the day on any specific day of theweek. The day of week is used due to the fact that youmay have more login requests at a specific time on aWednesday that you would on a Sunday. TheTime/Date field of the event is split up into multiplecolumns using a Transact-SQL substring command.The columns that are used in the paper are EvtHour,EvtMinute, EvtDayOfWeek, EvtDayOfYear, EvtYear.Hours and minutes were intentionally separated toallow for easier computation of per hour and perminute results. Server ID – This is a unique identifier for each serverin the dataset. This is useful to help an administratorlink back an alert to a specific server to identify wherethe problem occurred. User ID – This is a unique identifier for each user inthe dataset. There are over 400 unique users identifiedin the dataset. This is useful to help an administratorlink back an alert to a specific user to identify whichuser account may be linked to the problem orvulnerability.All other fields were removed because they were notnecessary for the processing of the cSecSuccess ess ess AuditAccount Logon680Tue2-Oct124201217377SecSecSuccess ess AuditLogon/Logoff528Tue2-Oct1242012Figure 1. Sample log data.
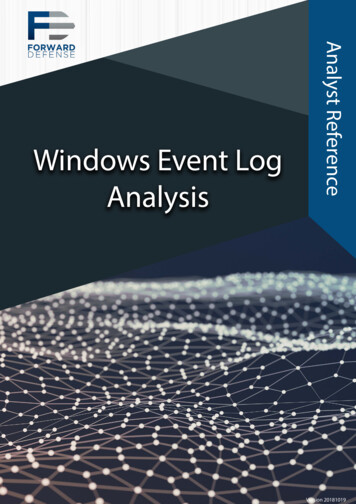
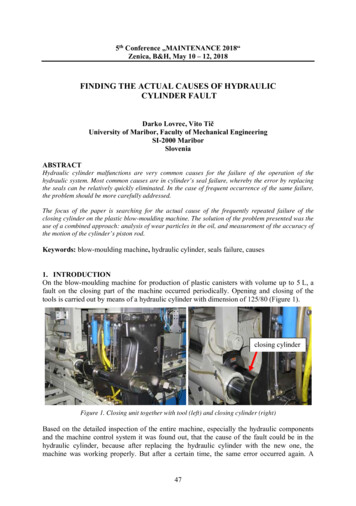
III. DATA PREPROCESSINGIn this paper both known and custom hashing methods areused to remove identifiable information from the dataset whilestill keeping the integrity of the data. To be sure that the sameusername or server name is always transformed to the samevalue, a hashing table must be stored in the database [10]. Thismeans that the stored hashes must also be directly related to theusername and server name without actually storing the data inplain text. For this reason, a substring was taken of the valueand the substring of the value was encrypted with a MD5 hashfollowed by a SHA1 hash [12]. Each encrypted substring wasgiven a unique ID number which was used in presenting thedata to allow it to be readable versus displaying an encryptedvalue. For instance, an event may show that user 415 loggedinto server 10. This was implemented to protect the privacy ofthe entity that provided the log data for analysis. In a real worldscenario, it is likely that an administrator would not need tomask server names and user IDs as the data would be usedfully inside the company and not provided to outside resources.The hashing tables were created with the SQL queries shownbelow in Fig. 2.IV. IMPLEMENTATIONThe processing of data and alerting is broken down into a 5step process as can be seen in Fig. 3. Section III showed theprocess for de-identifying the data. This section will go throughthe steps of processing the data, counting the events,calculating the average number of events and generating alertsbased on the average number of events and current count ofevents. These methods were implemented using Microsoft SQLServer 2008 R2 and Windows Server 2008 R2. The systemused for testing had 8 processor cores, 16 GB of memory and300 GB of solid state storage.SELECT Row Number() over(order by EncryptedServerName desc) as ServerID,EncryptedServerName INTO ServerHashFROM (SELECT distinct 3,5))) as EncryptedServerNameFROM RawLogs) as ServerNames;SELECT Row Number() over(order by EncryptedUserName desc) as UserID,EncryptedUserName INTO UserHashFROM (SELECT distinct 5))) as EncryptedUserNameFROM RawLogs) as UserNames;Figure 2. Source code for server and user hashing functions.1. Anonymizationand preprocessingPreprocessedDataAlerts2. Count the totalnumber of logs thatoccur in a minute.RawDataPer-MinuteLog Counts3. Calculate the averagenumber of events thatoccur in a minute.Figure 3. Data processing and alerting process.AveragePer-MinuteLog Counts
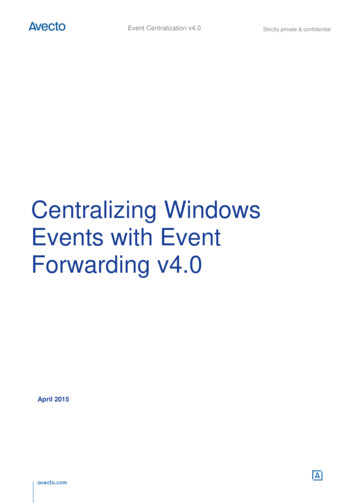
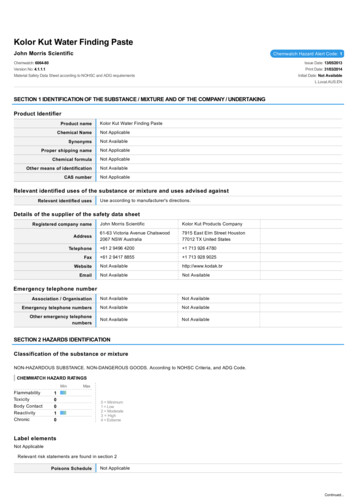
Once the events are de-identified they can now beprocessed to obtain usable information. The first step is tocount the number of events that happened at a specific time of aspecific day for specific servers and specific users. This can beaccomplished by a simple select statement with a count and agroup by clause as shown in Fig. 4.This statement outputs the results into a new table forfurther analysis and calculation. This will allow lowering thegranularity by grouping again and removing fields that are notneeded and outputting the data into another table. This is usefulin determining the number of events across all servers andusers for a specific time of day or a specific day.Now that the events have been counted, the next step is tocompute the average number of events and standard deviationfor a specific day of the week. The day of week is used as it isvery important to event logs as a company that is only open 5days a week will have much fewer events on Saturday andSunday than the rest of the week. These statistics are calculatedvia the T-SQL sum() and stddev() methods. The completeSQL query can be seen in Fig. 5 below.This SQL statement (see Fig. 5) once again outputs the datainto another table so the averages and standard deviation willbe available for alerting. Unlike the counts previously, thismust be computed separately for each combination of attributesas the averages and standard deviation cannot be simply addedtogether. This means that a separate table will be used for eachlevel of granularity. Once this data is gathered, alerts can beginto be generated based on a comparison between the count tableand the statistics table(s). The formula used to generate alerts isshown below:ℎℎ ()( ) ()Alerts are generated simply by comparing the number ofevents at one point in time on a specific day of the week to theaverage number of events at that time on that day of the week.The sum, count, and standard deviation were all determined inthe last function and this function simply adds the valuestogether and applies a multiplier. If the number of events isgreater than the average plus k standard deviations, an alert isgenerated (where k is a constant that multiplies the value of thestandard deviation). In this implementation, multiple k valueswere tested to reduce the risk of false negative results. High kvalues will cause higher chance of false negatives while low kvalues will cause a higher number of false positive results. Thisis a common trade-off in security related tasks as falsenegatives are much worse than false positives. A large numberof false positives is also not a good thing to have as it causes anadministrator to waste time researching alerts that do not relateto a problem. This alerting statement is shown in Fig. 6.SELECT ServerID, UserID, EvtLog, EvtSrc, EvtID, EvtDayOfWeek,EvtDayOfYear, EvtHour, EvtMinute, EvtYear, COUNT(*) as EvtCountINTO LogCountsPerUserFROM LogBufferGROUP BY EvtYear, EvtDayOfYear, EvtDayOfWeek, EvtHour, EvtMinute,EvtLog, EvtSrc, EvtID, ServerID, UserID;Figure 4. Source code for counting events.SELECT ServerID, UserID, EvtLog, EvtSrc, EvtID, EvtDayOfWeek, EvtHour,EvtMinute, COUNT(*) as NumberOfDays, SUM(EvtCount) as EvtTotal,SUM(EvtCount)/COUNT(*) as EvtAverage, STDEV(EvtCount) as EvtStdDevINTO EventsPerUserFROM LogCountsPerUserGROUP BY EvtDayOfWeek, EvtHour, EvtMinute, EvtLog, EvtSrc, EvtID,ServerID, UserID;Figure 5. Source code for determining event averages.SELECT c.ServerID, c.UserID, c.EvtLog, c.EvtSrc, c.EvtID, c.EvtHour,c.EvtMinute, c.EvtDayOfYear, c.EvtYear, c.EvtCount,e.EvtAverage (e.EvtStdDev * 3.3) as ThresholdINTO PerUserAlertsFROM LogCountsPerUser c join EventsPerUser e on(c.ServerID e.ServerID and c.UserID e.UserIDand c.EvtLog e.EvtLog and c.EvtSrc e.EvtSrcand c.EvtID e.EvtID and c.EvtHour e.EvtHourand c.EvtMinute e.EvtMinute and c.EvtDayOfWeek e.EvtDayOfWeek)WHERE c.evtCount (e.EvtAverage (e.EvtStdDev * 3.3))Figure 6. Source code for alerting function.
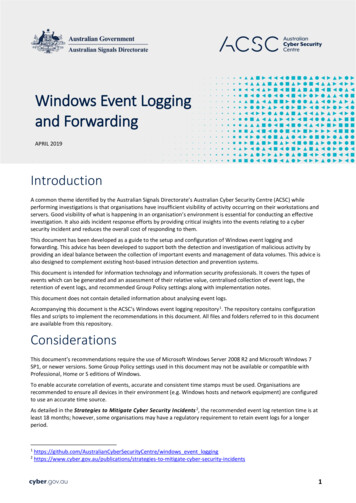
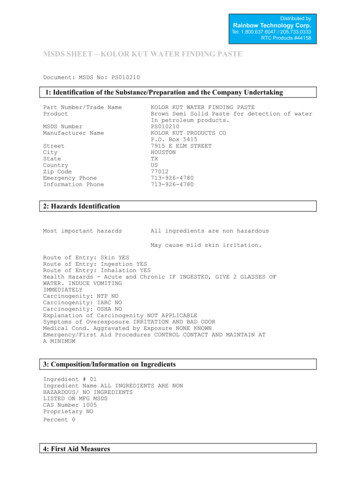
This SQL statement (see Fig. 6) will output all alerts into analert table. In a real-world environment, this table would likelyhave more values such as a description of the event to help theadministrator know more about the alert to help identify theproblem. This alert table could have triggers implementedagainst the table that generate emails to notify administrators assoon as an alert is generated. If only daily reporting is needed,SQL jobs could scrape the table daily and send a daily reportshowing the events from the previous day.The per-user alerting functions are very useful for findinganomalies for a specific user on a specific server but they areunable to alert across multiple users and multiple servers. Forthis reason, another set of functions must be created for thisability. This will show attacks that are happening across manyuser accounts and/or multiple servers. Attacks across multipleuser accounts are common with brute-force attacks to try tocrack passwords to obtain network access. Attacks acrossmultiple servers are much more prevalent than attacks againstone server as it gives an attacker more possible entry pointsinto the network. The per-user functions would not detect thesetypes of attacks as the alerting is centered around a specificuser on a specific server and thus it would not catch theanomaly. This requires counting the number of events withoutspecifying ServerID and UserID along with a slightreconfiguration of the functions for determining event averagesand alerting. The statement for counting logs can be seen inFig. 7 and the updated average and alerting statements can beseen in Fig. 8 and Fig. 9 respectively.In testing, these statements produce much better results dueto the fact that the data can show a problem across the wholeenvironment versus just a problem with one user on one serverfixing the problem with the high number of false positiveresults that can be seen in the per-user data. These statements(see Figs. 7 – 9) can be taken even a step farther to alert basedon intervals of minutes or hours. This is accomplished throughthe use of the Transact-SQL floor function. It is used to roundthe value of the EvtMinute or EvtHour field to the nearest xminute. For example, if we wanted to do alerting based on 5minute intervals, we would simply round everything to theprevious 5 minute mark (08:23 would round down to 08:20).This method allows the average and alerting per-minutefunctions to still work with a slightly modified event countingfunction. The modified statement is shown in Fig. 10.The per-minute queries are very useful to find attacksacross multiple servers and multiple users, but they still fall abit short in giving the administrator all of the informationneeded to track a possible breach. The alert will show that anevent happened on the network but it is not traced back to aspecific server or group of servers. This can be accomplishedby simply adding the per-user and per-minute functionstogether. If an alert is generated by any of the per-minutefunctions, an administrator could look for events of the sametype at the same time on the same date in the per-user alertdata. This will help the administrator trace back the problem tospecific hosts or specific user accounts at that point in time.SELECT EvtLog, EvtSrc, EvtID, EvtDayOfWeek, EvtDayOfYear,EvtHour,EvtMinute, EvtYear, Sum(EvtCount) as EvtCountINTO LogCountsPerMinuteFROM LogCountsPerUserGROUP BY EvtYear, EvtDayOfYear, EvtDayOfWeek, EvtHour, EvtMinute,EvtLog, EvtSrc, EvtID;Figure 7. Source code for counting events per-minute.SELECT EvtLog, EvtSrc, EvtID, EvtDayOfWeek, EvtHour, EvtMinute,COUNT(*) as NumberOfDays,SUM(EvtCount) as EvtTotal,SUM(EvtCount)/COUNT(*) as EvtAverage,STDEV(EvtCount) as EvtStdDevINTO EventsPerMinuteFROM LogCountsPerMinuteGROUP BY EvtDayOfWeek, EvtHour, EvtMinute, EvtLog, EvtSrc, EvtID;Figure 8. Source code for determining per-minute averages.SELECT c.EvtLog, c.EvtSrc, c.EvtID, c.EvtHour, c.EvtMinute,c.EvtDayOfYear, c.EvtYear, c.EvtCount,e.EvtAverage (e.EvtStdDev * 3.3) as ThresholdINTO PerMinuteAlertsFROM LogCountsPerMinute c join EventsPerMinute e on(c.EvtLog e.EvtLog and c.EvtSrc e.EvtSrcand c.EvtID e.EvtID and c.EvtHour e.EvtHourand c.EvtMinute e.EvtMinute and c.EvtDayOfWeek e.EvtDayOfWeek)WHERE c.evtCount (e.EvtAverage (e.EvtStdDev * 3.3));Figure 9. Source code for per-minute alerting function.
SELECT EvtLog, EvtSrc, EvtID, EvtDayOfWeek, EvtDayOfYear, EvtYear,EvtHour, Floor(EvtMinute/5)*5 as EvtMinute, Sum(EvtCount) as EvtCountINTO LogCountsFiveMinuteFROM LogCountsPerUserGROUP BY EvtYear, EvtDayOfYear, EvtDayOfWeek, EvtH
for Windows and a Snare server [7, 8]. The event logs were then imported into a SQL database using the Transact-SQL . bulk import statement [9]. Once in the database, all identifiable information was transformed using a multitude hashing algorithms to