Transcription
Deng et al. BMC Pediatrics(2019) EARCH ARTICLEOpen AccessFirst-year growth of 834 preterm infants ina Chinese population: a single-center studyYing Deng1,2, Fan Yang1,2* and Dezhi Mu1,2AbstractBackground: The aim of this study was to follow the growth and hematological indicators of preterm infantsduring their first year.Methods: Neonates below 37 gestational weeks had routine follow-ups up through 1 year from January 2012 toDecember 2015 at West China 2nd University Hospital, Sichuan University. Weight, length and head circumference(HC) were measured monthly during the first 6 months, followed by monitoring every second month until 12months. The catch-up growth defined as a gain of Z-score 0.67 according to previous study. All preterm infantswere prescribed iron prophylaxis based on national guideline. The hemoglobin concentration was examined at 6and 12 months.Results: Altogether, 132 very-low-birth-weight (VLBW), 504 low-birth-weight (LBW) and 198 normal-birth-weight(NBW) infants were followed. The rates of catch-up growth for weight, length and HC 12 months of corrected age(CA) were 22.6, 29.1 and 14.6%, respectively. SGA and VLBW infants showed higher catch-up growth rates. Theoverall prevalence of anemia was 6.8% at 6 months and 7.8% at 12 months. The Z-scores for weight-for-length,length and HC were lower in the VLBW and SGA preterm infant groups than in the other preterm groupsthroughout the first year of life. The incidences of stunting, microcephaly and wasting changed from 5, 1.3 and3.7% to 2, 1.1, 0.9 and 2.4%, respectively, during the first year. However, the incidences of wasting and stuntingwere higher for the VLBW infants than for the LBW and NBW infants at 12 months (9.3% vs. 1.4%, p 0.01; 9.3% vs.1%, p 0.01,respectively; 4.7% vs. 0.8%, p 0.01, 4.7% vs. 0%, p 0.01,respectively). Similar results were observedbetween SGA and AGA infants (8.7% vs. 1.5%, p 0.01; 5.8% vs. 0.4%, p 0.01). Logistic regression revealed SGA andVLBW as risk factors for poor growth (WLZ -2SD) at 12 months (OR 5.5, 95% CI: 2.1–14.8, p 0.01: OR 4.8, 95%CI: 1.8–12.8, p 0.01, respectively).Conclusion: The VLBW and SGA preterm infants showed significant catch-up growth during their first year of life.However, SGA and VLBW were risk factors for poor growth during the preterm infants’ first year of life. Prophylacticiron supplementation in preterm infants appears to reduce the prevalence of anemia.Keywords: Preterm infants, Catch-up growth, AnemiaBackgroundApproximately 11.1% of live births worldwide are preterm,with an estimated rate ranging from 7.2 to 13% in Asia [1].Due to dramatic advances in perinatal care, preterm infants,including very-low-birth-weight (VLBW) preterm infants(birth weight 1500 g), are able to survive the first few* Correspondence: 506742295@qq.com1Department of Pediatrics, West China Second University Hospital, Chengdu,Sichuan Province, China2Key Laboratory of Birth Defects and Related Disease of Women andChildren, Ministry of Education, Sichuan University, Chengdu 610041, SichuanProvince, Chinaweeks of life. Because survival is an expected outcome, thefocus has shifted toward improving nutrition and anthropometry. However, VLBW and small-for-gestational age(SGA) preterm infants have a higher risk of growth deviations [2]. Several studies have shown an association between impaired extra-uterine growth and poor long-termperformance [3]. The catch-up growth patterns of preterminfants have been a matter of debate. Zhao et al. [4] observed no catch-up growth in weight and length amongpreterm infants, while Westerberg et al. [5] observed thatVLBW infants showed significant catch-up growth in both The Author(s). 2019 Open Access This article is distributed under the terms of the Creative Commons Attribution 4.0International License (http://creativecommons.org/licenses/by/4.0/), which permits unrestricted use, distribution, andreproduction in any medium, provided you give appropriate credit to the original author(s) and the source, provide a link tothe Creative Commons license, and indicate if changes were made. The Creative Commons Public Domain Dedication o/1.0/) applies to the data made available in this article, unless otherwise stated.
Deng et al. BMC Pediatrics(2019) 19:403weight and length during the first year of life. Thus, an understanding of the early growth patterns of preterm infantsis important and may help improve appropriate daily carepractices and reduce the morbidity of growth deviations related to preterm birth.Growth is often assessed by comparing the weight,length, and head circumference (HC) of a child withgrowth references to a given society. Until now, no general growth references for preterm infants have existed.Fenton’s growth chart considers preterm infants, buttheir data are relevant only for the first 40 weeks of thepostnatal period, and the chart uses data from crosssectional studies and thus cannot provide longitudinalgrowth trajectories with specific gestational ages. Longerterm assessments must rely on the growth chart developed by the World Health Organization (WHO). In2006, the WHO developed growth standards for fullterm infants. To follow the longer term growth of preterm infants, the WHO growth chart is appropriatebeginning at 40 weeks (0 month) of corrected age(CA). Most investigators choose the WHO growthchart to assess the growth of preterm infants from40 weeks CA [5–8].Anemia is defined as an Hb level two standard deviations below the mean for the normal populationwhen matched for age and sex. Anemia has become amajor worldwide public health problem that affectsup to 50% of preschool-aged children. In China, theoverall rate of pediatric anemia is 19% (95% CI: 6–38%) [9]. Anemia is most often caused by iron deficiency. Iron is an essential nutrient and plays an important role in multiple processes, including pediatricgrowth and development [10]. Premature infants areparticularly vulnerable to the development of anemiadue to lower storage concentrations of iron, shorterred-blood-cell half-lives and a greater need for iron.A few reports have shown that the prevalence of irondeficiency is estimated to range between 25 and 80%among preterm infants during infancy [11]. The overall rate of infant and childhood anemia is as low as6% in developed countries [10]. However, the prevalence of anemia remains high in low-income countries[8]. Ferri et al. [12] reported a high incidence of bothiron-deficiency anemia (26.5%) and iron deficiency(48%) in a Brazilian preterm VLBW population duringinfancy. The prevalence of iron deficiency anemia interm infants was 20.8% for 7- to 12-month-old infantsin China in 2000 [13]. However, little is known regarding the prevalence of anemia in preterm infantsin China.Few cohort studies have described the first yeargrowth and hematologic indicators of preterm infants.The aim of this study was to examine the Z-scores ofweight, length and HC and the hemoglobinPage 2 of 10concentration level during the first year of life in a Chinese population cohort.Materials and methodsStudy populationThis longitudinal study comprised all infants born before37 complete gestational weeks between January 2012and December 2015 who were admitted to the pediatrichealth department of the Second University Hospital ofSichuan University. These infants had been followed upto 12 months of age. The exclusion criteria were a gestational age (GA) 37 weeks, major congenital malformations, chromosomal abnormalities or genetic syndromes,thalassemia or hemolytic anemia and failure to attendmore than three routine follow-up visits. GA was determined based on the mother’s last menstrual period orfirst-trimester ultrasonogram. In total, 834 preterm infants were included in this study (Fig. 1). Ethical approval was granted from the ethics committee at theWest China Second University Hospital, and informedconsent was obtained from all parents or guardians before the study(Chuan201021).Data collectionAnthropometric measurementsPreterm infant growth was monitored monthly forweight, length and HC during the first 6 months,followed by monitoring every second month until 12months. Month 0 CA was the first time point whichgrowth was evaluated. Growth data were obtained at theend of each month of age ( 3 days) by trained nurses atthe Department of Child Health Care of the West ChinaSecond University Hospital. Infants were weighed unclothed using digital infant scales (HJ-3000, HuaJu, ZheJiang,China), and the weight accuracy was within 0.01kg. Lengths were measured by an infant length board(WS-TCS-20, Sheng Yuang, Shanghai) and recorded tothe nearest 0.1 cm. HC was measured with a flexiblenon-stretch tape and recorded to the nearest 0.1 cm.Hematological indicatorsBlood tests were performed to screen for anemia at 6and 12 months. The blood collection method were asfollows: 1) disinfect the ring finger with alcohol-coveredcotton balls; 2) puncture it with a disposable blood needle and let the blood naturally flow out; and 3. after thefirst drop was lightly wiped with a sterile cotton ball, theblood was collected in a 0.5-ml centrifuge tube(EDTAK2 anticoagulant tube). The sample was approximately 0.2–0.3 ml. A Sysmex automated blood analyzerXT-1800i (Japan) was used to detect Hb concentration,mean corpuscular Hb concentration, and mean corpuscular volume. At 12 months, anemia was diagnosedbased on the presence of Hb levels 110 g/L, and at 6
Deng et al. BMC Pediatrics(2019) 19:403Page 3 of 10Fig. 1 study populationTable 1 Baseline characteristics of preterm infants (n 834)CharacteristicsNumber of participantsGestational age (week)VLBW13230.6 2LBW50434.5 1.6NBW19836.0 0.8Birth weight (kg)1.27 0.162.06 0.282.79 0.23WAZ for birth 0.55 1.02 0.58 0.750.27 3)SGA27(20.9)76(15.1)0(0)Characteristics of Primipara53(40.6)234(46.5)109(55.3)Maternal age at birth (years)27.0 3.327.3 4.126.9 3.0Values are mean SD or n (%). WAZ: weight-for-age Z-score; SGA:Small-for-gestational agemonths, anemia was diagnosed based on the presence ofHb levels 100 g/L [14].Feeding recommendationsAll preterm infants were prescribed iron prophylaxis (3–4mg/kg/day) and vitamin D (800 IU /day before 3 monthsand 400 IU /day thereafter), and treatments were continuedthroughout the first year of life with dosage adjustments according to physical growth conditions. The feeding recommendations were as follows: 1, low-risk preterm infants(BW 2000 g, GA 34 weeks), breastfeeding or formulafeeding; 2, moderate risk (1500 g BW 2000 g, 32 weeks GA 34 weeks), supplement breastfeeding with fortifiedbreastmilk or post-discharge formula for up to 3–6 monthsof CA; and 3, high risk (BW 1500 g, GA 32 weeks), supplement breastfeeding with fortified breastmilk or postdischarge formula through 6–12 months of CA [15].
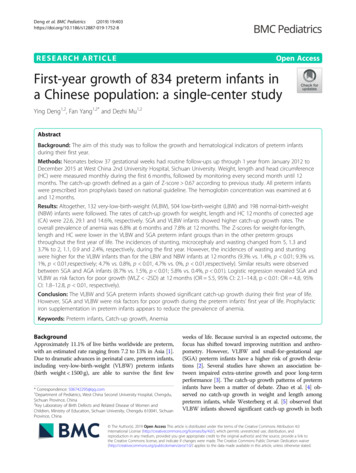
Deng et al. BMC Pediatrics(2019) 19:403Page 4 of 10Fig. 2 The trajectories of LAZ,WLZ, HCZ and BAZ in different birth weight groups during the first 12 months of corrected age. (a) The Z-scores forlength for age (LAZ) were significant higher for the normal-birth-weight (NBW) infants than for the low-birth-weight (LBW) and very-low-birthweight(VLBW) infants, p 0.01. (b) The Z-scores for weight for length (WLZ) were significant higher for the NBW infants than for the LBW andVLBW infants, p 0.01. (c) The Z-scores for head-circumference for age (HCZ) were significant higher for NBW infants than for the LBW and VLBWinfants, p 0.01. (d) the Z-scores for body mass index for age (BAZ) were significant higher for NBW infants than for the LBW and VLBWinfants, p 0.01Statistical analysisWeight, length and HC were converted to Z-scores forgender and the CA based on the WHO Child GrowthStandards [WHO Anthro (version 3.2.2, January ]. The CAwas calculated by subtracting the difference betweenterm birth and the GA at birth from the child’s chronological age. Anthropometric data are presented as Zscores based on the WHO growth charts. Z-score meanswere calculated as follows: (observed value minus themedian value of the reference population) /standard deviation (SD). SGA was defined as a birth weight belowthe 10th percentile for GA based on Fenton’s growthchart for 22–50 weeks [16]. Stunting was defined as alength-for-age Z-score (LAZ) 2 SD; microcephalywas defined as an HC-for-age Z-score (HCZ) 2 SD;and wasting was defined as a weight-for-length Zscore 2 SD. Overweight was defined as a BMI-for-ageZ-score 2 SD. Poor growth was defined as WLZ 2SD. Catch-up growth was defined as accelerated growthrate. In the Westerberg.et al’study, they investigated achange in the Z-score 0.67 between two time pointswas a cut-off value for catch-up growth [5].Data analysis was performed using SPSS software version 20.0 for Windows (SPSS Inc., Chicago, IL, USA).Categorical variables (incidence of microcephaly, stunting and wasting, and catch-up growth) were analyzedusing the chi-square test or Fisher’s exact test (T 5).Continuous variables were analyzed using Student’s ttest or ANOVA.A univariate analysis was performed to identify risk factors for poor growth. Factors were selected a priori after areview of the literature [5, 17]. Variables associated withpoor growth at p 0.10 based on the univariate analysiswere included in the final logistic regression in a forward,stepwise manner to identify risk factors (SGA, VLBW,gender, gestational age and type of pregnancy). Given thatSGA and VLBW are highly correlated variables, we constructed two models including either SGA or VLBW.Model 1 includes SGA, gender, gestational age and type ofpregnancy. Model 2 includes gender, gestational age,VLBW, and type of pregnancy [18]. GraphPad Prism (version 6.02, San Diego, California, USA) was used to plotgrowth Z-score curves at different ages, which were fittedby a third-order polynomial model. P values 0.01 wereconsidered statistically significant.
Deng et al. BMC Pediatrics(2019) 19:403Page 5 of 10Fig. 3 The trajectories of LAZ, WLZ, HCZ and BAZ in different gestational age(GA) preterm infants during the first 12 months of corrected age. (a)The Z-scores for length for age (LAZ) were significant higher for appropriate-for-gestational age (AGA) infants than for the Small-for-gestationalage (SGA) infants, p 0.01; (b) The Z-scores for weight for length (WLZ) were significant higher for AGA infants than for the SGA infants, p 0.01.(C) The Z-scores for head-circumference for age (HCZ) were significant higher for AGA infants than for the SGA infants, p 0.01;(D) the Zscores for body mass index for age (BAZ) were significant higher for AGA infants than for the SGA infants, p 0.01Table 2 the rates of growth deviations in different BW (9.3)ab7(1.4)a2(1)b0 Mon CAGrowth deviations12 Mon CAGrowth )1(0.9)a2(0.4)3(0.6)a1(0.5)5(2.5)A: significant difference between the VLBW and LBW groups, p 0.01B: significant difference the VLBW and NBW groups, p 0.01C: significant difference the LBW and NBW groups, p 0.01Mon; months. CA: corrected age; BW: birth weight; VLBW:very low birthweight, birth weight 1500 g; LBW: low birth weight, 1500 g birth weight 2500 g; NBW:normal birth weight,2500 birth weight 4000 g. Chi-square testor Fisher’s exact test was used to analyzeResultsA total of 834 preterm infants with a mean GA of34.2 2.3 (range 26–36.9) weeks and a mean birthweight (BW) of 2108.5 536.0 (range 820–3750) gramswere enrolled in this study. The study included a total of103 SGA infants; 27 (20.9%) were VLBW infants, and 76(15.1%) were low-birth-weight (LBW) infants. The baseline characteristics of the study participants are summarized in Table 1.Growth evaluated by Z-scoresSignificant differences were evident in the mean LAZ,WLZ, HCZ and BAZ from 0 months of CA to 12months of CA in the different BW and GA groups (Figs.2 and 3). These scores were lower for the VLBW infantsthan for the LBW and NBW infants. Similar results wereobserved between the SGA and AGA groups. The incidences of stunting, microcephaly and wasting changedfrom 5, 1.3 and 3.7% to 2, 1.1, 0.9 and 2.4%, respectively,during the first year for the entire cohort. However, theincidences of stunting were higher among the VLBW
Deng et al. BMC Pediatrics(2019) 19:403Page 6 of 10Table 3 the rates of growth deviations the different GA groupsSGA No.(%)pAGA No.(%)Table 5 Rate of catch-up growth in the different BW groups (%,n/N)VLBW0 Mon CAN920–6 MonStunting26(28.3)12(1.8) 0.01*0–12 MonWasting9(10)19(2.9) 0.01*LengthMicrocephalus4(4.3)6(0.9) 0.01*1(1.1)31(4.7)0.108103686Growth deviationsStunting6(5.8)3(0.4) 0.01*Wasting9(8.7)10(1.5) 0.01*Microcephalus3(2.9)3(0.4) 0.01*Overweight0(0)9(1.3)0.24Mon:months, CA: corrected age; GA: gestational age; SGA, Small-for-gestationalage: a birth weight below the 10th percentile for gestational age based onFenton’s growth chart. AGA: appropriate-for-gestational age: a birth weightbetween the 10th percentile and 90th percentile for gestational age. Chisquare test or Fisher’s exact test was used to analyze. *: statistically significantinfants than among the LBW and NBW infants (19.3%vs. 3.4% vs. 0%, p 0.01) at 0 months of CA. The incidences of wasting and stunting were higher for theVLBW infants than for the LBW and NBW infants at12 months (9.3% vs. 1.4%, p 0.01; 9.3% vs. 1%, p 0.01,respectively; 4.7% vs. 0.8%, p 0.01, 4.7% vs. 0%, p 0.01,respectively) (Table 2). The incidences of stunting,wasting and microcephaly were higher in the SGA groupthan in the AGA group at 0 and 12 months of CA (Table3).Catch-up growth evaluated by Z-score changesCatch-up growth in weight, length and HC was observedin this study population. The rates of catch-up growthfor weight, length and HC between 0 and 6 months ofCA and between 0 and 12 months of CA were 26.4, 28.4and 12.5%, respectively and 22.6, 29.1 and 14.6%, respectively (Table 4). The rates of catch-up growth forweight, length and HC were higher in the VLBW groupthan in the LBW and NBW groups at 12 months of CA(35.1% vs. 22.2% vs. 16.9%; 48.9% vs. 30.1% vs. 15.2%;29.8% vs. 14.1% vs. 7.5%) (Table 5). The rates of catchup growth for weight, length and HC were higher in theTable 4 Rate of catch-up growth at different times (%, n/N)Catch-up growth0 6 Mon0 12 MonWeight26.4 (187/707)22.6 (162/717)Length28.4(201/707)29.1(209/717)HC0–6 Mon0–12 Mon ac29(29/100)35.1(33/94)26.5(117/441)ab50(50/100) 72) b28(123/441) ac16.9(28/166) b30.1(136/451)15.7(27/172) bcHC12 Mon CANNBWWeight659Growth n: months; HC: head circumference; catch-up growth: a change in the Zscore 0.67 between two time points0–6 Mon19(19/100) b13.4(59/441) c6(10/166) bc0–12 Mon29.8(28/94) ab14.1(64/451) ac7.5(13/172) bcA: significant difference between the VLBW and LBW groups, p 0.01B: significant difference between the VLBW and NBW groups, p 0.01C: significant difference between the LBW and NBW groups, p 0.01Mon: months; HC: head circumference; VLBW:very low birth weight, birthweight 1500 g; LBW: low birth weight, 1500 g birth weight 2500 g;NBW:normal birth weight,2500 birth weight 4000 g. Catch-up growth: achange in the Z-score 0.67 between two time points. Chi-square test orFisher’s exact test was used to analyzeSGA group than in the AGA group at 6 and 12 monthsof CA (Table 6).Risk factors for poor growth at 12 monthsAt 12 m
Ying Deng1,2, Fan Yang1,2* and Dezhi Mu1,2 Abstract Background: The aim of this study was to follow the growth and hematological indicators of preterm infants during their first year. . up to 50% of preschool-aged children. In China, th