Transcription
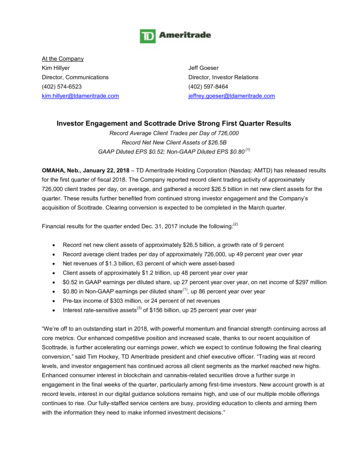
At the CompanyKim HillyerJeff GoeserDirector, CommunicationsDirector, Investor Relations(402) 574-6523(402) @tdameritrade.comInvestor Engagement and Scottrade Drive Strong First Quarter ResultsRecord Average Client Trades per Day of 726,000Record Net New Client Assets of 26.5BGAAP Diluted EPS 0.52; Non-GAAP Diluted EPS 0.80(1)OMAHA, Neb., January 22, 2018 – TD Ameritrade Holding Corporation (Nasdaq: AMTD) has released resultsfor the first quarter of fiscal 2018. The Company reported record client trading activity of approximately726,000 client trades per day, on average, and gathered a record 26.5 billion in net new client assets for thequarter. These results further benefited from continued strong investor engagement and the Company’sacquisition of Scottrade. Clearing conversion is expected to be completed in the March quarter.Financial results for the quarter ended Dec. 31, 2017 include the following:(2) Record net new client assets of approximately 26.5 billion, a growth rate of 9 percent Record average client trades per day of approximately 726,000, up 49 percent year over year Net revenues of 1.3 billion, 63 percent of which were asset-based Client assets of approximately 1.2 trillion, up 48 percent year over year 0.52 in GAAP earnings per diluted share, up 27 percent year over year, on net income of 297 million 0.80 in Non-GAAP earnings per diluted share , up 86 percent year over year Pre-tax income of 303 million, or 24 percent of net revenues Interest rate-sensitive assets(1)(3)of 156 billion, up 25 percent year over year“We’re off to an outstanding start in 2018, with powerful momentum and financial strength continuing across allcore metrics. Our enhanced competitive position and increased scale, thanks to our recent acquisition ofScottrade, is further accelerating our earnings power, which we expect to continue following the final clearingconversion,” said Tim Hockey, TD Ameritrade president and chief executive officer. “Trading was at recordlevels, and investor engagement has continued across all client segments as the market reached new highs.Enhanced consumer interest in blockchain and cannabis-related securities drove a further surge inengagement in the final weeks of the quarter, particularly among first-time investors. New account growth is atrecord levels, interest in our digital guidance solutions remains high, and use of our multiple mobile offeringscontinues to rise. Our fully-staffed service centers are busy, providing education to clients and arming themwith the information they need to make informed investment decisions.”
“While we remain focused on the experience we deliver to these clients, much more work lies ahead, startingwith delivering a successful Scottrade integration – not just operationally, but culturally as well,” Hockeycontinued. "We are a company that wants to transform lives and investing for the better, and that purpose willshape our growth strategy for years to come, inspiring the actions we take to deliver long-term value for ourclients, employees and shareholders. How we earn revenue, how we grow more agile and efficient, how weinvest in employee development and innovation – it all ladders back to our shared commitment to drivetransformational change, and we are motivated by the opportunities and potential that lies ahead.”“It was an eventful quarter as major indices hit all-time highs, the Fed raised interest rates, and a sweeping taxoverhaul was approved,” said Steve Boyle, executive vice president and chief financial officer. “These factors –paired with our first full quarter of Scottrade earnings – further boosted our growth, driving strong GAAP andNon-GAAP results for the quarter. Furthermore, with the new tax bill being signed into law before the end ofthe calendar year, we were able to realize additional significant benefits in the quarter, primarily due to a remeasurement of our deferred tax liability. There are a number of options before us in putting this incrementalrevenue to good use, and we plan to look at each of them, as well as our capital deployment plans, in greaterdetail once we’ve successfully completed the Scottrade clearing conversion.”Capital ManagementThe Company paid 119 million in its first fiscal quarter, or 0.21 per share, in cash dividends.The Company has declared a 0.21 per share quarterly cash dividend, payable on Feb. 20, 2018 to all holdersof record of common stock as of Feb. 6, 2018.Fiscal 2018 OutlookThe Company has also updated its outlook for the 2018 fiscal year to reflect the new U.S. tax legislation. Usingupdated tax rates, the company expects GAAP earnings of 1.85 to 2.45 per diluted share, and Non-GAAPearnings of 2.55 to 3.05 per diluted share(1)for its 2018 fiscal year.More information on the fiscal 2018 forecast is available through the Company’s Outlook Statement, located inthe “Financial Reports” section of its corporate website, www.amtd.com.Company Hosts Conference CallTD Ameritrade will host its December Quarter conference call tomorrow morning, Jan. 23, 2018, at 8:30 a.m.EST (7:30 a.m. CST) to discuss results and take questions from analysts. Participants may listen to theconference call by dialing 833-235-7646. Prepared remarks and an enhanced financial fact sheet containingassociated details are now available on the “Financial Reports” page of www.amtd.com under the header“Investor Relations’ Highlights.” Conference call participants are encouraged to reference these materials priorto the call.A replay of the phone call will be available by dialing 800-585-8367 and entering the Conference ID 4094307beginning at 11:30 a.m. EST (10:30 a.m. CST) on Jan. 23, 2018. The replay will be available until 11:59 p.m.EST (10:59 p.m. CST) on Jan. 30, 2018. A transcript of the call, including management remarks and Q&A, will
be available on the Company’s corporate web site, www.amtd.com, via the “Financial Reports” page beginningWednesday, Jan. 24, 2018.More information about TD Ameritrade’s upcoming corporate events and management speakingengagements, such as quarterly earnings conference calls, are available on the Company’s Corporate EventCalendar. Look for the link “Where are we?” on the “Investor Relations” page of www.amtd.com.Interested parties should visit or subscribe to newsfeeds at www.amtd.com for the most up-to-date informationon corporate financial reports, press releases, SEC filings and events. The Company also communicates thisinformation via Twitter, @TDAmeritradePR. Website links, corporate titles and telephone numbers provided inthis release, although correct when published, may change in the future.Source: TD Ameritrade Holding CorporationAbout TD Ameritrade Holding CorporationTD Ameritrade provides investing services and education to more than 11 million client accounts totaling morethan 1 trillion in assets, and custodial services to more than 6,000 registered investment advisors. We are aleader in U.S. retail trading, executing more than 700,000 trades per day for our clients, nearly a quarter ofwhich come from mobile devices. We have a proud history of innovation, dating back to our start in 1975, andtoday our team of 10,000-strong is committed to carrying it forward. Together, we are leveraging the latest incutting edge technologies and one-on-one client care to transform lives, and investing, for the better. Learnmore by visiting TD Ameritrade’s newsroom at www.amtd.com, or read our stories at Fresh Accounts.Safe HarborThis document contains forward-looking statements within the meaning of the federal securities laws. Weintend these forward-looking statements to be covered by the safe harbor provisions of the federal securitieslaws. In particular, any projections regarding our future revenues, expenses, earnings, capital expenditures,effective tax rates, client trading activity, accounts, stock price or any projections or expectations regarding theacquisition of Scottrade Financial Services, Inc., as well as the assumptions on which such expectations arebased, are forward-looking statements. These statements reflect only our current expectations and are notguarantees of future performance or results. These statements involve risks, uncertainties and assumptionsthat could cause actual results or performance to differ materially from those contained in the forward-lookingstatements. These risks, uncertainties and assumptions include, but are not limited to: general economic andpolitical conditions and other securities industry risks, fluctuations in interest rates, stock market fluctuationsand changes in client trading activity, credit risk with clients and counterparties, increased competition,systems failures, delays and capacity constraints, network security risks, liquidity risks, new laws andregulations affecting our business, regulatory and legal matters, difficulties and delays in integrating theScottrade business or fully realizing cost savings and other benefits from the acquisition; business disruptionfollowing the Scottrade acquisition, changes in asset quality and credit risk, the inability to sustain revenue andearnings growth, changes in interest rates and capital markets, inflation, customer borrowing, repayment,investment and deposit practices, customer disintermediation, the introduction, withdrawal, success and timing
of business initiatives, competitive conditions, disruptions due to Scottrade integration-related uncertainty orother factors making it more difficult to maintain relationships with employees, customers, other businesspartners or governmental entities, the inability to realize synergies or to implement integration plans and otherconsequences associated with mergers, acquisitions and uncertainties and other risk factors described in ourlatest Annual Report on Form 10-K, filed with the SEC on Nov. 17, 2017, and in other filings with the SEC.These forward-looking statements speak only as of the date on which the statements were made. Weundertake no obligation to update or revise publicly any forward-looking statements, whether as a result of newinformation, future events or otherwise, except to the extent required by the federal securities laws.1See attached reconciliation of non-GAAP financial measures2Please see the Glossary of Terms, located in “Investor” section of www.amtd.com for more information on howthese metrics are calculated.3Interest rate-sensitive assets consist of spread-based assets and money market mutual funds. Ending balancesas of December 31, 2017.Brokerage services provided by TD Ameritrade, Inc., member FINRA (www.FINRA.org) /SIPC (www.SIPC.org).
TD AMERITRADE HOLDING CORPORATIONCONSOLIDATED STATEMENTS OF INCOMEIn millions, except per share amounts(Unaudited)Revenues:Transaction-based revenues:Commissions and transaction feesAsset-based revenues:Bank deposit account feesNet interest revenueInvestment product feesTotal asset-based revenuesOther revenuesNet revenuesDec. 31, 2017Quarter EndedSept. 30, 2017Dec. 31, 2016 19449014859Operating expenses:Employee compensation and benefitsClearing and execution costsCommunicationsOccupancy and equipment costsDepreciation and amortizationAmortization of acquired intangible assetsProfessional servicesAdvertisingOtherTotal operating 6222143635442419535724506Operating r expense:Interest on borrowingsLoss on sale of investmentsLoss on early extinguishment of debtTotal other expensePre-tax incomeProvision for income taxes (1)Net income 297 211 216Earnings per share - basicEarnings per share - diluted 0.520.52 0.400.39 0.410.41Weighted average shares outstanding - basicWeighted average shares outstanding - dilutedDividends declared per share567569 0.21534536 0.18527530 0.18(1) The provision for income taxes was lower during the December 2017 quarter due to the realization of approximately 78 million ofafter-tax benefits, primarily as a result of the enactment of the Tax Cuts and Jobs Act for which we recorded a provisional estimate forthe remeasurement of our deferred income tax balances.
TD AMERITRADE HOLDING CORPORATIONCONDENSED CONSOLIDATED BALANCE SHEETSIn millions(Unaudited)Assets:Cash and cash equivalentsSegregated cash and investmentsBroker/dealer receivablesClient receivables, netInvestments available-for-sale, at fair valueGoodwill and intangible assetsOtherTotal assetsDec. 31, 2017Sept. 30, 2017 1,64410,1361,29118,578995,6292,03539,412 3,06425,2862,5311,09831,9797,433 2,50425,1072,5551,21431,3807,247 39,412 38,627 es and stockholders' equity:Liabilities:Broker/dealer payablesClient payablesLong-term debtOtherTotal liabilitiesStockholders' equityTotal liabilities and stockholders' equityNOTE: The Condensed Consolidated Balance Sheets include provisional estimates relatedto the assets acquired and liabilities assumed in the Scottrade acquisition. Theseprovisional estimates may be prospectively adjusted in the event new information becomesavailable regarding facts and circumstances which existed at the date of acquisition.
TD AMERITRADE HOLDING CORPORATIONSELECTED OPERATING DATA(Unaudited)Dec. 31, 2017Key Metrics:Net new assets (in billions)Net new asset growth rate (annualized)Average client trades per dayQuarter EndedSept. 30, 2017Dec. 31, 2016 26.59%726,438 19.99%528,741 4.2%21.5%41.8%41.1%39.5%16.9%25.1%46.1%Interest coverage ratio (EBITDA /interest on borrowings) 2019.8 2317.9 1428.3Cash and cash equivalents (in billions) 1.6 1.5 1.7 0.1 0.2 0.8Profitability Metrics:Operating marginPre-tax marginReturn on average stockholders' equity (annualized)Net profit margin(1)EBITDA as a percentage of net revenuesLiquidity Metrics:Interest on borrowings (in millions)(1)Liquid assets available for corporate investingand financing activities (1)(2) (in billions)Transaction-Based Revenue Metrics:Total trades (in millions)45.433.030.4 7.5462.5 98 7.7262.5 75 9.0662.5 79 119.131.6 150.7 95.026.7 121.7 93.324.4 117.7Bank deposit account fee revenue (in millions)Net interest revenue (in millions)Spread-based revenue (in millions) 381276 657 307210 517 245151 396Avg. annualized yield - bank deposit account feesAvg. annualized yield - interest-earning assetsNet interest margin Fee-Based Investment Metrics:Money market mutual fund fees:Average balance (in billions)Average annualized yieldFee revenue (in millions) 3.80.43% 4 3.60.43% 4 3.70.38% 3 226.20.22% 129 196.20.22% 111 166.70.21% 91 230.00.23% 133 199.80.22% 115 170.40.22% 94Average commissions per trade (3)Trading daysOrder routing revenue (in millions)Spread-Based Asset Metrics:Average bank deposit account balances (in billions)Average interest-earning assets (in billions)Average spread-based balances (in billions)Market fee-based investment balances:Average balance (in billions)Average annualized yieldFee revenue (in millions)Average fee-based investment balances (in billions)Average annualized yieldInvestment product fee revenue (in millions)(1)See attached reconciliation of non-GAAP financial measures.(2)Effective in March 2017, the liquid assets available for corporate investing and financing activities metric wasrevised. Prior periods have been updated to conform to the current presentation.(3)Effective in September 2017, the average commissions per trade metric was revised to exclude order routing revenue.Prior periods have been updated to conform to the current presentation.NOTE: See Glossary of Terms on the Company's website at www.amtd.com for definitions of the above metrics.
TD AMERITRADE HOLDING CORPORATIONSELECTED OPERATING DATA(Unaudited)Dec. 31, 2017Client Account and Client Asset Metrics:Funded accounts (beginning of period)Funded accounts (end of period)Percentage change during periodClient assets (beginning of period, in billions)Client assets (end of period, in billions)Percentage change during periodQuarter EndedSept. 30, 2017Dec. 31, 950,0007,046,0001% 1,118.5 1,178.85% 882.4 1,118.527% 773.8 797.03%Net Interest Revenue:Segregated cash:Average balance (in billions)Average annualized yieldInterest revenue (in millions) 9.91.09% 28 7.70.93% 18 8.70.30% 7Client margin balances:Average balance (in billions)Average annualized yieldInterest revenue (in millions) 17.64.25% 191 13.84.08% 144 11.93.56% 108 1.1 2.6 53 1.1 2.4 41 0.9 1.9 33Other cash and interest-earning investments:Average balance (in billions)Average annualized yieldInterest revenue - net (in millions) 3.00.82% 6 4.10.79% 8 2.90.44% 3Client credit balances:Average balance (in billions)Average annualized costInterest expense (in millions) 21.40.03%( 2) 16.60.02%( 1) 16.10.01%( 0)Average interest-earning assets (in billions)Average annualized yieldNet interest revenue (in millions) 31.63.42% 276 26.73.08% 210 24.42.42% 151Securities borrowing/lending:Average securities borrowing balance (in billions)Average securities lending balance (in billions)Net interest revenue - securities borrowing/lending (in millions)NOTE: See Glossary of Terms on the Company's website at www.amtd.com for definitions of the above metrics.
TD AMERITRADE HOLDING CORPORATIONRECONCILIATION OF NON-GAAP FINANCIAL MEASURESDollars in millions, except per share amounts(Unaudited)Non-GAAP Net Income and Non-GAAP Diluted EPS (1)Net income and diluted EPS - GAAPNon-GAAP adjustments:Amortization of acquired intangible assetsAcquisition-related expensesIncome tax effect of above adjustmentsNon-GAAP net income and non-GAAP diluted EPSQuarter EndedSept. 30, 2017AmountDiluted EPSDec. 31, 2017AmountDiluted EPS 297 38179(59)455 0.52 0.070.31(0.10)0.80 211 2261(31)263 29723.6% 34382063952.7%3.0%1.6%0.5%31.4%Dec. 31,2017Liquid Assets Available for Corporate Investing and Financing Activities (3)Cash and cash equivalents - GAAPLess: Non-corporate cash and cash equivalentsCorporate cash and cash equivalentsCorporate investmentsLess: Corporate liquidity maintained for operational contingenciesAmounts maintained for corporate working capitalAmounts held as collateral for derivative contracts, netExcess corporate cash and cash equivalents and investmentsExcess regulatory net capital over management targetsLiquid assets available for corporate investing and financing activities - non-GAAP 89 1,472(1,174)298714(723)(87)(40)16246208 0.040.11(0.05)0.49 21121.5% 2822231274112.8%2.2%2.3%12.9%41.8%As ofJune 30,2017Sept. 30,20171,644(844)800(723)(65)(8)4850.39 216 193(8)230Quarter EndedSept. 30, 2017 % of Net Rev.Dec. 31, 2017 % of Net Rev.EBITDA (2)Net income - GAAPAdd:Depreciation and amortizationAmortization of acquired intangible assetsInterest on borrowingsProvision for income taxesEBITDA - non-GAAP 2,880(973)1,907747(723)(87)(34)1,8108 1,818 2,231(1,286)945747(723)(87)(40)842122964 0.41 0.030.01(0.02)0.43 1.85 0.250.72(0.27)2.55 2.45 0.250.56(0.21)3.05Dec. 31, 2016% of Net Rev. 21625.1% 2419141233962.8%2.2%1.6%14.3%46.1%Mar. 31,2017 Fiscal Year EndingSept. 30, 2018*Diluted EPS RangeDec. 31, 2016AmountDiluted EPSDec. 31,2016 1,662(1,203)459747(773)(87)(32)314478792Note: The term "GAAP" in the following explanation refers to generally accepted accounting principles in the United States.* Represents the range of the Non-GAAP Diluted EPS included within the January 22, 2018 Outlook Statement.(1) Non-GAAP net income and non-GAAP diluted earnings per share (EPS) are non-GAAP financial measures as defined by SEC Regulation G. We define non-GAAP net income as net income adjusted to remove the after-taxeffect of amortization of acquired intangible assets and acquisition-related expenses. We consider non-GAAP net income and non-GAAP diluted EPS as important measures of our financial performance bec
detail once we’ve successfully completed the Scottrade clearing conversion.” Capital Management The Company paid 119 million in its first fiscal quarter, or 0.21 per share, in cash dividends. The Company has declared a 0.21 per share quarterly cash dividend, payable on Feb. 20, 2018
