Transcription
Center for the Study of Hate & Extremism-California State University, SanBernardinoSpecial Status Report: Hate Crime Increases 22% in Major Metro Areas in 2016By Prof. Brian Levin Analytic Charting by Prof. Kevin GrishamHate crimes have increased significantly in 2016, hitting multi-year highs, in nine of tenof the nation’s larger urban areas that have official data available according to a justreleased study by the Center for the Study of Hate and Extremism at California StateUniversity, San Bernardino.The combined increases last year of 21.7% in the areas surveyed include the nation’sthree largest cities. If these increases hold for the rest of the nation, 2016 will be the firsttime since 2004, when America has had back to back annual increases in hate crime.When combined, the overall number of hate crimes, increased to 1267 in 2016 from1041 in 2015. These ten localities cover nearly twenty-one million residents spreadacross the nation. When all of New York State is added, the number of residentscovered expands to cover 9.7% of the American population, with a slightly lower overallincrease in hate crime of nearly 21%.Hate crime in Chicago rose 20% in 2016, 24% in New York City, 15% in Los Angles,50% in Philadelphia, with the largest increase, 62%, in Washington DC. Seattle with anonly 6% increase, and Columbus, Ohio, with a 9.8% rise were the only jurisdictionswhere percentage increases fell below double digits.Long Beach, CA, had the smallest number of hate crimes of the agencies surveyed,declining by four incidents or 33% last year, but it has already equaled its 2016 totals inthe first two months of 2017. Only several agencies had 2017 data with New York Citybeing the only other jurisdiction showing a clear 2017 increase.New York City Hate Crime Up in 2016-17, Partly Due to Surge In Anti-SemiticCasesThrough March 5, New York City hate crimes have more than doubled, 113%, whencompared with the same period last year, driven in large part by a surge in anti-Semitichate crimes which soared 189% in 2017, from just 19 in 2016 to 55 so far this year.Through March 13 there have been about 157 threats against Jewish institutions thisyear. Last year there were 664 anti-Semitic hate crimes in the U.S. according to the FBI,representing a 9% increase following a general saw-tooth decline over a decade. About1/6 of the nation's Jews reside in New York City, with about 26% residing within NewYork State. In the nation’s second largest cluster of Jewish people, Los Angeles, hatecrimes against Jews declined in 2016 by about 20%, while hate crimes against Muslimsfell from nine to five or 44%.Post Election Spike Confirmed, But Not Across the BoardOther cities with more limited data such as Philadelphia, Chicago and Seattle do notshow significant overall increases in hate crime so far this year. Some, but not all,agencies that broke data down by month, showed significant increases around electiontime in November and December 2016. East coast cities like New York City,Philadelphia, Montgomery County, Maryland were among those jurisdictionsexperiencing precipitous increases in hate crime during that period in 2016. Similarly,
Los Angeles showed a 29% increase in the fourth quarter of 2016, when compared withthe previous year. However, mid-west cities including Chicago, Columbus and Cincinnatidid not experience significant increases reported during that period. Our study last yearfound a correlation between political speech by leaders and spikes or declines in hatecrimes following terrorist attacks depending on whether the message was tolerant orconfrontational.Groups targeted varied significantly by jurisdiction with Jews being the most frequenttarget in New York and Montgomery County, MD, while the LGBT community was themost targeted in Chicago and Washington, DC. Nationally, racial anti-black hate crimehas been by far the most common every year since data collection began 25 years ago.Other DataCriminal hate crime incidents reported to police increased 6.8 percent in the UnitedStates in 2015; according to official FBI data released in November 2016. There were5,850 incidents in 2015, compared to 5,479 reported in 2014. In contrast, in Septemberthe FBI figures for violent crime overall showed an increase of only 3.9%. Bureau ofJustice Statistics victimization phone survey data over the last decade has showed awide disparity between their annual hate crime data, which has been averaging slightlybelow 300,000, and the FBI’s data, which like our report here, rely only on crimesactually reported to police and properly categorized by them. These official numberslikely represent a significant undercount.The Southern Poverty Law Center counted 1372 bias incidents from election day throughFebruary 7, 2016 through an intake webpage of self reported incidents and news reports,but there was no breakdown differentiating criminal acts from slurs and other forms ofnoncriminal harassment. Our internal data indicate that the total number of actual crimesis a fraction of that total. Similarly, the website ThinkProgress using a more rigid datacollection methodology found only 267 hate incidents between election day andFebruary 9, 2017. Nonetheless, the Southern Poverty Law Centers data collection effortrapidly and efficiently captured trends relating to an increase in manifestations ofintergroup conflict, particularly in the immediate weeks following the election that hasbeen replicated in the data presented here across several jurisdictions. It also founddirect references to President Trump or the election in over one third of the incidentsright after the election. The group also found a small increase of 3 percent in the numberof hate groups from 892 to 917, but a tripling of anti-Muslim groups. Various newpartnerships are emerging to collect both criminal and non-criminal incidents of hate.
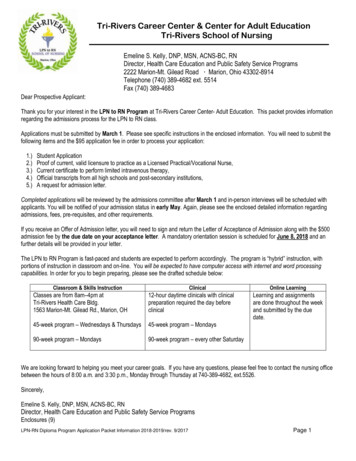
Multi-City Hate Crime Compilation- 2016: Official DataTABLE 1: HATE CRIME IN THE U.S.: Major Cities By Year, Criminal IncidentsPolice designated hate crime occurrences across major metro areas covering 21 million residents totalJurisdictionPopul. (’15) /Rank2016Totals for all tenlocalities1267 21.7%2015201420132012201120106628350 27%*1381041U.S. 321,418, 820 TBAFBI Hate Cr. USA11/175850547959286573 6.7%-7.6%-9.8%5.6%6222-6.1%New York City, NY8,550,405 (1)380 24%307--308-2%315-16%374 55%242-31%Los Angeles, CA3,971,883 (2)230 15%200*152*114*124*170Chicago, IL2,720,546 (3)71 20%59-8%64 8.5%59-13%68 33%*51 11%*46Philadelphia, PA1,567,442 (5)21 50%14 8%13-19%16 33%12-8%13* 63%8*Montgomery,County, MD1,030,447 (41-Cnty)94 42%66 65%40 43%28 17%24##213 9.8%194 30%149* 10%*136 209%*4410%*40-13%*4689 6%84 65%51 55%33 6.5%31##Columbus, OH850,106 (15)Seattle, WA684,451 (18)
Washington, DC672,228 (22)66-7%71 1%70-14%81-12%92 61%57*Long Beach, CA474,140 (37)107 62%8-33%*12 20%*10 100%*5 25%*4-33%*6-40%*10Cincinnati, OH298,550 (66)54 38.5%39-28%54* 315%13* 18%*11 22%*9-10%*10*FBIData#Frmtchng.Or N/ANotes:Total Increase for hate crimes in all ten cities in table for 2016: 1267 versus 2015: 1041 21.7%Total Increase for all ten cities and rest of New York State (not in table): 2016: 1494versus 2015: 1239, 20.6% These jurisdictions constitute 9.7% of U.S. populationNew York State Total Hate Crimes including NYC (not in table) 2016 20% 607, over505 in 2016New York City:New York City 2017 YTD/2016 YTD, Through March 5: Overall Hate Crime, 113%,from 47 to 100; Anti-Jewish 189%Election Time Increase: 11/8-11/22 2016; 30 reported hate crimes, 11/8-11/22 2015 6reported hate crime.New York City home to nation’s largest population of Jewish residents at 1.1 million.25.7% of Jewish Americans reside in New York State.New York City Hate Crime Year To Date Through March 5Motivation20172016% 9-100%300%0%200%150%167%-25%189%
SEXUAL ORIENTATION13944%WHITE3250%Grand Total10047113%Table Courtesy of NYPD/DCPINew York City Hate Crime2016 8ORIENTATIONWHITE169SEMITIC140 126TOTAL380309Note: Variance in state vs. city totals (307/309)Source: NYPD/HCTF via NYPD/DCPI; New York State DCJShttps://www.youtube.com/watch?v NEbuv0kPJp0New York State2016:607 20.2%2015:505 -9.5%2014:558 -9.6%2013:617 -16%2012:734 32%2011:556Source:New York State DCJS 2633756.htmlLos Angeles: 4th Quarter 2016 up 29% from 2015 Anti-Muslim and Jewish crimes down44% and 19.6 respectively.Source: LAPD Hate Crime UnitChicago: 2017 YTD March 3, 13 hate crimes. Most common victims, LGBT followed byanti-Black and anti-Jewish.
Election Time Increase: No apparent increases.Note: Slight variation in total incidents (71-73)Chicago Police Dept. via hia: Election Time Increase: 9 or 43% of hate crimes were in Nov./Dec. 2016Philadelphia Police DepartmentMontgomery County, MD: 40% of total or 38 were religious bias with 31 anti-Jewishand three anti-Muslim. 36% racial bias with 20 of 33 cases being anti-Black.Election Time Increase: 36% of hate crimes in 2016 were in Nov./Dec. with 18 in Nov.and 14 in Dec. In 2015 there were only 12 hate crimes in Nov./Dec. compared with 32last year.Sources: Montgomery County Police -after-Post-Election-Flurry/Columbus, OH: Election Time Increase: No increase from preceding three months andeven with 2015. FBI data used for earlier years.Source: Ohio Incident Based Reporting SystemSeattle, WA: 10 hate crimes YTD 2017. When crimes “with bias element” that did notreach threshold of state “malicious harassment” hate crime statute are included, overallincrease is 25% for 2016.City changed formatting of hate crimes several years ago.Source: Seattle Police DepartmentWashington, DC: Most frequent target: sexual orientation, 40 cases 2016, 27 in 2015;Gender identity, 19 in 2016, 10 in 2015, religion 18 in 2016 (12 anti-Jewish), 5 in 2015,race 14 in 2016, 19 in 2015, national origin/ethnicity 12 in 2016, 3 in hate-crimes-dataLong Beach, CA: As many hate crimes, 8, in 2017 for January and February as all of2016.Source: LBPD via Long Beach Press TelegramCincinnati, OH: Election Time Increase: None form preceding month or same periodprior year.Source: Ohio Incident Based Reporting System
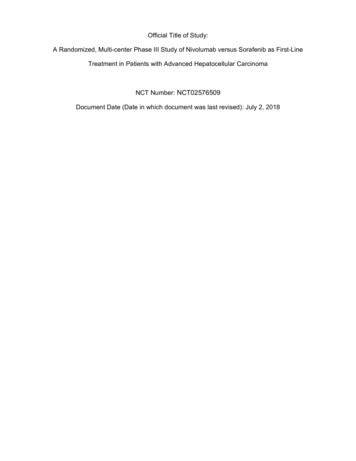
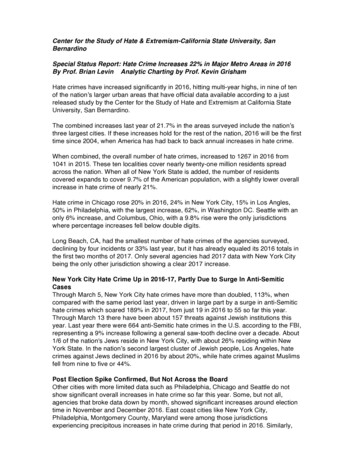
Comparison of Hate Crimes Occurences inSeven Metropolitan AreasOccurences of Hate hicago, ILPhiladelphia, PNMontgomery Cnty., MDColumbus, OHSeattle, WAWashington, DCCincinnati, OH
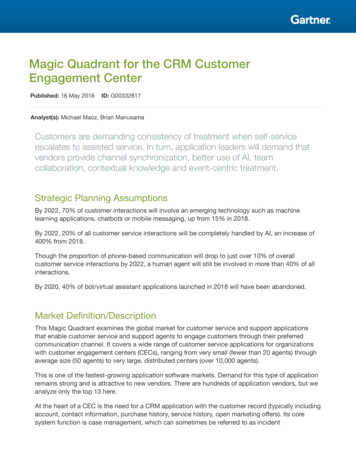
Comparison of Hate Crimes Occurences inEight Metropolitan Areas(Percentage of Change from 2015 to 2016)% of Change (2015 to %Metropolitan AreasData collected by Brian Levin, Director of Center for the Study of Hate and Extremism;Charts created by Dr. Kevin E. Grisham, Assistant Director of Research, Center for theStudy of Hate and ExtremismNumber of OccurencesHate Crime OccurenceNew York 420152752422009201020112012Years (2006-2016)Sources: NYC data from NYPD/DCPI2016
Hate Crime OccurenceChicago71Number of Years (2010-2016)Chicago data from Chicago Police Department. via DNA Info/Tanveer Ali; Chicago Police 11-20%2010% of Change from Previous YearHate Crime Occurence% of Change Over Previous YearChicagoYears (2010-2016)Chicago data from Chicago Police Department. via DNA Info/Tanveer Ali; Chicago Police DepartmentData collected by Brian Levin, Director of Center for the Study of Hate and Extremism;Charts created by Dr. Kevin E. Grisham, Assistant Director of Research, Center for theStudy of Hate and Extremism
Hate Crime OccurenceSeattleNumber of Occurences848951313320122013201420152016Years (2012-2016)Seattle data from Seattle Police Department Bias Crime Unit% of Change from Previous YearHate Crime OccurenceRate of Change Over Previous Years (2012-2016)Seattle data from Seattle Police Department Bias Crime UnitData collected by Brian Levin, Director of Center for the Study of Hate and Extremism;Charts created by Dr. Kevin E. Grisham, Assistant Director of Research, Center for theStudy of Hate and Extremism
Hate Crime OccurenceMontgomery County, MarylandNumber of Occurences946640282420122013201420152016Years (2012-2016)% of Change from Previous YearMontgomery County data from Montgomery County, Maryland Police Department; Maryland State Police.Hate Crime OccurenceRate of Change Over Previous YearMontgomery County, rs (2012-2016)Montgomery County data from Montgomery County, Maryland Police Department; Maryland State Police.Data collected by Brian Levin, Director of Center for the Study of Hate and Extremism;Charts created by Dr. Kevin E. Grisham, Assistant Director of Research, Center for theStudy of Hate and Extremism
Criminal hate crime incidents reported to police increased 6.8 percent in the United States in 2015; according to official FBI data released in November 2016. There were 5,850 incidents in 2015, compared to 5,479 reported in 2014. In contrast, in September the FBI figures for violent