Transcription
Control Engineering Practice 58 (2017) 107–116Contents lists available at ScienceDirectControl Engineering Practicejournal homepage: de combustion in a mild hybrid electric vehicle. Part 2: Three-waycatalyst considerations⁎Sandro Nüesch , Anna G. StefanopoulouDepartment of Mechanical Engineering, University of Michigan, 2350 Hayward, Ann Arbor, MI 48109, USAA R T I C L E I N F OA BS T RAC TKeywords:Homogeneous charge compression ignition(HCCI) combustionMild HEVInternal combustion enginesPowertrain controlCombustion mode switchSupervisory controlThree-way catalystThis is the second of a two-part study that discusses multimode combustion in a mild hybrid electric vehicle.Homogeneous charge compression ignition (HCCI) combustion oxidizes the oxygen storage capacity (OSC) ofthe three-way catalyst (TWC), thereby removing the TWC's ability to convert NOx under lean conditions.Despite prolonged operation in HCCI mode, enabled by the electric motor, the depletion of the OSC causessignificant penalties in fuel economy and the amounts of tailpipe NOx are substantial. Counter-intuitively, it isseen that decreasing the sizes of both HCCI regime and OSC results in reduced tailpipe NOx while maintainingfuel economy benefits.1. IntroductionThis is the second part of a two-part simulation study on multimodecombustion in a hybrid electric vehicle (HEV). In particular it isfocused on a SI/HCCI engine integrated in a 48 V-like mild HEV. Inthe previous paper (Part 1, (Nüesch & Stefanopoulou, 2016)) fourdifferent supervisory control strategies are compared in terms of fueleconomy. A finite state combustion mode switch model, presented inNüesch, Gorzelic, Jiang, Sterniak, and Stefanopoulou (2016), is used todescribe mode switch dynamics and fuel penalties during the switching. The optimal torque-split between engine and integrated startergenerator (ISG) is based on an equivalent consumption minimizationstrategy (ECMS) with four supervisors responsible for deciding, whento switch between SI and HCCI mode. It was seen that during theFTP75 drive cycle the relative fuel economy benefit of multimode overSI-only combustion is significantly greater in case of the mild HEVcompared to the conventional vehicle. This suggests a great synergybetween the ISG's torque assist and HCCI's high efficiency. Further itwas concluded that, especially during the HWFET drive cycle, it isnecessary to integrate the battery's state-of-charge (SOC) into the modeswitching decision. The associated optimal strategy would switch out ofHCCI as soon as a low SOC is reached and would not allow to furtherextend the residence time in the mode.However, besides the dynamics and penalties connected to thecombustion mode switch it is important to also consider the interactionof the multimode engine with the aftertreatment system in both, drivecycle simulations and supervisory control. Aftertreatment systems forlean engines are generally very expensive. HCCI's low engine-out NOxoffers the potential to use a relatively inexpensive three-way catalyticconverter (TWC). In stoichiometric SI the TWC reduces all emissionsas usual. In lean HCCI the TWC would still be able to reduce HC andCO while break-through of relatively low NOx might be acceptable. Thisarchitecture, however, has two drawbacks. First, the low exhausttemperatures of HCCI might lead to cool-down of the TWC, therebyresulting in low conversion efficiencies for CO and HC. This problemhas been addressed in a control strategy by Kulzer, Sauer, Karrelmeyer,and Fischer (2007). Second, lean HCCI operation results in filling ofthe TWC's oxygen storage capacity (OSC). In SI operation the OSCrepresents a buffer for deviations from stoichiometry. To maintain highconversion efficiencies in SI, rich operation is required to deplete theOSC, thereby resulting in large fuel penalties. These penalties have thepotential to significantly reduce HCCI's original efficiency benefits, asshown in Nüesch, Jiang, Sterniak, and Stefanopoulou (2015).Experimental results on the OSC dynamics during combustion modeswitching have been presented in Chen, Sima, Lin, Sterniak, and Bohac(2015).Abbreviation: AFR, air-fuel ratio; ECMS, equivalent consumption minimization strategy; ECU, engine control unit; HCCI, homogeneous charge compression ignition; HEV, hybridelectric vehicle; ISG, integrated starter-generator; OSC, oxygen storage capacity; SI, spark-ignited; SOC, state-of-charge; TWC, three-way catalytic converter; Bsl, baseline; Opt, optimal;ph, phase; sw, switch; OC, open-circuit; des, desired; al, auxiliary load; cl, clutch; sat, saturated; act, actual; cat, catalyst; amb, ambient; cond, conduction; conv, convection; geo,geometric; ri, rich; Sml, small; Str, stratified⁎Corresponding author.E-mail addresses: snuesch@umich.edu (S. Nüesch), annastef@umich.edu (A.G. rac.2016.10.007Received 14 December 2015; Received in revised form 2 October 2016; Accepted 17 October 2016Available online 28 October 20160967-0661/ 2016 Elsevier Ltd. All rights reserved.
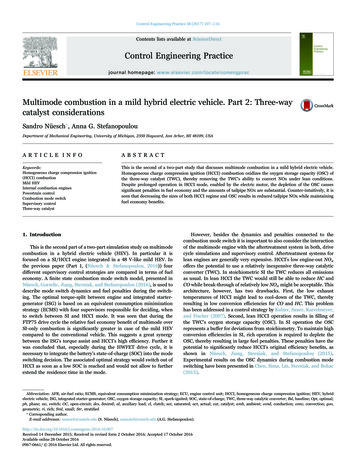
Control Engineering Practice 58 (2017) 107–116S. Nüesch, A.G. Stefanopoulousince AFR-control does not always guarantee operation at exactstoichiometry, especially during transients. Therefore, a full OSC needsto be depleted by operating the engine rich as soon as SI combustion isreached. In this paper a phenomenological OSC model by Brandt,Wang, and Grizzle (2010) is applied. The model is based on a saturatedintegrator with a single state describing the current relative OSC Θ. Theimplementation and parameterization of the model as well as strategiesto deplete the OSC are described in Nüesch et al. (2015). For theconvenience of the reader the equation describing the oxygen storageestimator is repeated here:In this paper the mild HEV model with SI/HCCI multimode enginefrom Nüesch and Stefanopoulou (2016) is extended in two ways, firstwith an engine exhaust temperature model by Gao, Conklin, Daw, andChakravarthy (2010) to describe the TWC's temperature and secondwith a TWC model, described in Nüesch et al. (2015) to simulate theOSC dynamics. This simulation is used to analyze drive cycle fueleconomy as well as tailpipe NOx emissions of the system. Further, twocase studies are presented, outlining the influence of different hardware design on fuel economy and NOx emissions.Closely related research has been presented in Nüesch et al. (2016).This article expands on that work by providing more details on theTWC model and its validation with experiments. Further a small casestudy is added which approximates conditions during a stratifiedHCCI-SI mode switch. This paper is organized as follows: In Section2 the TWC model is presented. In Section 3 the applied supervisorycontrol strategies are summarized. The drive cycle results are discussedin Section 4, followed by the case studies in Section 5.0. 23·ṁ exh 1 ̇Θ · 1 λC0,1exh (1)with ṁexh and λexh mass flow and relative AFR of the exhaust, respectively, and C0,1 the estimated OSC. Model parameters, e.g., C0,1 0.7, were identified in Nüesch et al. (2015) using lean-richcycling experiments. As can be seen, the applied oxygen storage modelneglects the influence of temperature. More detailed models oxygenstorage dynamics, e.g., the control-oriented model by Kibitz, Onder,and Guzzella (2012), take into account reaction rates, rather thansimplifying the process using an integrator. Temperature directlyaffects those reaction rates through, as shown in Arrhenius relationships.2. Vehicle modelThe longitudinal vehicle model was parameterized for a stockCadillac CTS 2009 with 6-speed manual transmission and a curb massof 1700 kg. It is described in detail in Nüesch and Stefanopoulou(2016). Chassis dynamometer data was used to validate the vehiclemodel qualitatively, e.g., in terms of load profile, and quantitatively,e.g., in terms of drive cycle fuel economy. The differences betweenmeasured and simulated fuel economy were: FTP75 ( 0.5%), HWFET( 9.4%), and US06 ( 4.5%). More details on its validation is providedin Nüesch (2015). In the following section it is focused on requiredadditions to integrate the model of the TWC aftertreatment system.2.1.2. Brick temperatureThe second way HCCI combustion is able to affect the TWC is itslow exhaust temperature. As discussed in Kulzer et al. (2007) prolonged residence in HCCI can lead to decrease in TWC brick temperature, which in turn leads to a reduction in its conversion efficiency forCO and HC. Therefore the TWC's brick temperature needs to bemonitored to initiate a switch back to SI combustion.For many reasons accurate modeling of TWCs is a demanding task.Various aspects need to be taken into account, e.g., two distinct phases,temperature, mass, chemical composition, temporal and two spatialdimensions. In general, the temperature dynamics of the gas phase aresignificantly faster than the ones in the solid phase. Solving suchcoupled differential equations is not trivial. Depending on the application, TWC need to be simplified to allow computation in a reasonableamount of time. A simplified TWC temperature model provided byGuzzella and Onder (2010) distinguishes between the temperature ofthe gas phase ϑg and the brick temperature ϑb. However, similar toSanketi and Hedrick (2005), Kum, Peng, and Kucknor (2011), themodel applied in this article has been even further reduced to 0D toallow for fast computation when simulating entire drive cycles. It needsto mentioned that this also significantly reduces the accuracy of themodel.2.1. Aftertreatment systemA central aspect of the supervisory control of a multimodecombustion engine is its interaction with the aftertreatment system.The system used in this article was parameterized based on two TWCsin series. The first TWC is based on two bricks which are located in asingle can. Its two substrates are based on Pd and PdRh. The secondTWC is located underfloor and is based on a PdRh substrate. The TWCsoffer generous OSC based on CeO2-ZrO2. More on the experimentalsetup and the applied hardware can be found in Chen et al. (2015). Theclose coupled TWC is used for control purposes. Its inputs and outputsare shown in Fig. 1. Its volume Vcat is 1.29 L and its gas volumefraction ϵcat is 0.8. As can be seen, relative AFR is measure up- anddownstream of the first TWC using a wide-range and a switching-typeλ-sensors, respectively. The measurements are used to estimate the relative OSC Θ . More on this estimation strategy can be found inNüesch et al. (2015).ϵcat Vcat ρexh cv, g2.1.1. Oxygen storageThe excess O2 during lean HCCI operation leads to saturation of theTWC's OSC. With a full OSC the TWC is unable to reduce the engineout NOx when facing lean exhaust gas. This may be acceptable undercertain HCCI conditions. However, it cannot be tolerated in SI mode,mcat cbdϑg cp, g m exh (ϑpre ϑg) Q gbdtdϑb Q gb Q R Q loss .dt(2)(3)Parameters are TWC mass and specific heat capacity mcat and cb,respectively. ϵcat denotes the volume fraction of the TWC filled withexhaust gas, Vcat the volume of the TWC, cb the specific heat capacityof the solid phase, and mcat the mass of the TWC. Inputs to the modelare exhaust gas mass flow and temperature, ϑpre, ṁexh , respectively.Exhaust gas density and specific heat capacities ρexh, cv, g , and cp, g ,respectively, are calculated as functions of temperature and composition, approximated as described by Heywood (1988, chapter 4). Q̇gb andQ̇loss describe heat transfers between gas-phase and brick as well asbrick and environment, respectively:Fig. 1. Block diagram with inputs and outputs of the close coupled TWC.108Q gb αcat Ageo Vcat (ϑg ϑb)(4)Q loss Acat Ucat (ϑb ϑamb)(5)
Control Engineering Practice 58 (2017) 107–116S. Nüesch, A.G. Stefanopoulouwith αcat and Ucat heat transfer coefficients, Acat the TWC surfacearea, and Ageo [m2 / m3] the specific geometric catalytic surface, definedas Ageo 4 ϵcat ·cpsi0 . 02542in Kiwitz (2012). The heat losses to theenvironment are based on conduction and free convection coefficients, 1 1 1 hconv) .hcond and hconv, respectively, with Ucat (hcondSimilar to Shaw, Fischer, and Hedrick (2002) the model is based onthe overall chemical reactions:NO CO CO 1N2 CO22(6)1O2 CO22Ha Cb (b (7)aa) O2 bCO2 H2 O42Fig. 2. Steady-state experiments and simulation of TWC brick 1 temperature for SI(black) and HCCI (green) combustion, over sweeps of relative AFR from rich to leanconditions. Engine-out exhaust gas temperature (cross), brick temperature measurements and (square) and simulations (circle). The brick temperature is measured at twolocations. (For interpretation of the references to color in this figure, the reader isreferred to the web version of this article.)(8)with HC modeled as 86% propene and 14% methane. This is asimplifying assumption, since the oxidation rates of hydrocarbons,especially methane, vary strongly with composition.The produced heat of the chemical reactions Q̇r then follows asQṙ ̇ , k nprė , k )·ΔHr , k (ϑb), (npostat various AFR conditions and in both combustion modes andcompared to the TWC temperature model results, shown in Fig. 2.Input to the model was the measured engine-out exhaust gas temperature. The brick temperature of the first TWC was measured at twolocations. As can be seen, the model under estimates the temperatureat rich SI conditions. However, at stoichiometric and at lean conditionsin both combustion modes the estimated temperature lies between thetwo measurements and displays acceptable steady-state-accuracy.Additional validation data under dynamic conditions can be found inNüesch (2015), where the model was compared to temperature datafrom chassis dynamometer experiments. When simulating the coldstart of the FTP75 drive cycle, ambient temperature was chosen asinitial condition of the TWC.k {NO, CO, HC}(9)kwith incoming and outgoing molar flow of the species ṅpre, k and ṅpost , k ,respectively, and associated heat of reaction ΔHr . Similar to Shaw et al.(2002) the conversion efficiencies of the three overall reactions as afunction of relative AFR were used to approximate the incoming andoutgoing exhaust gas composition. This results in the following termsfor the reaction enthalpies: 1 Δhr ,1 hNO hCO h N2 hCO2 2 (10)1hO hCO22 2(11)Δhr ,3, a hC3 H6 4.5hO2 (3hCO2 3h H2 O )(12)Δhr ,3, b hCH4 2hO2 (hCO2 2h H2 O ).(13)Δhr ,2 hCO 2.1.3. Oxygen storage depletion constraintsThe variable RTWC is used to describe constraints posed by theTWC. If the OSC is estimated to be full, rich SI operation is demanded.On the other hand, if the catalyst brick temperature ϑb drops below athreshold ϑmin, only stoichiometric SI mode is allowed:Using the TWC's conversion efficiencies, the reaction rates of the threereactions are approximated, resulting in the total heat produced Q̇r :Q r ,1 Δhr ,1·ηNOx ·n NOx, in(14)Q r ,2 Δhr ,2·(ηCO ·n CO, in ηNOx ·n NOx, in )(15)Q r ,3 (0.86·Δhr ,3, a 0.14·Δhr ,3, b )·ηHC ·n HC , in(16)Q r Q r ,1 Q r ,2 Q r ,3.(17) rich SI RTWC stoich. SI HCCI2.2. EngineThe engine considered is a turbocharged 2.0 L I4 multimodeengine. Its model is based on steady-state data for SI and HCCIcombustion of fuel, emissions, and exhaust temperature (Nüesch et al.,2016). The maps for HCCI engine-out NOx and temperature are shownin Fig. 3. Included are two exemplary operating conditions in SIcombustion. As can be seen those SI conditions exhibit significantlyhigher exhaust temperatures and engine-out NOx than the HCCIoperating points nearby. The associated HCCI efficiency maps can befound in Nüesch & Stefanopoulou (2016).The maps of the two combustion modes are connected by the modeswitch model, described in Nüesch et al. (), and implemented withinthe dynamic vehicle simulation as in Nüesch and Stefanopoulou(2015). A methodology presented by Gao et al. (2010) was implemented to capture engine exhaust temperature dynamics during transientsand cold start. A period of approx. 5 min is required to warm up theTable 1TWC temperature model parameters.SymbolTWC 1Specific geometric catalytic surfaceAgeo3.45·10 3 m2/m32.82·10 3 m2/m3TWC volumeVcat1.05·10 3 m3Gas volume fractionCatalyst massSpecific heat capacity of TWCHeat transfer gas - solidϵcatmcatcbαcat1.29·10 3 m30.80.45 kg800 J/kg KOuter surface area of TWCAcat0.0492 m2Heat conductivity of TWC wallhcond0.5 W/m2K(18)As can be seen, the implemented OSC-depletion strategy allowsoperation in HCCI with full OSC and tolerates the associated breakthrough in NOx. Rich SI is only demanded once high lift conditions arereached during the HCCI-SI mode switch. This strategy as well as analternative, in which the OSC is never allowed to be full, are describedin Nüesch et al. (2015).The values for mcat and cb are based on assumptions and examples inliterature while steady-state data was used to determine hcond andαcat. The parameters of the TWC temperature model for both TWCbricks are listed in Table 1. For the enthalpy parameters, general valuesavailable in literature were used. This TWC temperature model is verysimplified. Steady-state temperature measurement data was obtainedName Θ 0.9 and M (1 3, 10 14)ϑb ϑminelse.TWC 20.3 kg140 W/m2K0.0492 m2109
Control Engineering Practice 58 (2017) 107–116S. Nüesch, A.G. StefanopoulouTable 2Finite state mode switch model parameters for SI/HCCI cam switch strategy. Fuelpenalty (FP) is relative to nominal baseline fuel flow in SI or HCCI. Residence times arein seconds or engine cycles. In M 2 the duration is interpolated as a function of currentengine load, with shorter durations at the top and longer durations at the bottom HCCIload limit. λHCCI, NOx, SI , and NOx, HCCI are based on steady-state maps of associatednominal modes at current load/speed condition.FP dMΔtMλMNOx, M(SI)(SI)(HCCI)(HCCI)(HCCI)6%0%14%3%0%0.24–0.42 s1 cyc1 cyc2 cyc3 cyc110.6λHCCI 0.4λHCCIλHCCINOx, SINOx, SINOx, HCCINOx, HCCINOx, HCCI8 (HCCI)9 (HCCI)10 (SI)11 (SI)12 (SI)13 (SI)14 (SI)4%14%68%60%5%16%11%0.25 s1 cyc1 cyc1 cyc0.25 s0.25 s–λHCCI0.5λHCCI 0.50.90.910.90.9NOx, HCCI0.05NOx, SI0.5NOx, SI0.5NOx, SINOx, SI0.5NOx, SI0.63NOx, SIState MSI-HCCIHCCI-SIFig. 3. Steady-state data of the 2.0 L multimode engine in HCCI mode. Top: Engine-outtemperature. Bottom: Engine-out NOx. Dashed line represents center torque in HCCIregime, used in Case Study 2. Black cross: Exemplary SI conditions. See Fig. 2 of Nüesch& Stefanopoulou (2016) for the fuel efficiency.engine at the beginning of the FTP75 drive cycle, during which theengine is unable to switch to HCCI combustion.23456introduced, responsible for rich operation in SI mode. If uri 1 theengine is operated at a rich relative AFR of λ 0.9 , instead of uri 0when a stoichiometric mixture of fuel and air is used.2.2.1. Combustion mode switchThe combustion mode switch model used in Nüesch andStefanopoulou (2016) is extended here with two additional finite statesM (13, 14) to implement depletion of the OSC immediately after theswitch back to SI. The modified state machine is shown in Fig. 4.Besides parameters for fuel penalty dM and residence time ΔtM eachintermediate state M also exhibits relative air-fuel ratio (AFR) λM andengine-out NOx emissions NOx, M . The parameters of the finite-statemodel can be found in Table 2. Fuel penalties, residence times, andAFR are based on closed-loop SI-HCCI and HCCI-SI mode switchexperiments. More on determining the mode switch fuel penalties canbe found in Gorzelic (2015). As a simplification it is assumed that NOxduring the switch is mainly determined by the steady-state map of theassociated combustion mode and that no spikes in NOx occur.The two main control inputs to the combustion mode switch modeluph and usw determine when to phase the valves and when to switchthe cams, respectively. They are described in detail in Nüesch andStefanopoulou (2016). An additional, third control input uri is2.2.2. Mode switch schedul
Dec 14, 2015 · The optimal torque-split between engine and integrated starter-generator (ISG) is based on an equivalent consumption minimization . The longitudinal vehicle model was parameterized for a stock Cadillac CTS 2009 with 6-speed manual transmission and a curb mass . TWC is located unde