Transcription
Capacity Planning at ScaleKapil GoyalFidelity Investmentskapil.goyal@fmr.com02/02/2017
Who am I? Lead for Oracle database performance team at Fidelity Investments Worked with Oracle Consulting and got exposure to many differentcompanies' database performance challenges Speaker at DOUG, Hostos, ECO, Enkitec Expo, IOUG and AIOUG Published articles for DOUG and IOUG SELECT magazine Certified OCP DBA 8i to 11g
Agenda Some industry stats on Cloud Adoption Know your Exadata resource utilization Introduction to OEM Metrics How to extract data from OEM Views Single View across all Exadata Introduction to AWR Warehouse How to stack rank databases Which Oracle databases are right fit for cloud(public/private)
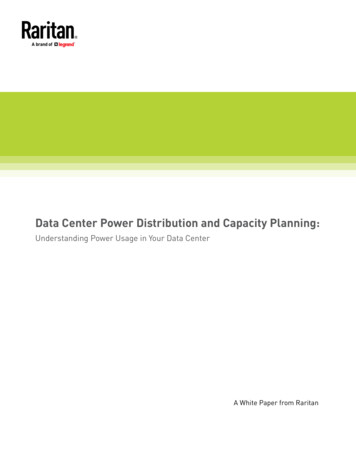
Significant Growth in Hybrid Cloud Adoption
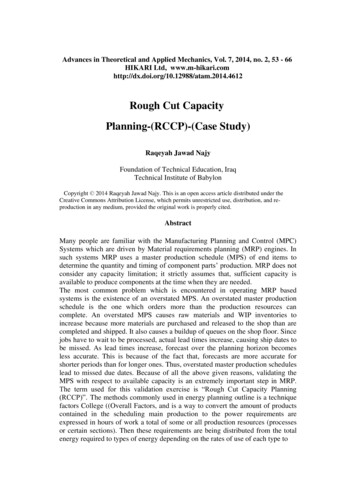
Virtualization adoption trend
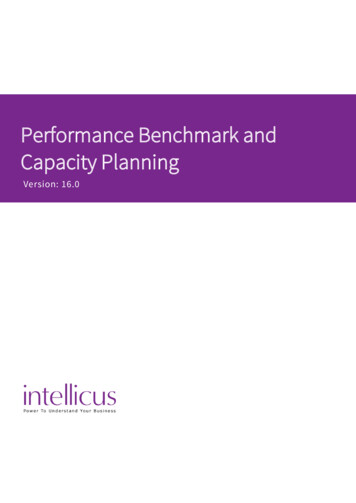
Cloud Adoption SaaS (63%, up one point) remains the most popular type of cloudcomputing in use
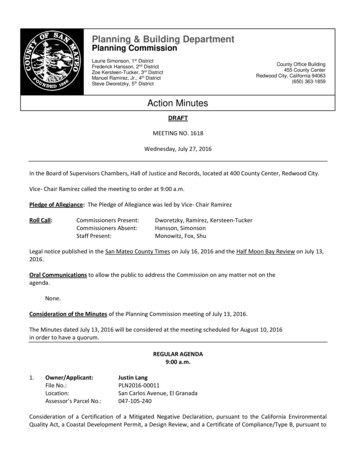
Achieving Business Goals
What is capacity planning?“Capacity Planning is the process of predicting whenfuture load levels will saturate the system anddetermining the most cost- effecting way of delayingsystem saturation as much as possible”- by Daniel A. Menasce and Virgilo A.F. Almeida(Authors of Capacity Planning for Web Services: Metrics, Models & Methods)
Thinking clearly about performance“If you have performance problems, then you don’t needto be spending your time with mathematical models; youneed to be spending your time fixing those problems byeither rescheduling load, eliminating load, orincreasing capacity.”-Cary Millsap (Thinking clearly about performance)
Question How many of you have a dedicated capacity team? Or a performance team? At Fidelity we have a end-to-end capacity/performanceteam Database OS SAN Network
Capacity Planning Exadata Standard Oracle databases
Do you know: Current resource utilization? If you are hitting the HDD IO limit? If you are hitting the FLASH IO limit or not? Compute Node CPU utilization? Cell Node CPU utilization?
Problem Statement Bought x2-2 full rack 6 years ago Need to do hardware refresh, should we upgrade to x5-2full rack or go to Exadata cloud offering?
Common mistakes for Exadata hardware upgrade We have seen proposals to upgrade in same class (e.g.x2-2 half rack - x5-2 half rack or x2-2 Full- x5-2 Full)without looking into current utilization or futureneeds Keep in mind, X5-2 is much more powerful than x2-2
Just compare datasheetsMetricX2-2FullX5-2Rack (HC)Full Rack (HC)Flash bandwidth - GB/sFlash read IOPS681401,500,0004,144,000Flash write IOPSFlash data capacity (raw) TB2,688,0005.3Effective Flash cachecapacity - TB1HC Disk bandwidth - GB/sHC Disk IOPSUp to 672 TB182028,00033,000HC Disk data capacity (raw) TB504HC Disk data capacity(usable) -TB224HC Data load rate - TB/hrDB Compute NodesDB CPU CoresDB Memory - GBDB Memory Expandable - GBStorage Cell NodesCell CPU 224Effective Flash Capacity is larger than the physical flash capacity and takes into account the high flash hit ratios due to Exadata’s intelligent flash caching algorithms, and the size of the underlying diskstorage. It is the size of the data files that can often be stored in Exadata and be accessed at the speed of flash memory1Source ds-2406241.pdf
Try to reduce load At Fidelity, we have implemented hugepages andreduced 8-12% compute node CPU (in lab we reduced 17% for a 2 node RAC) Also in some cases pagetable size grew to 60 GBwithout hugepages and with hugepages under 1 GB *Enabled write back flash cache and reduce HDD diskIOPS Evaluate Exachk recommendations Control parallelism (pxhcdr.sql from Carlos Sierra) Enable IORM* If database is write intensive
Where to find Exadata resource utilization trend? Data is available in EM12c Exadata plugin is required
EM12c Snapshot(1)
Snapshot(2)
Snapshot(3)Max IOPS it can performCurrent utilization
But OEM data gets rolled upEM METRIC VALUESDetailed raw data for 7 daysEM METRIC VALUES HOURLY Aggregated into hourly average for 32 daysEM METRIC VALUES DAILYDaily average of hourly aggregated – 24monthsMost useful but retention is less(highest granularity)Decent usefulsort of meaning less Retention can be changed but it gets changed for all the data collection - DocID 1405036.1 We pull Exadata specific data from gc metric values to our own repository
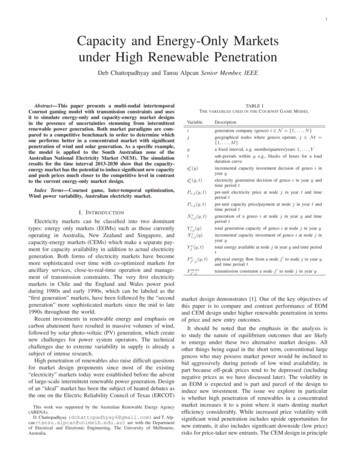
OEM data rolled upDaily average says CPU utilization% 40
Monthly 5 minutes average CPUIn reality everyday 90 % spikeDOUG Computenode CPU Utilization10090CPU Utilization 0DOUG1db0520DOUG1db0610DOUG1db07DOUG1db080Date
Compute Node CPU Utilization-for one day
How to get trend of any OEM Metric?
Host level CPU utilization% raw dataMETRIC DATE CompNode01db01 CompNode01db02 CompNode01db03 CompNode01db0402/05/2015 0:004.34.22.412.802/05/2015 0:054.53.83.610.102/05/2015 0:104.67.63.79.902/05/2015 0:159.97.97.18.202/05/2015 0:205.37.410.52.502/05/2015 0:257.518.14.63.102/05/2015 0:3033.713.16.417.602/05/2015 0:3521.35.318.417.502/05/2015 0:4035.39.712.72It is same data on following OEM Page:Raw Data fromgc metric values, same sourceas OEM chart
How to write SQL to get any metric’s detaileddata?
SQL:selecttrunc(collection time,'hh24') (trunc(to char(collection time,'mi')/5)*5)/24/60 AS METRIC DATE,max(case WHEN entity name 'CompNode01db01.abc.com' then round(value,1) else null end)"CompNode01db01",max(case WHEN entity name 'CompNode01db02.abc.com' then round(value,1) else null end)"CompNode01db02",max(case WHEN entity name 'CompNode01db03.abc.com' then round(value,1) else null end)"CompNode01db03",max(case WHEN entity name 'CompNode01db04.abc.com' then round(value,1) else null end)"CompNode01db04"FROM GC METRIC VALUES awhere metric group name in ('Load' )AND metric column name in('cpuUtil')AND entity type 'host'and ( entity name like 'CompNode01db0%')group by trunc(collection time,'hh24') (trunc(to char(collection time,'mi')/5)*5)/24/60ORDER BY 1Base Script - Kapil Goyal (Fidelity Investments), Greg O’Hearn (Fidelity Investments) and Kalyan Maddali (Oracle)
Query against any metricJust identify metric group name and metric column name
Another Example
Cell Node Statistics HDD IOPS/Throughput Flash IOPS/Throughput HDD/Flash read/write latency CPU Utilization
SQL Script:alter session set nls date format 'mm/dd/yyyy hh24:mi';select--SUBSTR (entity name,1, INSTR(entity name, '.') -1) AS SERVER NAME,trunc(collection time,'hh24') (trunc(to char(collection time,'mi')/15)*15)/24/60 AS METRIC DATE,--metric group name,--entity name,sum(case WHEN metric column name 'sum cd read iops'and key part 1 'HardDisk' then ROUND (value, 1) else nu ll end)sum(case WHEN metric column name 'sum cd write iops'and key part 1 'HardDisk' then ROUND (value, 1) else nu ll end)sum(case WHEN metric column name 'sum cd read throughput'and key part 1 'HardDisk' then ROUND (value, 1) else nu ll end)sum(case WHEN metric column name 'sum cd write throughput'and key part 1 'HardDisk' then ROUND (value, 1) else nu ll end)sum(case WHEN metric column name 'sum cd io load'and key part 1 'HardDisk' then ROUND (value,1) else nul l end)round(avg(case WHEN metric column name 'avg cd read latency'and key part 1 'HardDisk' then ROUND (value,1) else nul l end),1)round(avg(case WHEN metric column name 'avg cd write latency'and key part 1 'HardDisk' then ROUND (value,1) else nul l end),1)sum(case WHEN metric column name 'sum cd read iops'and key part 1 'FlashDisk' then ROUND (value, 1) else n ull end)sum(case WHEN metric column name 'sum cd write iops'and key part 1 'FlashDisk' then ROUND (value, 1) else n ull end)sum(case WHEN metric column name 'sum cd read throughput'and key part 1 'FlashDisk' then ROUND (value, 1) else n ull end)sum(case WHEN metric column name 'sum cd write throughput'and key part 1 'FlashDisk' then ROUND (value, 1) else n ull end)sum(case WHEN metric column name 'sum cd io load'and key part 1 'FlashDisk' then ROUND (value,1) else nu ll end)round(avg(case WHEN metric column name 'avg cd read latency'and key part 1 'FlashDisk' then ROUND (value,1) else nu ll end),1)round(avg(case WHEN metric column name 'avg cd write latency'and key part 1 'FlashDisk' then ROUND (value,1) else nu ll end),1)round(avg(case WHEN metric column name 'cpu utilization'then ROUND (value,1) else nu ll end),1)FROM sysman.gc metric VALUES-- Change it to METRIC VALUE while connecting to Perf Team Repositorywhere metric group name in( 'Aggregated HardNFlashDisk Metric','Cell Metric' )AND metric column name in('sum cd read iops','sum cd write iops','sum cd read throughput','sum cd write throughput','sum cd io load','avg cd read latency','avg cd write latency','cpu utilization')AND entity type 'oracle exadata'and ( entity name like ‘DOUGcel0%')group by trunc(collection time,'hh24') (trunc(to char(collection time,'mi')/15)*15)/24/60ORDER BY 1,2Base Script - Kapil Goyal (Fidelity Investments), Greg O’Hearn (Fidelity Investments) and Kalyan Maddali (Oracle)"hd avg rd iops","hd avg wrt iops","hd avg rd throughput","hd avg wrt throughput","hd avg io load","hd avg rd latency","hd avg wrt latency","fl avg rd iops","fl avg wrt iops","fl avg rd throughput","fl avg wrt throughput","fl avg io load","fl avg rd latency","fl avg wrt latency","avg cpu utl(%)"
In OEM, look for group label and column label then map with gc metric column’sgroup name and column namemetric column labelmetric group label
Why Cell Statistics are important? If you enable/change IORM, enable/disablewrite back flash cache etc. you want to how it isimpacting IO is not distributed properly across all cells(very unlikely) Workload is not distributed across differentracks/expansions
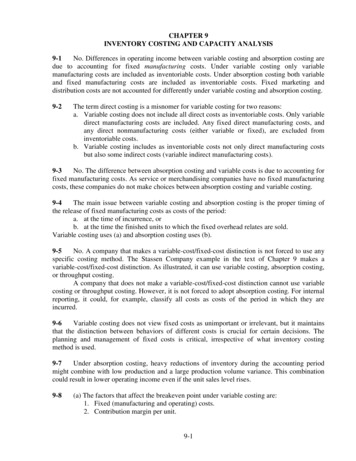
Example(1) – HDD IOPS reduction after enabling writeback flash cache
Write path from Database perspective Log writes- (LGWR)Upon every transaction “commit” Latency is #1 priority Exadata cell behavior: Flash logging Write to DISK and Flash . Ack on firstcompletion Direct path writes -- (Oracle Shadow and PQ) Bandwidth is typically #1 priority Typically LARGE IO sizes Exadata cell behavior: cell flash cache determines the path Flushing the Buffer Cache – (DBWR)Clean dirty buffers in SGA IOPS bandwidth is keyExadata cell behavior Writes to FlashWrite to Disk - 128kKeep - writes to FLASHDefault - writes to DISK TEMP writes - spills out of PGASort, Hash Join, etc. Exadata cell behavior Writes go to DISK
Write path from Database perspective cont Archive Log writes -- (ARCH) FLASHBACK database – (RVWR) – After REDO logs are switched, they – Uses it’s own format, but volume is are written to the “RECO” space bysimilar to “redo” writes Typically written to RECO Exadata cell behavior: ARCH These are “LARGE” writes Exadata cell behavior: Write to DISK only Write to DISK only
Example(2) –abnormal HDD IOPS across Full/Half/Expansion
Sample Charts of Exadata Review-snapshot(1) Current – x2-2 HalfRack HP Utilization Proposed Exadatax4-2 qtr Rack HC
Snapshot(2)
Snapshot(3)
Snapshot(4)
Snapshot(5)
Snapshot(6)
Snapshot(7)
Single View across all Exadata60 days 98th percentile data
Single View across all Exadata
Detail level compute node CPU Utilization
Detail level HDD data
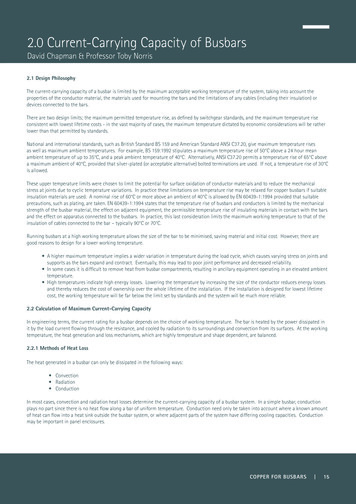
Detail level Flash DataMetricX4-2 Half Rack (HC)Flash bandwidth - GB/s50Flash read IOPS1,330,000Flash write IOPS980,000Flash data capacity (raw) - TBEffective Flash cache capacity - TB22.41HC Disk bandwidth - GB/sHC Disk IOPSupto 224 TB1016,000HC Disk data capacity (raw) -TB336HC Disk data capacity (usable) -TB150HC Data load rate - TB/hrDB Compute NodesDB CPU Cores10496DB Memory - GB1024DB Memory Exandable - GBStorage Cell Nodes2048Cell CPU Cores784
Stack rank your databasesDatabaseHigh EndPhysical80%virtualHigh rod11.5M100 1ms128100TBORAprod21.4M47 1ms12875TBDB2prod31.3M46 test.SQLdev3000 1001 10ms220GB
AWR Warehouse Centralized warehouse for long term AWR data retention All AWR features available on long term AWR data Seamless integration with OEM Comparative Analysis of workload, no impact on target database Performance Analysis of DBs on Shared Infrastructure
Data Warehouse
Enterprise wide 95th, 98th and 99th database level stats
Sr. Management level viewOfferingIOPSThroughput(MB)Latency (ms)DB Size (GB)Max # of Cores/CPUsPublic Cloud30005030 504Private Cloud500010020 1008High end VM? 600014Physical AFAAny 5000 2AnyAnyAppliance
Capacity analysis at DB level A big thanks to Carlos and Mauro for great help in google chartsMauro’s SQLD360 Code Tanel’s script
Database Profile
Wait event – Direct path read temp
IOPS/Throughput
# of CPU/core used
Single block read latency
Storage Index Savings
Smart Scan Savings
Next Session
OEM Plugin Reference manual
Appendix - ADb capacity.sql will generate a .html file.DEF conf days 7Report will run SYSDATE-conf days, running it forlonger period may take some time.DEF conf day ptile 7This is to call capacity.sql for 95th, 98th and 99th Ptilecalculation
References: ing clearly about performance Maintaining and Troubleshooting the Management Repository https://docs.oracle.com/cd/E24628 01/em.121/e25160/oracle exadata.htm#CIACDFFIEnterprise Manager Framework, Host, and Services Metric Reference Manual- Host http://docs.oracle.com/cd/E24628 ise Manager Oracle Database Plug-in Metric Reference Manual 06 01/em.102/b16230/host.htmOracle Enterprise Manager Oracle Database and Database-Related Metric Reference um-ioug-em12c-capacity-planning-with-oemmetrics12c Cloud Control Repository: How to Modify the Default Retention and Purging Policies for MetricData? (Doc ID 1405036.1)
Feb 02, 2017 · What is capacity planning? “CapacityPlanning is the process of predicting when future load levels will saturate the system and determining the most cost- effecting way of delaying system saturation as much as possible” - by Daniel A. Menasce and Virgilo A.F. Almeida (Authors of Capacity Planning