Transcription
1Data Center Power Distribution and Capacity Planning:Understanding Power Usage in Your Data CenterA White Paper from Raritan
Data Center Power Distribution and Capacity Planning: Understanding Power Usage in Your Data CenterAbout This SeriesRaritan, a leading provider of data center equipment,and PTS, a well-respected data center consulting firmand turnkey solutions provider, recently conducted aseries of tests to examine the effects of heat, airflowand power usage in a working server environment.The hypothesis was that by knowing more abouttheir real-time operational environment, data centermanagers would be empowered to manage smarter.Using advanced 3-D computational fluid dynamic(CFD) software and intelligent power distribution units(iPDUs), among other devices, Raritan and PTS wereable to monitor temperature and humidity, calculateairflow, as well as measure power for both the IT andsupporting infrastructure load throughout Raritan’sand PTS’ server rooms. This series of white papersdocuments their research and provides you with thekey learnings of their tests.OverviewWith the cost of power rising dramatically andincreased uncertainty of global power availability, alllevels of corporate management are now more focusedthan ever on managing and conserving energy.Nowhere is this more critical than in the data centerof the corporation, which can consume 25 percent ofthe total energy in a typical IT intensive organization(Raritan estimate based on U.S. EnvironmentalProtection Agency “Report to Congress on Server andData Center Energy Efficiency Public Law 109-431”).Due to increased reliance on computing to delivermission-critical applications and the emergence ofblade technology and virtualization, server density isdramatically increasing.These increases mean that data centers are runninghotter and HVAC systems are working overtime to keepthe center cool. This, in turn, is driving energy costs up— a growing concern for IT, given the potential for thisexpense to become an above-the-line IT charge.Clearly, there’s a need to monitor data center powerand temperatures — and adjust heating, coolingand airflow — to minimize power consumption whilemaintaining IT equipment uptime. But where shouldforward-thinking corporations start? What tools areavailable to get the data needed to design a moreefficient data center?This white paper, the first in a series, takes a lookat some of these thorny energy management issuesand provides some relevant answers. You’ll learn thefollowing three things: The flaws in what you thought you knew about powermeasurement What kind of measurement instrumentation you needto calculate your data center’s power efficiency How to set standards that bring your data center inalignment with Green Grid2
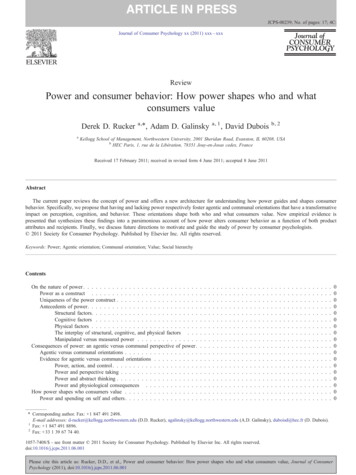
Data Center Power Distribution and Capacity Planning: Understanding Power Usage in Your Data CenterThe ChallengeWhen energy management was a low priority, ITmanagers could rely on simple calculations associatedwith nameplate specifications to predict overall powerusage in their data centers.However, average data center power consumption hasgrown from 2.1 kilowatts per rack in 1992 to 14 kw/rackin 2006, according to HP (“HP Power & Cooling,” August31, 2006). Simply multiplying the number of servers bytheir nameplate ratings does not jibe with the reality ofactual energy consumption statistics. DatacenterDynamics, in their Spring 2007 Conference Survey, found thatthe average power density among all respondents in theU.S. was 5.5 kw/rack and the average maximum powerdensity was 11.6 kw/rack.Moreover, many industry analysts such as Gartner (“25thAnnual Data Center Conference,” December 2006) havebeen predicting significant power shortfalls for morethan a year now. While some companies have flexibilityto move their data centers to locations that provide morereliable, less expensive power, most simply cannot.Which means that shortfalls, left unresolved, could forceIT and facilities managers to make hard decisions aboutwhich applications to support and which ones to sacrificeto keep the business running during peak demand.As energy issues come under more scrutiny and astools become available for accurate measurement, ITadministrators and facilities managers should no longerrely on the published nameplate power ratings on theirunits and factor in accepted industry assumptions.While adequate in the past, “close enough” isn’t “goodenough,” given the potential power crisis that’s just overthe horizon.Only through individual server measurement canmanagers accurately know what power their equipmentis drawing and acquire precise numbers that will aidtheir energy efficiency planning efforts.With the knowledge gained regarding server-by-serverreal-time monitoring, IT administrators can managesmarter and feel secure that they are making betterdecisions on what to power off because they will be ableto: Identify non-working processing assetsIdentify low-efficiency processing assets (e.g., lots ofpower draw for little computational power) Assist capacity planning against the design ratingfor all power protection, distribution and coolinginfrastructure equipmentNameplate Ratings and AssumptionsServer manufacturers indicate a power rating value onthe nameplate of every server. Data center administrators, however, know that this represents a worst-casescenario, and typical server power consumptionnever reaches the rated nameplate value. One easyway to increase server density is to simply derate thenameplate power by a certain percentage — dependingon the workload that’s deployed on the server.PTS refers to this derated value as the design ratingof the equipment. It is typically 50–75 percent ofthe nameplate rating, and is used to size all powerprotection, distribution and cooling systems in the datacenter. This percentage is still frequently higher thanwhat is seen in actual use, but now more accurate,real-world numbers can be obtained through the useof intelligent PDUs.For example, by measuring power consumption ofindividual servers using intelligent PDUs, PTS’ analysisof Raritan’s IT equipment determined that consumption typically ranged from 20–85 percent of theunderlying equipments’ nameplate rating, averagingabout 31 percent – far less than the numbers typically3
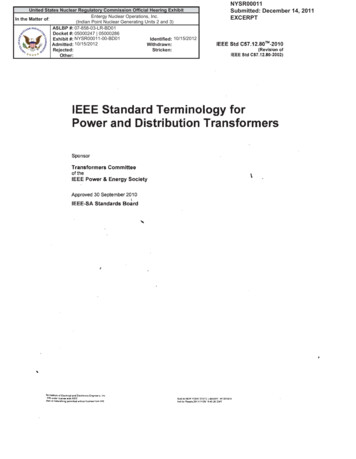
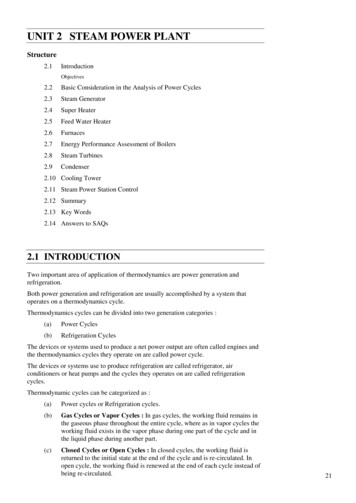
Data Center Power Distribution and Capacity Planning: Understanding Power Usage in Your Data CenterIT Equipment Power Load vs. Total Facility Power Loadused as the design rating of the equipment.Another important measurement to get a handle onis the power drawn by IT equipment in relation tothe total power consumed by the facility. APC-MGEestimates that 30 percent of total power usage in adata center represents the load placed on power gridsby servers and other IT equipment, while 70 percentis for everything else — cooling, air movement, powerdistribution, lighting, etc. EYP Mission Critical Facilities, a division of HP, puts these numbers at 50 percentand 50 percent.A preliminary observation by PTS and Raritan, however,found that 71 percent of the energy consumed was forthe critical IT load, with only 29 percent spent for thesupport systems. This high percent of power going tothe critical IT load is an indication that PTS and Raritanare doing a better job managing power in their datacenters than is typical in the industry. It also points toan opportunity to press loading factors doing morecomputing with less energy.These numbers illustrate the importance of gettingaccurate measurements in your data center ratherthan relying on “industry averages.”Measurement SystemsSo how can you arrive at these measurements, efficiently and accurately? The following are some overall piecesof the puzzle to consider:Branch Circuit Monitors and IndividualDevice Load MeasurementBranch circuit monitors are electrical devices thatmeasure current load on all circuits on an electricalpanel and alert operators when the load approachesthe breaker’s rating. This is especially important indata centers, for example, where additional serverscan get plugged into a circuit that’s already approaching its capacity. Branch circuit monitors continuouslymeasure the current on all circuits and ensure thatsomeone is notified before a circuit breaker reaches itsrated capacity, or worse, tripsData Center Environmental AggregatorsEnvironmental aggregators are specifically designed togather relevant power and environmental data centerinformation. They can also consolidate the collectedinformation and analyze it to help you make informeddecisions related to power consumption by both IT andfacilities equipment.Intelligent PDUsIntelligent rack PDUs provide IT staff the ability tomonitor the power consumption of any given server,storage unit or other IT device, which is helpful toidentify those that are underutilized or identify thosethat are approaching or exceeding their normal highrange of usage. There is also the ability to monitor andcontrol the data center power load at the facility level.Intelligent rack PDUs can be controlled remotely via aWeb browser or command line interface (CLI). They canmeter power at both the PDU level and the individualoutlet level; support alerts based on user-definedthresholds; provide security in the form of passwords,authentication, authorization and encryption and incorporate rich environmental management capabilities.Some models are also highly customizable, support theindustry’s latest standards-based techniques like SNMPTRAPs/SETs/GETs, IPMI, SMASH CLP and integrateseamlessly to existing corporate infrastructures likeLDAP, Active Directory , RADIUS and NFS servers.Still, these tools cannot reach their full potential if themodeling is based on just a static environment. In thereal world, data centers are dynamic. Server utilizationchanges over time, which causes power consumptionand heat generation/dissipation to change. This, inturn, requires appropriate cooling to specific racks orrows of computers.So the next step is to determine your data center’spower usage effectiveness rating.4
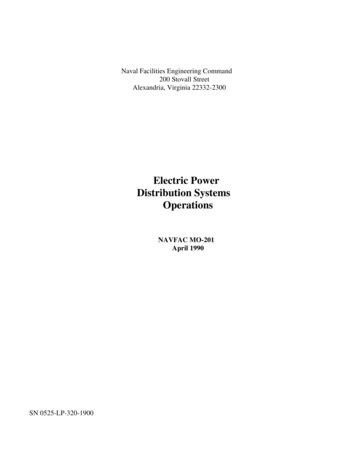
Data Center Power Distribution and Capacity Planning: Understanding Power Usage in Your Data Center5The Green Grid: Calculating PUEThe Green Grid defines Power Usage Effectiveness(PUE) with this formula:PUE Total Facility PowerIT Equipment Power“Total facility power” in this equation is the powerrequired to operate the entire data center, includingservers, IT equipment, lighting, cooling, air movement,etc. “IT equipment power” represents the powerrequired to operate the servers and IT equipmentalone.PUE can range from 1.0 to infinity. A PUE valueapproaching 1.0 would indicate 100 percent efficiency(i.e., all the power is used by IT equipment only).Currently, there are no comprehensive data sets thatshow the true spread of the PUE for data centers.Some preliminary work by PTS indicates that manydata centers may have a PUE of 3.0 or greater, but withproper design a PUE value of 1.6 should be achievable.Tools to Calculate PUEYou must accurately measure power usage whencalculating your PUE to establish a baseline andto measure your improvements. Raritan and PTSdesigned and implemented the following measurementstrategy to accomplish this:Average/NameplateMaximum/NameplateA Veris H8820 data acquisition device was deployedto measure branch circuit amperage for each load,and calculated power feeding the computer room airconditioning (CRAC) units, lighting, UPS and othernon-IT loads. This unit was selected since it was easyto deploy and provided the data required.Geist Racsense environmental monitors were deployedwith temperature probes at the top and bottom ofeach rack (front and back), as well as the supply andreturn of each CRAC unit. One humidity probe was alsodeployed to measure the humidity of the room. TheRacsense devices provided efficient installation andcabling and simple data collection.Two Dominion PX intelligent power distribution unitswere deployed in each rack. This enabled capture of theactive power of the critical IT loads at a per device level.This detailed critical IT load data provides the granularity of information required to measure the PUE andmake recommendations on how to improve it.Variability in server power consumption relative to nameplate rating
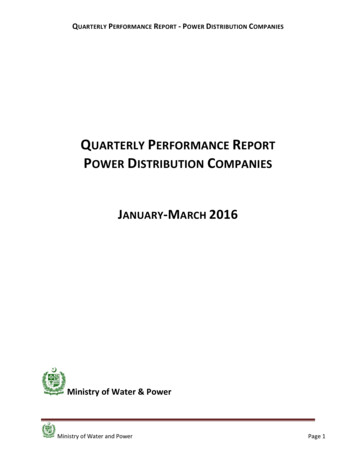
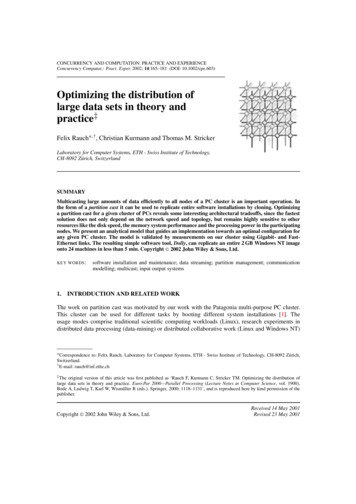
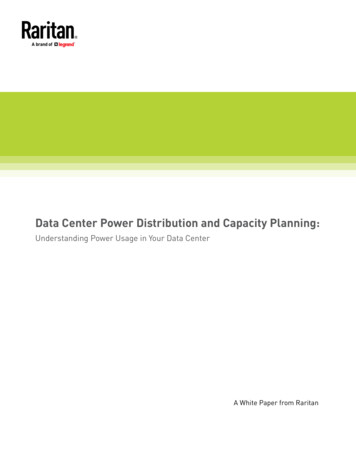
Data Center Power Distribution and Capacity Planning: Understanding Power Usage in Your Data Center6The ResultsNameplate Vs. Actual Power DrawCalculating Raritan’s PUEThe histogram to the right shows the frequencydistribution of actual power consumed as a percentageof the nameplate values (capacity), based on readingsin the Raritan data center taken from February 21through February 26, 2008. The nameplate valueindicates the maximum amount of power a device canuse at any given time under any kind of workload anddata center environmental condition.As the chart to the right shows, approximately 71percent of the total average power consumption wasused for Raritan’s critical IT equipment — 49.4 percentfor servers alone — while the remaining 29 percentwas for support services like cooling and lighting.To calculate Raritan’s PUE based on the previousformula:Current data center design rules use the nameplatevalue to perform capacity planning. Using this methodfor data center design leads to inefficiency due toovercapacity since the nameplate value is a maximumvalue. Derating this value by a fixed percentagereduces some of the inefficiency, but our chart belowindicates that actual power consumed in operationshas such a wide range that it makes it difficult to selecta derating factor that balances efficiency and ensuresreliable operation.For example, measuring average active power, 29devices in Raritan’s server room consumed between21%–40% of this capacity, while 15 consumed a higherpercentage of capacity and 15 devices consumeda lower percentage of capacity. While measuringmaximum power, 27 devices in our server roomconsumed between 21%–40% of this capacity, while23 consumed a higher percentage of capacity and 9devices c
scenario, and typical server power consumption never reaches the rated nameplate value. One easy way to increase server density is to simply derate the nameplate power by a certain percentage — depending on the workload that’s deployed on the server. PTS refers to this derated value as the design rating of the equipment. It is typically 50–75 percent of