Transcription
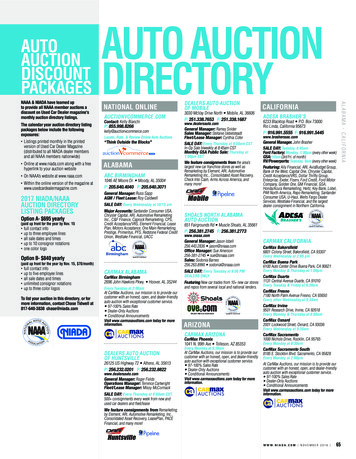
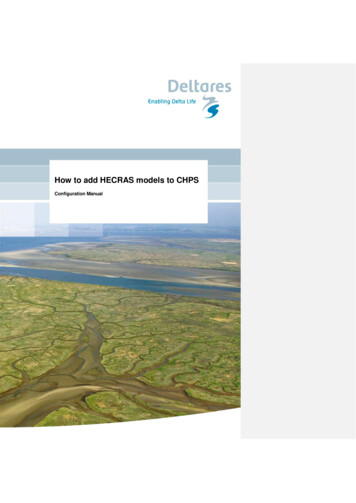
NCLC NATIONALCONSUMERLAWCENTERauto add-ons add up HOW DEALER DISCRETION DRIVES EXCESSIVE,ARBITRARY, AND DISCRIMINATORY PRICING Copyright 2017, National Consumer Law Center, Inc.CHARTS AND GRAPHICSCHART 1Total Number of Originations by Loan TypeMillions30Student Loans*Total First MortgageAuto 2015 National Consumer Law Center, 2017Sources: Federal Reserve Bank of New York Consumer Credit Panel 15:Q4; Equifax U.S. Consumer Trends,February 11, 2016; Federal Reserve Bank of New York, Student Loan Borrowing and Repayment Trends, 2015(student loan data through 2014).* The student loan data represents the number of borrowers originating student loans during a given year,rather than the number of loans originated. 2017 National Consumer Law Centerwww.nclc.orgAuto Add-Ons Add Up: Charts and Graphics 1
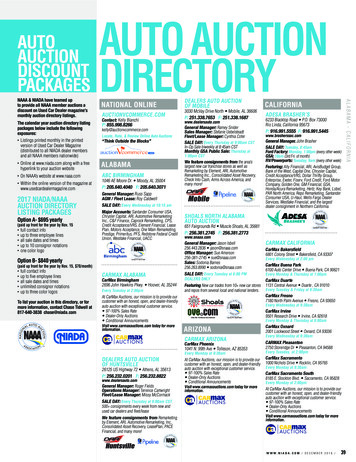
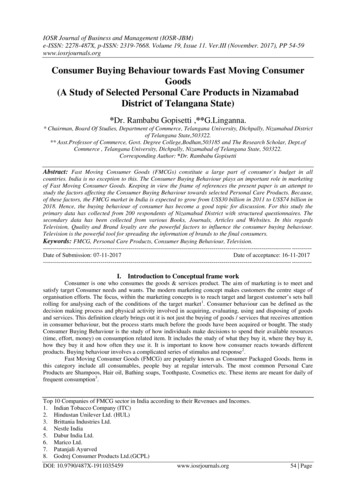
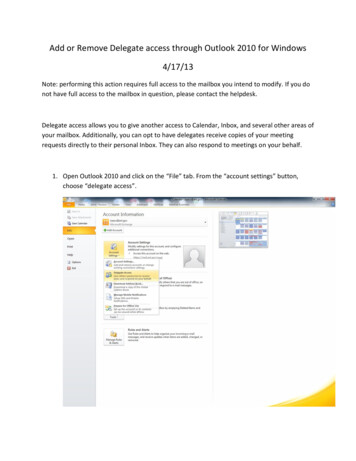
33 26 159743CHART 2Add-on Products Sold by CategoryTire64,557OtherDent 7,388Warranty279,071GAP462,170 National Consumer Law Center, 2017Source: National data set of one provider’s add-on products sold in the U.S., September 2009–June 2015.2 Auto Add-Ons Add Up: Charts and Graphics 2017 National Consumer Law Centerwww.nclc.org
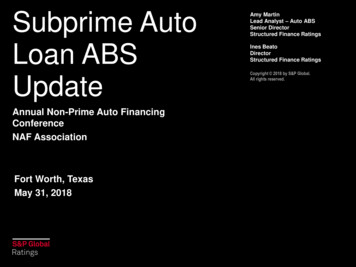
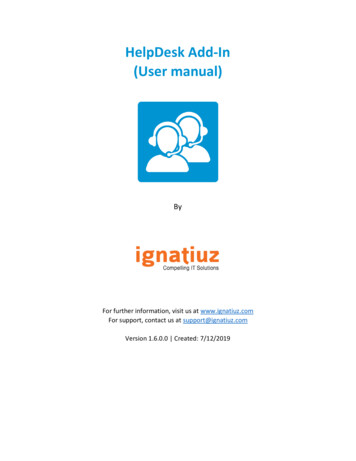
CHART 3StateAverage Dealer Cost and Markup by State: Service VAverageDealer CostAverageMarkup 0 500 1,000 1,500 2,000 2,500 3,000 National Consumer Law Center, 2017Source: National data set of one provider’s add-on products sold in the U.S., 2012.Note: Only shows states with 100 or more records. 2017 National Consumer Law Centerwww.nclc.orgAuto Add-Ons Add Up: Charts and Graphics 3
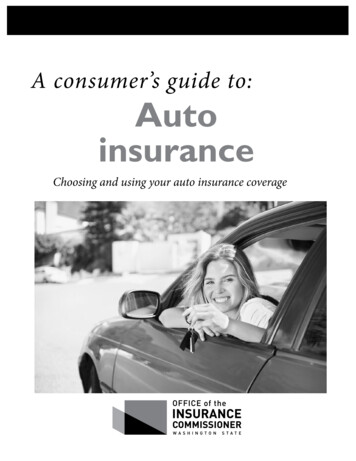
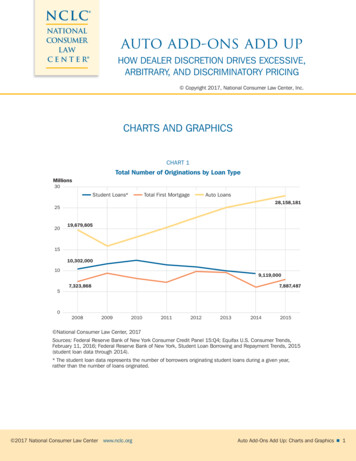
CHART 4Average Dealer Cost and Average Markup: Guaranteed Asset Protection (GAP)StateALAverageDealer CostAZCAAverageMarkup OHOKPARISCSDTNTXVAVTWAWIWV0 200 400 600 800 1,000 1,200 National Consumer Law Center, 2017Source: National data set of one provider’s add-on products sold in the U.S., 2012.Note: Only shows states with 100 or more records.4 Auto Add-Ons Add Up: Charts and Graphics 2017 National Consumer Law Centerwww.nclc.org
CHART 5StateAverage Dealer Cost and Average Markup: Window Etching (Etch)AZCACOCTAverageDealer CostFLGAILAverageMarkup INKYLAMAMIMOMSNCNJOHPATNTXVA0 50 100 150 200 250 300 350 400 450 500 National Consumer Law Center, 2017Source: National data set of one provider’s add-on products sold in the U.S., 2012.Note: Only shows states with 100 or more records. 2017 National Consumer Law Centerwww.nclc.orgAuto Add-Ons Add Up: Charts and Graphics 5
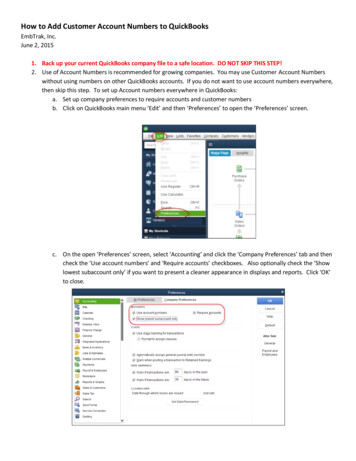
CHART 6What One Dealer in Michigan Charged Different Customers for Etch, May 2013(Dealer’s Cost 50 for Each Etch Product)Customer Charge 5,500 5,000 5,000 4,500 4,000 4,000 3,500 3,000 2,500 2,500 2,495 2,780 2,639 2,305 2,000 2,100 2,000 1,900 1,500 1,200 1,000 5000 600 900 795 587 550 495 450May 4 1,000 395May 9 1,000 1,030 995 945 700 800 500 395May 14 995 545May 19 349 495 500May 24 395 500May 28Date of Sale National Consumer Law Center, 2017Source: National data set of one provider’s add-on products sold in the U.S., May 2013.6 Auto Add-Ons Add Up: Charts and Graphics 2017 National Consumer Law Centerwww.nclc.org
CHART 7Dealer Pricing for Service Contractswith a Trend Towards a Constant 1,500 MarkupCustomer Charge 4,000 3,500 3,000 2,500DealeorCst sCutomehrCarge 2,000 1,500 1,000 50000 500 1,000 1,500 2,000 2,500 3,000 3,500 4,000Dealer Cost National Consumer Law Center, 2017Source: National data set of one provider’s add-on products sold in the U.S., 2011. 2017 National Consumer Law Centerwww.nclc.orgAuto Add-Ons Add Up: Charts and Graphics 7
CHART 8Dealer Pricing for Service Contractswith a Trend Towards Pricing at 1,999, 2,495 and 2,999Customer Charge 4,500 4,000 3,500 3,000aDelerCtos CtusomehrCarge 2,500 2,000 1,500 1,000 50000 500 1,000 1,500 2,000 2,500 3,000 3,500 4,000 4,500Dealer Cost National Consumer Law Center, 2017Source: National data set of one provider’s add-on products sold in the U.S., 2011.8 Auto Add-Ons Add Up: Charts and Graphics 2017 National Consumer Law Centerwww.nclc.org
CHART 9Dealer Pricing for Service Contractswith a Trend to Use Either a Fixed Price or a Fixed MarkupCustomer Charge 5,000 4,500 4,000 3,500 3,000DealeorCst sCutomehrCarge 2,500 2,000 1,500 1,000 50000 500 1,000 1,500 2,000 2,500 3,000 3,500 4,000 4,500Dealer Cost National Consumer Law Center, 2017Source: National data set of one provider’s add-on products sold in the U.S., 2011. 2017 National Consumer Law Centerwww.nclc.orgAuto Add-Ons Add Up: Charts and Graphics 9
CHART 10Comparison of Two Dealers’ Pricing for Service ContractsCustomer Charge 4,500 4,000 3,500 3,000 2,500DealCerost CustomCerharge 2,000 1,500 1,000 50000 500 1,000 1,500 2,000 2,500 3,000 3,500 4,000Dealer Cost National Consumer Law Center, 2017Source: National data set of one provider’s add-on products sold in the U.S., 2011.10 Auto Add-Ons Add Up: Charts and Graphics 2017 National Consumer Law Centerwww.nclc.org
CHART 11Average Service Contract Markup for Hispanicsand Non-Hispanics in DollarsAverage Markup 1,300Hispanic 1,200Non-Hispanic 1,100 1,000 900 800 700 600 500 400 300 200 1000MAVANYFLKYMNNJCTMONEAZCAOKTXState National Consumer Law Center, 2017Source: National data set of one provider’s add-on products sold in the U.S., 2011. 2017 National Consumer Law Centerwww.nclc.orgAuto Add-Ons Add Up: Charts and Graphics 11
CHART 12Average Service Contract Markup for Hispanicsand Non-Hispanics by PercentageAverage MONJCACTAZOKTXState National Consumer Law Center, 2017Source: National data set of one provider’s add-on products sold in the U.S., 2011.12 Auto Add-Ons Add Up: Charts and Graphics 2017 National Consumer Law Centerwww.nclc.org
CHART 13Service Contracts: Average Hispanic and Non-Hispanic Markup by Statein Dollars and Percentages Where Dealer Cost is 910 to 1,010Average Markup 1,200 1,000 800 600 ate National Consumer Law Center, 2017Source: National data set of one provider’s add-on products sold in the U.S., 2011. 2017 National Consumer Law Centerwww.nclc.orgAuto Add-Ons Add Up: Charts and Graphics 13
CHART 14Hispanic and Non-Hispanic Markups for Service Contractsby Six California Dealers in DollarsAverage Markup 1,300 1,200HispanicNon-Hispanic 1,100 1,000 900 800 700 600 500Dealer ADealer BDealer CDealer DDealer EDealer FCalifornia Dealer National Consumer Law Center, 2017Source: National data set of one provider’s add-on products sold in the U.S., 201114 Auto Add-Ons Add Up: Charts and Graphics 2017 National Consumer Law Centerwww.nclc.org
CHART 15Hispanic and Non-Hispanic Markups for Service Contractsby Six California Dealers by PercentageAverage 220%200%180%160%140%120%100%80%60%40%20%0Dealer ADealer BDealer CDealer DDealer EDealer FCalifornia Dealer National Consumer Law Center, 2017Source: National data set of one provider’s add-on products sold in the U.S., 2011. 2017 National Consumer Law Centerwww.nclc.orgAuto Add-Ons Add Up: Charts and Graphics 15
CHART 16Ohio: Creditors’ Market Share Where Guaranteed Asset Protection (GAP)Insurance Was Sold*Wells FargoHuntingtonNational BankKembaC.U.G.E. CreditUnionSantanderAuto FinanceBank ofAmericaColumbusMetro C.U.Auto LoanInc.AllyJ P MorganChaseFirst ThirdBankAmericreditFord MotorCreditHundai MotorFinanceFirst MeritBankCapital OneAuto FinanceWright PattCredit Union*Companies with the largest market share are identified. National Consumer Law Center, 2017Source: National data set of one provider’s add-on products sold in the U.S. 2007–2013, and title informationobtained from Ohio county title offices and made available by the Ohio Department of Public Safety and theBureau of Motor Vehicles.16 Auto Add-Ons Add Up: Charts and Graphics 2017 National Consumer Law Centerwww.nclc.org
CHART 17Ohio: Creditors’ Market Share Where Customer Paid More Than 900for Guaranteed Asset Protection (GAP) Insurance*Fifth Third BankCapital OneAuto FinanceAllyRiver ValleyCURegionalAcceptanceAuto Loan Inc.HuntingtonNational*Companies with the largest market share are identified. National Consumer Law Center, 2017Source: National data set of one provider’s add-on products sold in the U.S. 2007–2013, and title informationobtained from Ohio county title offices and made available by the Ohio Department of Public Safety and theBureau of Motor Vehicles. 2017 National Consumer Law Centerwww.nclc.orgAuto Add-Ons Add Up: Charts and Graphics 17
CHART 18Ohio: Creditors’ Market Share Where Dealer Cost of Guaranteed AssetProtection (GAP) Insurance Was 150– 250*J P MorganChaseSantanderColumbusMetroFederalFifth ThirdBankBank ofAmericaWells FargoAllyCapital OneFord MotorCreditG.E. CreditUnionKia MotorFinanceHuntingtonNational BankHundai MotorFinanceWright PattCredit Union*Companies with the largest market share are identified. National Consumer Law Center, 2017Source: National data set of one provider’s add-on products sold in the U.S., 2007–2013, and title informationobtained from Ohio county title offices and made available by the Ohio Department of Public Safety and theBureau of Motor Vehicles.18 Auto Add-Ons Add Up: Charts and Graphics 2017 National Consumer Law Centerwww.nclc.org
CHART 19Ohio: Creditors’ Market Share Where Dealer Cost of Guaranteed Asset Protection(GAP) Insurance Was 150– 250 and Customer Price Exceeded l OneRiver ValleyCredit UnionSantanderFifth ThirdBankUS Bank National Consumer Law Center, 2017Source: National data set of one provider’s add-on products sold in the U.S., 2007–2013, and title informationobtained from Ohio county title offices and made available by the Ohio Department of Public Safety and theBureau of Motor Vehicles. 2017 National Consumer Law Centerwww.nclc.orgAuto Add-Ons Add Up: Charts and Graphics 19
GRAPHIC 1Sample Advertisement for DealersStrength.Security.Results.It’s who we are. #1 volume F&I product provider. Over 200 exceptional agent partnersdelivering value in all 50 states—the absolute best in incomedevelopment. 26 customized OEM private-labelprograms, more than all otherproviders combined—theundisputed leader. 600 million in claims paid. 5 billion in profits for our clients. 15 million consumers protectedworldwide.Safe-Guard is committed to providingexceptional service and profit-drivenresults. Experience for yourself whySafe-Guard is the industry’s leadingF&I provider.Note: The red circle has been added to the advertisement for emphasis.20 Auto Add-Ons Add Up: Charts and Graphics 2017 National Consumer Law Centerwww.nclc.org
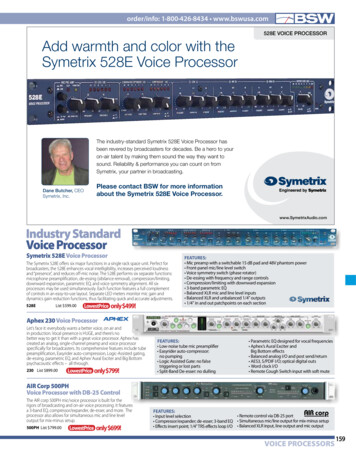
GRAPHIC 2Dealers and Window Etching Pricingfour dealers, four different pricing patternsWhile some dealers with lots of sales of window etching (Etch) charge everyone the same price, it is not typical.In 2012, there were 105 dealers in NCLC’s data set that sold Etch products that had just one dealer cost forevery Etch product they sold. Only 19 of those 105 dealers sold the Etch product to each of their customersfor the same price. 82% of dealers did not have a single fixed price for their Etch products, but establisheda different price depending on the customer. These extreme pricing inconsistencies cannot be explained bydifferent costs to the dealer, different products being sold, or different time periods. 189Dealer 1 (CT)One of the top twenty-five dealers by Etch volume in 2012 soldover 1,000 Etch products. For each Etch product, the dealer’s costwas 16 and the dealer charged the customer 189, for a markupof 173, or 1,081%. This dealer had a large markup, but chargedall customers the same amount for the Etch product.Dealer’s cost 16 199Dealer 2 (TN) 249This dealer’s cost for all the Etch products was 37. The dealercharged all customers 199 or 249, except for one sale at 1and another at 219. The Etch products sold were the same andthe dealer cost was the same. There is no apparent reason thatthe dealer charged one large set of customers 249 and anotherlarge set 219.Dealer’s cost 37 99 199 69Dealer 3 (KY) 299Other dealers display much more inconsistency in their pricing.Dealer 3 had a wholesale cost of 55 per Etch product. Thedealership priced these products in a wide range. Most customerswere charged 69, 99, 199, and 299, but the dealer also madesales at 1 and 219.Dealer’s cost 55 100 100 399 300 46 750 145 100 699 999 199 149 200 289 1 599 100 799 1000 995 265 100 245 499 299 100 1,699Dealer 4 (VA)Some pricing ranges were even more extreme. Dealer 4 had twodifferent wholesale costs for Etch products — either 35 or 65.The dealer sold over 600 Etch products in 2012. Of those, 213customers were charged 199. But other customers were chargeddifferent amounts, ranging from 1 to 1,995. 1,995Dealer’s cost 35 or 65To increase transparency of pricing and help prevent discriminatory practices, dealers should berequired to:1. P ost the available add-ons and their non-negotiable prices on each car in the lot along with the price of thecar itself.2. C ollect data about consumers’ race and ethnicity as part of the transaction and make the data available,just as mortgage lenders to do.Source: National data set of one provider’s add-on products sold in the U.S., 2012. National Consumer Law Center, 2017 2017 National Consumer Law Centerwww.nclc.orgAuto Add-Ons Add Up: Charts and Graphics 21
Americredit Ally Auto Loan Inc. Bank of America First Third Bank First Merit Bank Wright Patt Credit Union Capital One Auto Finance Hundai Motor Finance 2017 National Consumer Law Center www.nclc.org Auto