Transcription
Journal of Public Administration, Finance and LawINVENTORY MANAGEMENT, SERVICE LEVEL AND SAFETYSTOCKAlin Constantin RĂDĂŞANUAlexandru Ioan Cuza University,Iaşi, Romania,alin.radasanu@ropharma.roAbstract: There are many studies that emphasize as a first objective of inventory management to minimizethe value invested in inventory because it has a direct impact on return on assets. This approach is not fullycorrect. The actual objective is to determine the value and the mix of inventory that support a high servicelevel for customers and that maximizing the companies’ financial performance. Many companies look attheir own demand fluctuations and assume that there are too many variables to predict demand variability.Service level is used in inventory management to measure the performance of inventory policies andrepresents the probability of not being stock-out and not losing sales. Safety stock is inventory that iscarried to prevent stock outs. Safety stock determinations are not intended to eliminate all stock outs, justmajority of them. Companies choose to keep safety stock level high as a buffer against demand variabilityresulting in inefficiencies and high working capital requirements. Safety stock optimization enablescompanies to achieve savings and increase inventory turns.Keywords: safety stock, service level, standard deviation, stock keeping units (SKU’s), service factor.1. GENERAL CONSIDERATIONSThe satisfaction of the client is the most valuable assets of an enterprise canrecord. The measurement of the service level is important due to its connection to themanagement of stocks because it can affect the relationship with its customers anddepending on the nature of the business, it can determine an important impact onprofitability.Even though many companies regard to stocks as being an element of cost, thereare companies which regard them as active components that contribute to the leading of aspecific market share through a high level of service, offering an availability of productsin the quantities that are needed when a request is made from clients.The most important objectives in improving the management of stocks are:- Reduce inventory carrying costs and other related;- Customer retention issue need to improve service level;- Support growth in new channel;- Gain market share through superior service and product availability.According with researches effectuated by the American company AberdeenGroup the truly visionary companies use stocks as a competitive weapon throughsegmentation of the portfolio of products depending on the medium investment in stocksand the contribution generated. Therefore, these companies are able to attain higherreturn on assets than other competitors which are active in the same segment of activityIssue 9/2016145
Journal of Public Administration, Finance and Lawand achieves growth of income through the management of stocks, even if thecompetition is in a sector which is recording stagnation.Traditional inventory management practices are being made obsolete byincreasing global supply chains, more dynamic product life cycles and multi-channeldistribution. These are driving the need for companies to adopt new inventorymanagement technology that can reduce inventories while simultaneously increasingcustomer service level.2.SERVICE LEVEL AND SAFETY STOCKIn inventory management, service level is the expected probability of not hitting astock-out during the next replenishment cycle or the probability of not losing sales.The service level is determined in a company by the level of stocks. Therefore,the safety stock level must be high enough to cover vendor’s delivery times, sufficientenough to cover customers’ demand, but not so high that your company loses moneybecause of high carrying costs. The main reason is because demand fluctuations and isnot enough consistency to predict future variability.Retailers and producers are trying to record a high level of satisfaction within theclient basis which will maximize sales. Although at the same time maintaining a highlevel of stock is expensive and presents different risks such as: storage, expiration andlowering of prices. The higher level of stocks the higher the risks and costs will berecorded. In the retail sector setting a high level of service is imperative. Companies thatset their goals at the level of 95% do this because the level of service is a key factor inassuring the fidelity of the clients.The service level marks a trade-off between opportunity costs and operation costs.Optimizing the service levels to maximize the returns for the company is usually complexand domain-specific. The analysis is sensitive: reducing the inventory levels results inextra-cash being immediately available while it might take years to observe a lowercustomer gained through more stock-outs.Customer sensitivity regarding stock-outs vary from one product to another, theoptimum service level being specific to each product individually. In practice in order tolower the complexity the heuristic approach is usually used.ABC analysis is based on the idea that the more revenue a product generates, themore “important” this product is supposed to be, both for the retailer and for hiscustomers. This assumption offers a convenient way to categorize products to theirrespective sales volume. Each category is then assigned its own service level as follows:- items A, top 20% products, classified as “critical few”: high service level, e.g. 96-98%;- items B, next 20-30% products classified as “interclass”: medium service level, e.g. 9195%;- items C, last 50-60% products classified as “trivial many”: lower service level, e.g. 8590%;The ABC analysis is used to determine an adequate service level for groups ofproducts, but, in theory, it is possible to find an optimum service level for each individualIssue 9/2016146
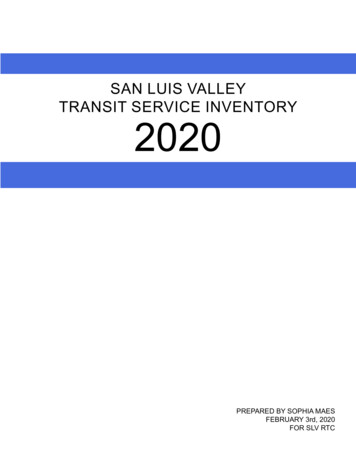
Journal of Public Administration, Finance and Lawproduct. But a more efficient approach to find an optimum service level, based on thebusiness point of view, should be considered in the long-run.The target service level can be defined as a trade-off between the cost ofinventory and the cost of stock-outs. As a consequence, one could get an estimate ofthese costs and tackle the service level issue through a cost analysis.Generally speaking, the cost of inventory is numerous and sometimes not easy toisolate in terms of accounting, but can be identified: cost of working capital, cost ofstorage space and cost of routine manipulations. On the top of these costs can be addedfor certain products cost of obsolescence, the cost of inventory gone bad and destroyed.The cost of stock-outs is an altogether different and more complex matter. Themost obvious cost of stock-outs is the lost sales, but this factor, however important it maybe, is far from being the only one, nor the most significant.Extensive studies have shown that stock-outs are a huge risk in terms of clientsatisfaction and can cause, in the long run, a serious erosion of the client database.All efforts within a company to improve the service level consist of an assortmentof sub goals that are monitored and that must be part of a process of continuousimprovement. For a company to meet the requirements of the service level that wants toprovide, it focus on the following individual goals: readiness to deliver, delivery time,delivery flexibility, reliability and quality.Readiness to deliver is the ability to satisfy a requirement on time. Readiness todeliver can be measured in different ways, depending on company’s focus.If company wants to measure readiness to deliver according to the number ofunits sold, the formula is:Table 1 contains additional formulas for calculating service level.Table 1 Options for calculating the service levelCriterionStock outFrequency of stock outsFrequency of stock outsLoss of salesStock out periodSource: Hoppe M., 2008 p.339Formula for service levelthe number of quantities delivered / the total quantity of the demandthe number of order delivered / the total quantity of customer salesordersthe number of order item delivered / the total quantity of order itemsthe value of quantities delivered on time / the value of the totalquantity of the demandthe number of days with stockout / the total number of daysSafety stock is defined as inventory that is carried to prevent stock out and backorder situations. Safety stock protects against various deviations, such as delivery datevariances (when the replenishment lead time varies), requirement variances (when theforecast is inaccurate) delivery quantity variances (when the vendor does not deliverenough materials or the quality of delivered materials is poor) and inventory variancesIssue 9/2016147
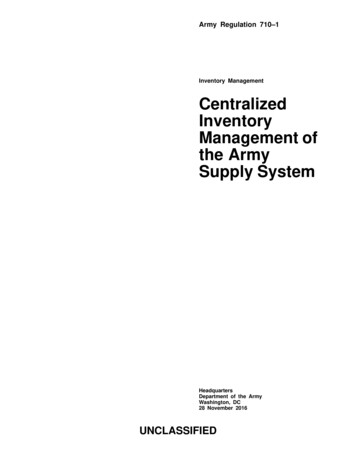
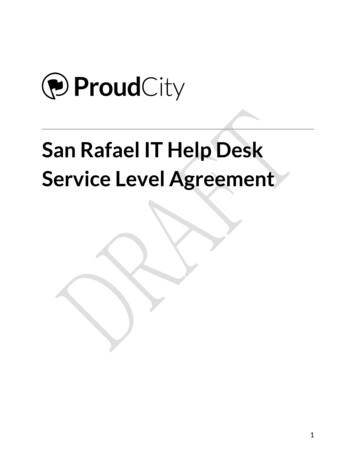
Journal of Public Administration, Finance and Law(when inventory recognizes a deviation between the plan and actual inventory). Figure 1summarizes these deviations and shows the relationships among them.Figure 1: Reason for safety Lot sizeDelivery quantityVarianceReorder PointSafety stockReorder pointDelivery dateDelivery dateVarianceTimeReplenishmentSource: Hoppe M., 2008 p.337lead timeBased on the consumption behavior of a product, the literature distinguishesbetween two variants to determine the safety stock. The safety stock can be calculatedeither based on historical distribution of demand or on the basis of a future distribution ofthe demand (forecast error).The formula for the standard method is as follows:Safety stock safety factor * average replenishment lead timeThe formula assumes that the demand is distributed normally during thereplenishment lead time.The safety factor indicates how many standard deviations correspond to a specificservice level. If the stock issues are distributed normally, it can be determined the safetyfactor from the distribution function of the standard normal distribution.According to the ultraconservative method the safety stock is as follows:Safety stock maximum daily consumption * maximum replenishment lead time in daysThis method leads to surplus stocks, because it is always based on maximum. Itshould be used for critical materials or for that SKU’s that consumption cannot bepredicted.According with Percentage method the safety stock be calculated as follows:Safety stock average consumption * average replenishment lead time *safety factorIssue 9/2016148
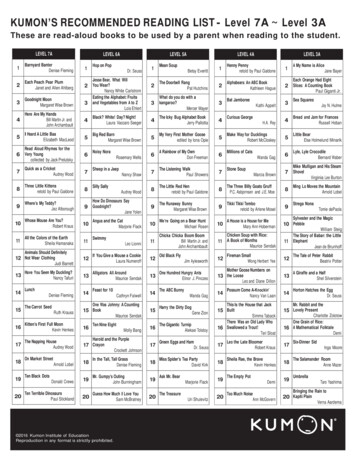
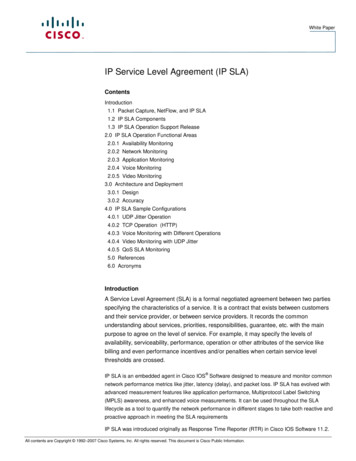
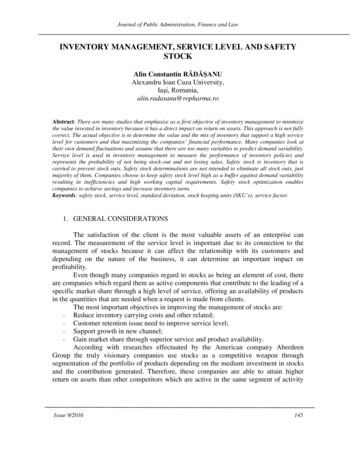
Journal of Public Administration, Finance and LawThe safety factor is between 20% and 40% and is chosen on instinct withoutconsidering specific criteria. This method depends on the knowledge and experience ofthe stock controller and by the company’s acceptance of this factor.In practice, the following rules of thumb are used to determine the safety stock:Safety stock average period consumption * replenishment lead time in daysOr:Safety stock 10-20% of the average stock level.3.STATISTICAL MODEL FOR CALCULATING SAFETY STOCKIn general the initial value of the safety stock must be verified and calculated withthe help of an informatics stem which a set time periods to have a safety stock adjustmentif the demand will record some changes.Considering that the safety stock is used for offering a certain level of protectionand represented by the deviation of demand, there can be used statistical functions.Statistical theory can be used to produce decisions for achieving a specific service level.To specify a desired service level, management should be informed in advance of the costimplications of various policies. Should be emphasized that the additional inventoryrequired to improve service level becomes progressively greater in moving to very highlevels of service.It has been suggested that service level and safety stock can be much moreeffectively controlled through the use of standard deviation.The normal distribution describes a set of data where most values are close to themean (average) value, fewer values exist at extreme distances from the mean value andthe total number of values occurring above the average values is close to the total numberof values occurring below the average value.demand in period “i”;average demand.For a normal distribution 68.26% of the data falls under one standard deviation ofthe mean ( 𝛔) 95.45% of the data falls under two standard deviation of the mean ( 2𝛔) and 99.73% of the data falls under three standard deviation of the mean.( 3𝛔).Where:Issue 9/2016149
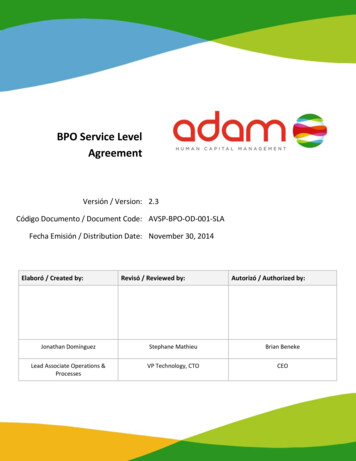
Journal of Public Administration, Finance and LawFigure 2: Normal distribution according with y of occurrence68.26%95.45%-3σ-2σ-1σSource: Hoppe M., 2008 p.373 2σ 1σ 3σDeviation from average valueThe service factor is used as a multiplier with the standard deviation to calculate aspecific quantity to meet the specific service level.In the Table 2 bellow it is presented a service factor used to convert service levelpercentage to service factor (with the help of function NORMSINV from Excel).Table 2: Relationship between desired service level and service factorDesired service levelService %1,697%1,998%2,199%2,399,90%Source: author’s computation3,1As illustrated the relation between service level and service factor is non-linear:higher service level require higher service factor and higher safety stock level.Issue 9/2016150
Journal of Public Administration, Finance and LawIf the desired service level is 98% and the inventory reached reorder point, duringthe lead time, the company expects to fill all customers’ orders during the lead time 98%of the time. For 2% of orders the company will expects to run out of stock. In this waythe company will forecast the frequency of the stocks-out. In the other words, thecompany has an estimate of how frequently will run out of stocks, but no estimate of thequantity or size of unfilled orders.Rather than using a fixed service factor for all products, the company can setdifferent service factor for groups of products based on strategic importance, profitmargin or contribution of sales. The products with greater value for the business willhave more safety stock.If it is assumed a deterministic replenishment time and a stochastic or randomconsumption the safety stock calculation can be done with the equation:*Where:Z service factor (Z- score); standard deviation of demand;LT total lead time;T time used for calculating standard deviation of demand.If the lead time, order cycle time and forecast period were all the same and if theforecast was the same for each period and equal to the mean of the actual demand forthose period, this formula would work great.Since the situation is highly unlikely to occur it must be added factors to theformula to compensate for these variations.When variability in lead time is primary concern, the safety stock equationbecomes:Where:Z service factor (Z- score) standard deviation of lead time; average demand.When both demand variability and lead time variability are present, statisticalcalculations can be combined to give a lower total safety stock than the sum of the twoindividual calculations.The safety stock is service factor times the square root of the sum of theindividual variability’s squares.Issue 9/2016151
Journal of Public Administration, Finance and LawBut when demand and lead time variability are not independent of each other, thisequation can’t be used. In these cases, safety stock is the sum of the two individualcalculations:With the recognition of what factors dominate the equation, it becomes easier tofocus improvement efforts. If a reduction in safety stock desired, it is far more productiveto reduce demand variability than lead time variability. If a high level of customer serviceis not required, safety stock can be lowered to a more appropriate level.Once safety stock has been established, inventory level should be monitored on anongoing basis to determine if the inventory profile is as expected. If not, before anyadjustments are made, perform a root cause analysis to see if any special causes areresponsible for the deviations from expected results.CONCLUSIONSDetermining appropriate inventory level is one of the most important and mostchallenging tasks faced by operations management. If the company carry too muchinventory, it ties up money in working capital; if the company doesn’t carry enoughinventory, it faces stock outs and reduced service level.There must be a balance between inventory costs and customer service. One keychallenge is calculating the safety stock level to achieve the desired customer servicelevelsUnfortunately, rules based approaches tend to be a „one size fits” all approach toinventory management. This means that the rule will deliver the right amount ofinventory for some items, too much inventory for other items and too little inventory tomeet service levels for other items.The most accurate and effective method for calculating safety stock is a statisticalapproach for setting and meeting target service level while maintaining minimalinventory levels to keep operational costs low. It is very important to test the model priorto final implementation to ensure it is working correctly and to determine impact oninventory levels.For the statistical model calculation it is not easy task to gather all the data that isneeded. Each SKU needs to have its own re-order point calculations and its own safetystock calculation. This can become confusing if attempted without a system to supportthe calculations.Issue 9/2016152
Journal of Public Administration, Finance and LawReferences:[1]. Aberdeen Group (2006): The technology strategies for inventory management benchmark report –How to convert inventory from cost to a competitive advantage, Retrieved fromhttp://www.euginda.com.hk/business insights pdf/The Technology Strategies for Inventory Management Benchmark Report(p1).pdf[2]. Council of Supply Chain Management Professionals and Matthew, M. / Terry L. (2014): The definitiveGuide to inventory management, Pearson Education LTD, 129-152.[3]. IBM (1962): IMPACT – Inventory management program and control techniques, Retrieved f/ibm/generalInfo/E208105 IMPACT Inventory Management Program and Control Techniques 1962.pdf[4]. King, L. (2011): Crack the code: Understanding safety stock and mastering its equations, df[5]. Hoppe, M. (2008): Inventory optimization with SAP, Galileo Press, 335-404.[6]. Piasecki J. (2009): Inventory Management. A focus on forecasting, Lot sizing, Safety Stock andordering Systems, 133.[7]. Simionescu A., Schvab M., Bud N. (2004): Managementul Aprovizionarii, Editura Economica, 287300.[8]. Vermorel J. (2012): Calculate safety stock with sales forecasting, Retrived ith-sales-forecastingIssue 9/2016153
In inventory management, service level is the expected probability of not hitting a . Extensive studies have shown that stock-outs are a huge risk in terms of client satisfaction and can cause, i