Transcription
“How To Use TC2000 To Find The BestCandlestick Trades”The Inside Secrets of a Professional Investor – Developed Overa 15-Year Time Period to Achieve At Least a 10% Return PerMonth in Common StocksA Candlestick Forum publication – Years of Candlestick Analysis made available in conciseformats. Information that when learned and understood will revolutionize and discipline yourinvestment thinking. Copyright March 2002 by The Candlestick Forum. All rights reserved
TC2000 – The Perfect Search ProgramIn staying with one of the basic concepts of the Candlestick analysis method, thestatement, “Observe the obvious” will be repeated many times over. If something issuccessful, it got that way because of the results it produced. The same can be said for theTC2000 software program. It has gotten to be one of the world’s leading computersoftware search programs due to its results. The Worden Brothers have put together aneasy-to-use program that works extremely fast and without bogging down yourcomputer’s operating system.To state simply, TC2000 has established itself as a leading participant in the stock searcharea due to its results. Having the ability to customize stock searches has become veryimportant in the last decade. Technical analysis, mainly statistical analysis, until recentlyhas been the property of large investment firms. Huge computers were required to testpatterns and proposed theorems. The improvements in computer strength and memoryhave made statistical testing available to the common man.Computer programming has improved dramatically over the past decade. Not only is thestrength in smaller computers been expanded by huge percentages greater than a fewyears ago, the software to make formulas understood by the computer has immenselyimproved. Testing new theorems is now as easy as typing in a few easy formulas.TC2000 has excelled in this area.This information so far is probably just “preaching to the choir”. It is assumed that if youare reading these pages, you are already a subscriber to the TC2000 software service.Through the years of developing highly successful trading programs, whether forinstitutional or individual investors, it has been found that TC2000 fits the vast majorityof requirements that can successfully utilize the Candlestick concept.Today, investment strategies are not solely the property of large investment firms. Theaverage investor has every capability to discover the best trading formulas as the largestinstitution. The following programs were developed for making the best use ofCandlestick signals. They work very well. However, that does not restrict the possibilitythat on some cold winter night, as you are toying around with other investment concepts,you could inadvertently add a new parameter or combination of indicators that wouldsuddenly produce phenomenal results.As you read this, you may come across commentary that you have seen before, either in“Profitable Candlestick Trading” or in other of our published e-books. Please plowthrough it. A good amount of the basic concepts of Candlestick analysis is required as aprelude to the different topics that we explain in detail. It does not hurt to be refreshed onsome of the basics of Candlesticks. Most of the knowledge conveyed from thismethodology is common sense incorporated into graphic signals. The functionaloperative of this statement is “common sense.” If we always remembered the commonsense things to do when it comes to our investment dollars, we wouldn’t need to bereading this. We would always buy at the bottom and sell at the top.2
Unfortunately that does not happen. Our downfall is human emotion. That will neverleave us. So, the next best thing to do is to develop an investment program that puts theprobabilities so far in our favor, emotion does not come into play.Candlesticks – Finding the Perfect TradeUnderstanding the significance of the signals can be summarized in one statement. THESIGNALS ARE CREATED BY THE CUMULATIVE KNOWLEDGE OF ALL THEINVESTORS PARTICIPATING IN THAT MARKET/STOCK DURING THAT TIMEPERIOD. If you don't remember anything else about Candlesticks, remember thisstatement. Stated another way, the movement of a market and/or stock is directlyinfluenced by the total knowledge of all investors of what is happening in that marketindex, industry, company politics, world affairs and/or the price of tulip bulbs. Everybodywho acted in that market in that time-frame, did so based upon the information they hadaccess to. That is the reason the Candlestick signals are extremely informative. Theyreveal information not always available to the common investor.The Signal "IS" The Culmination of all Active InvestorKnowledge During a Time Period.Understanding the ramifications of the above statement produces invaluable insight. Astock having a strong buy signal appearing on a day that the market index, the one mostclosely associated to that stock, is crashing has significant ramifications. Investors werebuying that stock despite the fact that the market index was declining or a stock crashingin a strong up day in the market. That indicates that other factors influenced investors toget into that stock that day. Again, that signal was created with the cumulative knowledgeof all the buyers and sellers that day, of which part of that knowledge included knowingthe direction of the index. TC2000 software simplifies the process for extracting theinformation we are looking for. It will pinpoint where the buying and selling is occurring,showing the contrasting as well as the confirming positions.Computer Searches Help Confirm Market DirectionThe first logical step for maximizing the probabilities in our favor is knowing whichdirection the markets are moving in general. It is so often heard from the “investmentexperts” that you cannot time the market. The U.S. investment public has beenindoctrinated with this propaganda for decades. And for decades it was probably true formany investment professionals. However, that line of rationale is the excuse for the lazyor the uneducated money professional.If you can’t time the market, those people that believe that have to think Warren Buffetand George Soros as just plain lucky. They have outperformed the market for the3
majority of their careers. Luck? No. They have been successful at timing the markets andspecific sectors in the markets.“The best way to make large profits in the market is to buy the best companies in anindustry and hold it through the good and bad times.” This is often-heard advice from avast majority of the professional advisors. Amazon.com was the leading company in itssegment of the industry in March, 2000. Cisco Systems was one of the leaders in itsindustry in March, 2000. Priceline, Enron, AT&T, were all leaders in their industries.Would you want to have been a big buyer of these stocks two years ago? Has WarrenBuffet just been lucky all these years?The people that believe that you cannot time the market don’t know HOW to time themarket or they do not have the TOOLS to time the market. Maybe that is why theprofessionals who say the market cannot be timed always seem to be older. They did nothave the tools when they were early in their investment careers to take advantage of theoscillations in the market. They may also be the generation that does not want to learnhow to use a computer. It is understandable that the belief the market cannot be timed hasand still does exist. To be able to project what might happen in the future has to have a lotof historical data to develop criteria for events to happen in the future. Until veryrecently, within the past ten years, historical market data was hard to come by. Today, itis readily available.However, there was one well documented investment method that had been assembledover hundreds of years of observing data. Japanese Candlesticks. Candlestick analysiscompletely dispels the notion that the markets cannot be timed. It has been usedeffectively for hundreds of years for identifying trend reversals, thus timing markets.All the indexes, the DOW, Nasdaq, and S&P can be analyzed by Candlestick analysis.Having that ability is a major factor for finding the perfect trades. Analyzing the status ofthe market indexes is the first step towards maximizing profits. This is a very simple task.The same parameters that would be applied to individual stocks can be applied to theindexes. Where is each index at this point in time? What is the status of the stochastics?Where is the M.A.C.D. in relation to the central line?Having the ability to analyze the direction of the market indexes is the first method ofdetermining which direction the indexes are heading. The TC2000 search softwareprovides another simple and logical means for determining the general market direction.The TC2000 software program can scan the entire universe of stocks (Dow, Nasdaq,S&P), approximately 10,000 possibilities, almost instantly. It can be programmed to scanfor your personal parameters, signals that you can customize, as well as providing dozensof technical indicator searches that are built into the program. For the price of a gooddinner for two each month, TC2000 can save you hours upon hours of time.These searches provide two important functions. The first being the identification of thebest possible Candlestick potential trades. Secondly, it produces valuable information on4
where investment funds are being placed. Distinguishing where investment funds areflowing to and from furnishes the investor with extremely profitable opportunities. Theparameters of a search can be developed to identify the best potential long positions andthe best potential short positions. The results can project and/or confirm what has beenidentified by viewing the index charts. If a search, with equal parameters for both longand short positions, produces more potential situations for one direction versus the other,it can be logically deduced that the market is going to move in that direction. Forexample, you have developed pre-established parameters for the best potentialCandlestick trades. The results of the search, after scanning the universe of stocks, or theuniverse that you have developed as tradable stocks, produce common sense information.If 400 stocks fall into the category of being overbought and have potential for creating"sell" signals and 100 stocks show to be oversold and have the capability to produce"buy" signals, it becomes obvious that four times as many stocks are ready to turn down.If this information is correlated to a chart that has been in an up trend for a period of time,it should make you wary that the market is about to reverse and head down.400 Potential SellsVersus Better probabilities that themarkets are ready to start adecline100 Potential BuysThe market trend does not need to be timed perfectly. Just the general trend is what youare looking for. Knowing which direction the trend is moving increases the probabilitiesof successful trades dramatically.Logic dictates that a portfolio of stock positions will not perform tremendously well if itis positioned opposite the major market trend. That does not rule out the possibilities ofbeing long stocks that are going up during a down-trending market. The "probabilities" ofthat happening are much less than the obvious alternative. Use whatever cliche youprefer. "The trend is your friend", "Don't try to swim upstream", why place investmentfunds into positions that do not provide the highest probabilities of making money? If thecharts tell you that the general market trend is down and the "sell" potentials greatly outnumber the "buy" potentials, put the majority of your investment funds into shortingstocks or staying in cash until the next up-trend is identified.The Candlestick signal is the most important factor in technical analysis. It reveals thatbuyers were coming in during unfavorable surrounding conditions. The strength revealsthat other factors had to be effecting the movement of the stock price. One suchpossibility can be the "investor consensus" pertaining to a specific industry.5
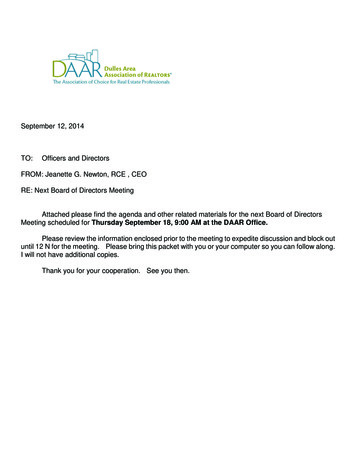
Revisit the example above, where the index signal appeared to indicate a top, and thesearch produced 400 good “sell” signals and 100 “good” buy signals. Despite the fact thatthere were four times as many short potentials as there were long potentials, longpotentials were still available. Depending upon each individual’s investment plan,specific results of the search will benefit investors with different investment goals. These100 stock possibilities produce valuable information. For instance, it might reveal that alarge percentage of these 100 stocks, showing excellent "buy" signals, are coming fromone or two industries. This valuable information can be identified very quickly. Theseindustries should be looked at closely. Something fundamental may have occurred tomake a large number of stocks in a particular industry move up while the rest of themarket was moving down.Which Direction is Each Sector Moving?TC2000 also has the ability to search individual industries. These searches can sort theindustry indices from the most overbought to the most oversold. The same visual analysiscan be applied to industry indices as they can to individual stocks. Has a candlesticksignal been identified? What is the status of the stochastics?HaramiFigure 1.6
Note in Figure 1, the OSX, Philadelphia Oil Service Index, a confirmed Harami revealsthe start of a rally. If this occurred when the rest of the market was declining, the open ofthe first day after the Harami signal would make it obviously apparent to the Candlestickanalyst that strength was coming into this sector. It may take another day or two for theconventional Western chart analyst to pick up that there had been a reversal in thisparticular industry.There is a certain amount of safety in participating in the sector moves. It adds anotherelement of confirmation that money will flow to specific stocks in that sector. Manytimes a “buy” signal appears in a stock that is in a declining sector. Unless that “buy”signal is the result of a unique situation going on with that particular company, it isusually just a bounce up during a downtrend. Witnessing a strong “buy” signal in a stockin a sector that is showing a number of stocks in that sector getting attention provides amuch greater probability that the “buy” signal in that particular stock will have morefollow through. The short-term Candlestick trader will be alerted to where the funds areflowing. Even in a down market, "long" trading opportunities can be identified. Theshort-term trader has something to trade in a down market. The long-term investor mayhave discovered the beginning of a major up-trend for an industry. If the weekly and themonthly charts of a sector correspond with the daily chart, the long-term investor hasidentified where to place funds for a long-term hold. The option trader may have found agood option-buying situation. A steadily declining market should have greatly reducedoption premiums. Identifying an industry or group of stocks, prior to the majority of theinvestment community, at the very beginning of an up-move, produces highly profitableopportunities. In a nutshell, when the best probabilities are on the short side of trading,longs can still be found. Of course, the opposite is true. There will be good shortopportunities during roaring bull markets.Back to putting all the probabilities in our favor. Our analysis is that the index, mostassociated to the stocks that we trade, has an observable trend. Use the following scenarioas an example. The markets have all had clear reversal signals. It is time to go long. TheTC2000 search produces 500 excellent "buying" opportunities, and only 60 good "sell"opportunities.The next TC2000 search can be for specific industries. Which industries have had thegreatest percentage decline during the previous downtrend? Which industries appear tohave the strongest "buy" signals developing? Which industries have the loweststochastics that are now starting to turn up? These are all parameters that can be appliedto a TC2000 search. The results are produced instantly. These results now direct theinvestor to the highest profit potential groups. For example, the TC2000 search narrowsthe best potential trades to three industry groups. These industries had the mostpronounced declines during the downtrend. They are now showing the strongest buysignals. Within these industries, the field of "great" potentials is narrowed down to 50positions. From that number, the investor can evaluate which are the four or five bestpotential trades.7
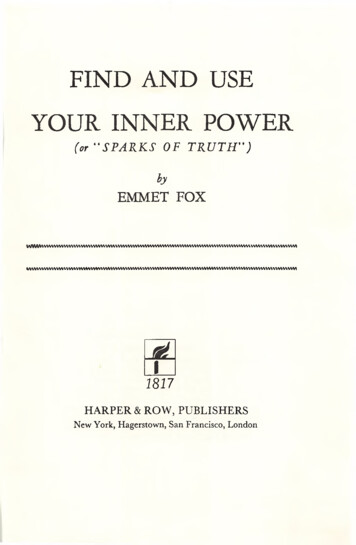
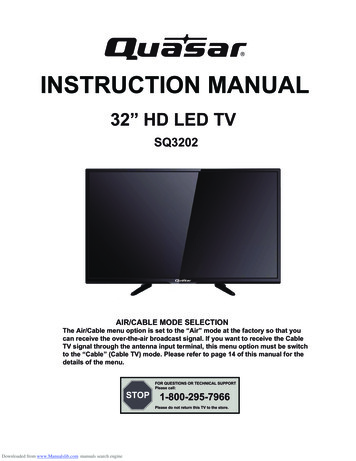
Which Stocks in That Sector Have the Best UpsidePotential and the Least Amount of Risk?The objective of any investment program? Producing the maximum return whileminimizing risk. How does Candlestick analysis accomplish this? Back to the basics common sense! How is the potential field of 50 great prospects narrowed down to threeor four?Let us review. To get to this point, the Candlestick charts visually illustrated the directionof the market. Then an excellent "buy" signal presented itself on the index chart. TheTC2000 search program verified the beginning of a new direction with over 500 excellent“long” possibilities, compared to 60 "sell" potentials. A further TC2000 search identifiedthe best potential industry groups. The combination of these groups provided 50 excellentprospects.What parameters are used to pick the best of these excellent prospects? It can be assumedthat each industry index is comprised of a number of these stocks. If the evaluation of theindex resulted in recognizing that a "buy" signal had appeared, and the stochastics werein the oversold area and turning up, it can be assumed that the stocks representing thatindex will have somewhat the same appearance. However, there will be differences ineach stock chart. Some did not decline as fast in the down-trending market. Others gotextremely oversold. Some may have started to climb a few days ago or a few weeks ago.These stocks now have less upside potential because a portion of their upside has alreadybeen expended.Note in the following charts, the Nasdaq, Figure 2, and SBL, Symbol Technology Inc.,Figure 3, that the Nasdaq Index was in the process of bottoming out. Almost at the sameexact time, SBL forms a chart that emulates the Nasdaq. Seeing these charts occurring atthe same time provides better probabilities that you have caught the move of SBL at thevery beginning.8
Stochastics show anoversold conditionMorning StarpatternFigure 2.The evidence produced in the Nasdaq chart should give the Candlestick investorconfidence to start purchasing stocks that move in conjunction with the Nasdaq. Becausethe Nasdaq is in the oversold range, it is more logical to be looking for oversold stocks inthe searches. A TC2000 search, looking for stocks that have stochastics below 20 andhave had a big percentage change to the upside would have located SBL, Figure 3.If the same chart patterns are occurring in the sector indexes pertaining to SBL’sindustry, the Candlestick investor has many of the probabilities lining up in their favor,exactly what should be in place to make for a high probability, high profit trade. Thebetter the parameters align, the better the probability that the trade is being executed atthe optimal point. This is important to the day-trader and the option trader who both havetime as a factor.On any given day, a TC2000 search, looking for stocks with stochastics in the oversoldarea may produce 200 candidates. Putting the biggest percentage mover filter on that listwill put the best candidates at the top of the list. Good situations may diminish after thesixth chart. But there should be very viable trades in that small group. At least one ormore will have a visible candlestick signal.9
Stochastics at thebottom andvolume showinga big change ofownershipMorning Star signa
industry and hold it through the good and bad times.” This is often-heard advice from a vast majority of the professional advisors. Amazon.com was the leading company in its segment of the industry in March, 2000. Cisco Systems was one of the leaders in its industry in March, 2000. Pricelin