Transcription
RTI InternationalModeling Economic and Environmental Impacts of ExpandedU.S. Bioenergy ProductionPresented by:Robert Beach, RTI InternationalACES and Ecosystem MarketsFort Lauderdale, FLDecember 10-14, 2012RTI International is a trade name of Research Triangle Institute.www.rti.org
RTI InternationalCollaborators Bruce McCarl, Texas A&M University Sara Ohrel, US EPA Gregory Latta, Oregon State University Justin Baker, RTI International Yuquan Zhang, RTI International Steve Rose, EPRI
RTI InternationalIntroduction Concerns regarding energy security and environmentalimpacts of traditional energy use, including climatechange, have been drivers of rapid global bioenergyexpansionStrengthens linkages between energy and agriculturalmarketsLand resources finite–––Competing demands for land (e.g., urban expansion intoagricultural areas, agricultural expansion into forested land)Production of biofuels from agricultural sources has fueled foodvs. fuel debateAlternative land uses affect natural ecosystems differently; rangeof effects on the sustainable flow of goods and services
RTI InternationalU.S. Energy Independence andSecurity Act of 2007 Revisions to the U.S. National Renewable Fuel Standardprogram (RFS)–––Increases in required volumes of biofuelsSpecific volume standards for cellulosic biofuels, biomass-baseddiesel, advanced biofuels, and total renewable fuels used intransportationNew definitions and criteria for renewable fuels, includingminimum GHG reduction thresholds Renewable fuel, 20% reduction (for new facilities after December 19, 2007)Advanced biofuel, 50% reductionBiomass-based diesel, 50% reductionCellulosic biofuel, 60% reduction4
RTI InternationalBiopower Expansion Renewable Portfolio Standards State-level renewable energy incentives Clean Electricity Standard Carbon Price
RTI InternationalKey Models and Data Sources for EPA Analysesof RFS2 Impacts Large-scale expansion of biofuels production could have largeimpacts on global agricultural production, commodity prices, trade,and land use– Emission factors (GREET, Winrock, Woods Hole)– Agricultural sector models (FASOM, FAPRI, GTAP, BESS)– Land use changes (FASOM, FAPRI, Winrock, GTAP)– Fertilizer N2O modeling (CSU DAYCENT/CENTURY)– Fuel production process models (GREET, USDA & NRELASPEN models, BESS)– Tailpipe emissions (MOVES)– Energy sector modeling (NEMS)6
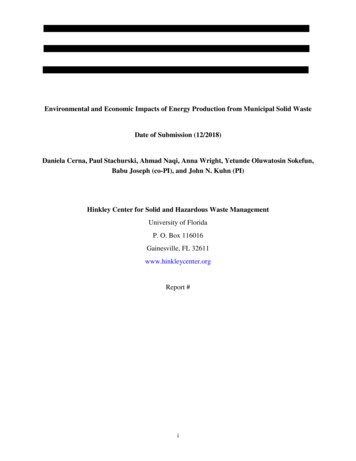
RTI InternationalFASOM Model Structure Objective: Welfare Maximization–Land is allocated between activities (and combined with other inputs) based onrelative rents (including GHG payments) and suitability to maximize intertemporalwelfareTwo Sectors, Four Land Types–Forest – approximately 80 products from private timberland–Agriculture – crops and pasture Over 70 primary and about 60 processed commodities, 20 processed feeds–Developed – Tracks conversion of forest, crop, and pastureland for development3 GHGs — CO2, N2O, CH4–Stocks and flows of GHGs for more than 50 sources and sinks63 US regions (11 market regions) and international trade with 37 major tradingpartnersDetailed Bioenergy Market–Forestry & agricultural dedicated and residue feedstocks–Tracks production of starch- and sugar-based ethanol, cellulosic ethanol,biodiesel, and bioelectricity7
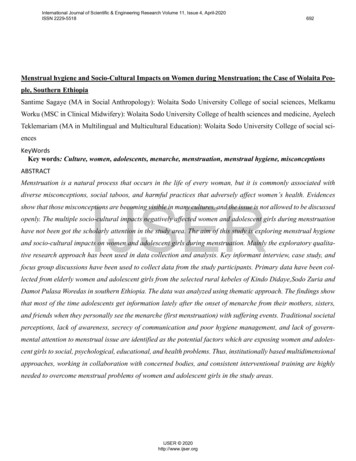
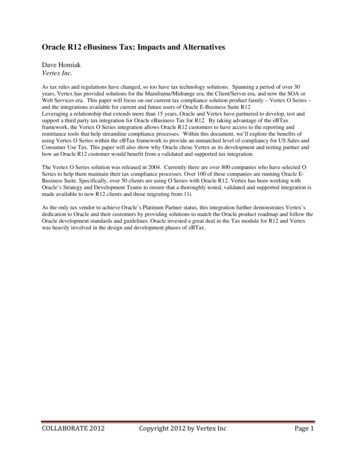
RTI InternationalFASOM Agricultural SectorCroplandIntertemporal welfaremaximization approachWaterLaborCropProductionNatural ResourcesOther ResourcesMarketsHousehold DemandDomestic d MixingPasture LandGrazing8
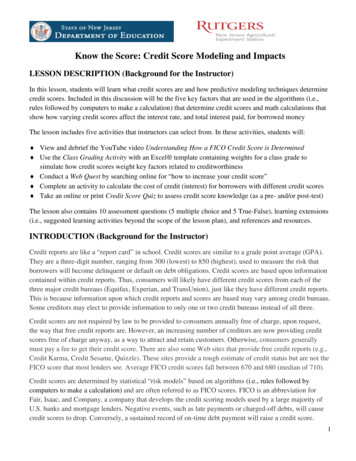
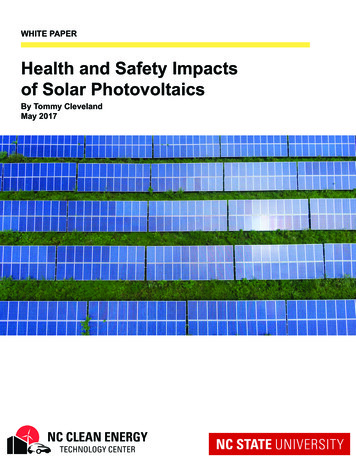
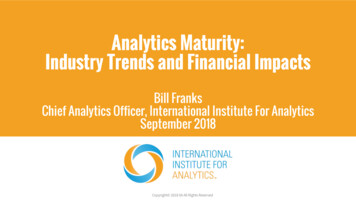
RTI InternationalFASOM RegionsPacificNorthwestWest EastLake StatesGreatPlainsPacificSouthwestNortheastCorn BeltRocky MountainsSoutheastSouthWest9South Central
RTI InternationalFASOM Bioenergy DetailEthanolAgricultural and forestry products:Corn, Wheat, Sorghum, RiceSugar CaneTimberProduction residues:Crop ResidueLogging ResidueManureCellulosicBiodiesel ElectricityEthanolXXProcessing products and by products:BagasseSoybean/Corn OilRendered Animal FatMilling ResidueYellow GreaseEnergy crops:SwitchgrassWillowHybrid PoplarElectricity can be co-fired with coal10XXXXXXXXXXXXXXXXXXXX
RTI InternationalRenewable Fuel Production by Feedstock Used under the Reference Case andControl Case (million gallons per renceCaseControlCaseBiodieselCorn oil (nonfood grade)05420681Edible tallow23232424Lard16532355Nonedible tallow46474848104659120659185581229614Corn residue0004,871Hardwood logging residue075073Softwood logging t residue04207730160Corn (wet milling process)1,2811,3911,3111,391Corn (dry milling 195Soybean oilCellulosic ethanolBagasseSweet sorghum pulpStarch-based ethanolSorghumSweet sorghumTotal ethanolTotal biodieselTotal renewable fuels from agricultural feedstocks inFASOM11
RTI InternationalAcreage, Production, and Price of Corn and Soybeansunder the Reference Case and Control renceCaseControlCaseChangeCornAcreage (million acres)78.783.64.977.981.53.6Price ( 2007/bushel) 3.45 3.74 0.29 3.32 3.60 0.27Production (million 67.367.2-0.168.166.6-1.4 10.02 10.97 0.95 9.85 10.87 1.02SoybeansAcreage (million acres)Price ( 2007/bushel)Production (million bushels)2,988.72,966.2-22.53,080.53,028.1-52.4
RTI InternationalCorn, Soybean, and Total AgriculturalFertilizer Usage, 20222022CropReferenceCaseControl CaseChangePercentageChangeCornNitrogen (1000 lbs)9,592,16510,240,942648,7786.8%Phosphorus (1000 lbs)2,250,3112,533,221282,91012.6%Nitrogen (1000 lbs)418,568442,71224,1445.8%Phosphorus (1000 All crops in FASOMNitrogen (1000 lbs)Phosphorus (1000 lbs)
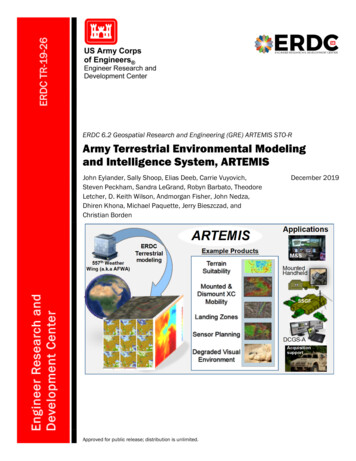
RTI InternationalDistribution of Corn and Soybean Usage, 2022U.S. Corn Use6,000Million Bushels5,0004,000U.S. Soybean Use3,0002,0002,0001,8001,0001,6000Livestock FeedReference CaseExportsControl CaseOther Food, Seed,and IndustrialMillion Bushels1,400Ethanol1,2001,0008006004002000Soybean Crushing(f or uses other thanbiodiesel)14BiodieselRef erence CaseExportsControl CaseOther Food, Seed,and Industrial
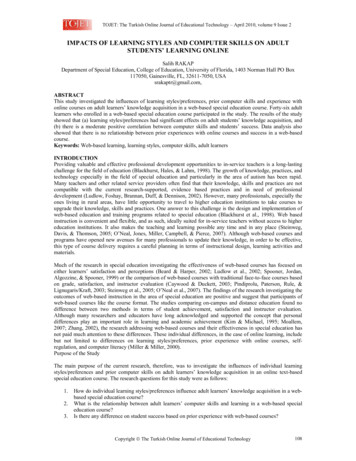
15% Change MulesHogsf orSlaughterMilkFeedlotBeef ilersEggsHorsesandMulesHogsf orSlaughterMilkFeedlotBeef amWheatHardRedWinterWheat-10%Sof tWhiteWheatCottonSof tWhiteWheatRTI InternationalChanges in Commodity Production and Prices, 202240%30%20%10%0%-20%% Change Commodity Price40%35%30%25%20%15%10%5%0%-5%-10%
RTI InternationalU.S. Land Use Change 16Total U.S. cropland in production increases by about0.6 million acres between 2017 and 2022 under thebaselineRFS2 volumes increase cropland area in productionby 4.6 million acres in 2017 and 8.1 million acres in2022 relative to the baselinePasture in use increases by 11.0 million acres in2017 and 3.1 million acres in 2022 relative tobaselineIncreases in cropland and pasture in use comeprimarily from idle pastureland and private forestland
RTI InternationalFASOM Bioelectricity Detail Basic Concept Biomass used for electricity generation displaces coal and thuscoal CO2 emissionsBasic ParametersPower Plant Technology AssumptionsPower Plant TypeCoal Power PlantFeedstocks RequiredCurrentProductionCoalBiomassEfficiencyHeat 1228514770------------- Mt ------------7070671791632533482094Cofire Technologies5% Cofired Biomass10% Cofired Biomass15% Cofired Biomass20% Cofired BiomassDedicated Biomass Plant176366015650
RTI InternationalFASOM Bioelectricity FeedstocksBiomass FeedstockCorn ResiduesRice ResiduesSorghum ResiduesBarley ResiduesOats ResiduesWheat ResiduesEnergy SorghumSwitchgrassHardwood Logging ResiduesSoftwood Logging ResiduesHardwood Milling ResiduesSoftwood Milling ResiduesHardwood RoundwoodSoftwood RoundwoodHybrid PoplarWillowCoal18Feedstock GroupHHVMoistureCrop ResiduesCrop ResiduesCrop ResiduesCrop ResiduesCrop ResiduesCrop ResiduesEnergy CropEnergy CropLogging ResiduesLogging ResiduesMilling ResiduesMilling ResiduesRoundwoodRoundwoodSRWCSRWCFossil 00%33.30%
RTI InternationalBiopower Scenarios Add demand for biopower in addition to transportationbiofuels productionSpecified as overall increases in demand for biopowerfrom alternative sources– 25, 100, 200 TWh/yr increases in biopower productionAlternative feedstock scenarios to explore implications ofallowing different feedstocks to be used
RTI InternationalAlternative Feedstock Scenarios––––––All Biomass Sources – All sources of agricultural and forestry biomassincluded within the model are eligible for use towards meeting the REStarget.Only Agricultural Sources – All agricultural biomass is eligible formeeting the RES (including crop residues, short rotation woody cropsand energy crops).Only Forestry Sources – All forest based biomass can be used to meetthe RES target, but no agricultural biomass (including short-rotationwoody crops) is eligible.Only Forest Residues – Logging and milling residues, which arebyproducts of harvest and manufacturing activities, are applied towardthe RES target.Only Roundwood and Logging Residues – Only logging residues androundwood (i.e., whole trees/logs) are eligible.Only Roundwood – Only logs are eligible, leaving the limbs and tops onsite.
RTI InternationalAverage Annual Land Use Change andCommodity Substitution with Biopower IncreasesPolicyBaseShort-term (2010-2025)Longer-term (2025-2040)Average (2010-2040)Biolelectricity Target LevelsShort-term (2010-2025)All Biomass SourcesAll Agricultural SourcesAll Forestry SourcesResidues OnlyRoundwood and Logging ResiduesRoundwood OnlyLonger-term (2025-2040)All Biomass SourcesAll Agricultural SourcesAll Forestry SourcesResidues OnlyRoundwood and Logging ResiduesRoundwood Only25AfforestationAgricultural Fiber to nce from base 33)2412110071730325100200difference from Base .297.7
RTI InternationalGHG Emissions by ScenarioAgriculture25 100 200Afforestation2510020025Forestry100 20025Total100 200additional emissions in million metric tonnes per yearShort-term (2010-2025)annual avoided fossil fuel emissionsAll Biomass SourcesAll Agricultural SourcesAll Forestry SourcesResidues OnlyRoundwood and Logging ResiduesRoundwood OnlyAll Biomass Sources No SubAll Agricultural Sources No SubAll Forestry Sources No 1(2)0(3)(7)2(1)(0)77(2)31(8)(96)(166) 0573118224Longer-term (2025-2040)annual avoided fossil fuel emissionsAll Biomass SourcesAll Agricultural SourcesAll Forestry SourcesResidues OnlyRoundwood and Logging ResiduesRoundwood OnlyAll Biomass Sources No SubAll Agricultural Sources No SubAll Forestry Sources No 1278158(3)64 (498)3260215210136(4)193(45) (34) (20)24 137 318
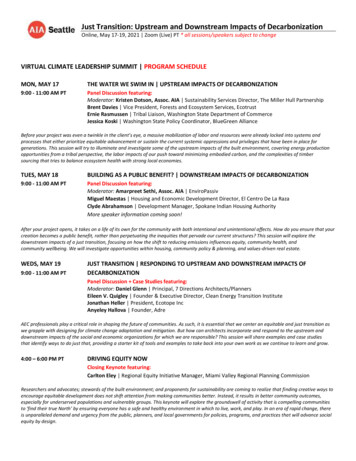
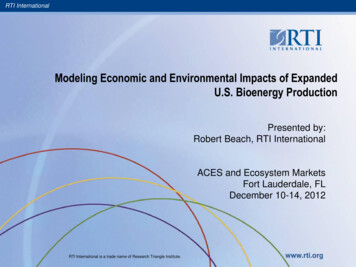
RTI InternationalSources of Biomass
RTI InternationalConclusions Expansion of bioenergy production induces marketeffects domestically and internationally with complexinteractions between markets, product substitution, andalternative land uses Very important to capture these impacts within acomprehensive and consistent framework whenconsidering effects of expanded bioenergy production Implications for ecosystem services–––––Land useBiodiversityInput use (water, fertilizer, pesticides, etc.)GHG emissionsAir and water quality
change, have been drivers of rapid global bioenergy expansion . (CSU DAYCENT/CENTURY) . Base (Mha/yr) (Mt/yr) Short-term (2010-2025) 296 2.6 Longer-term (2025-2040) 216 6.6 Average (2010-2040) 256 4.6 Biolelect