Transcription
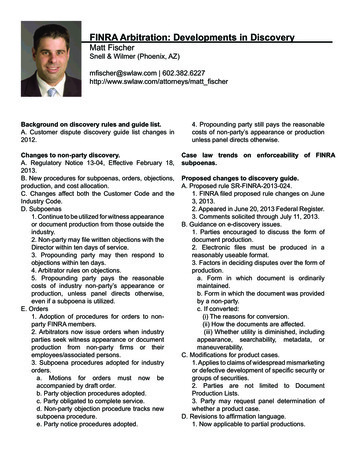
FINRA GatewayReports User GuideVersion 0.906-11-21
Revision HistoryDATE10-04-1901-10-20AUTHORZolboo DashzevegZolboo DashzevegVERSION0.10.2DESCRIPTIONInitial draftUpdated FINRA Gateway Reports style to reflect the new FINRAGateway that’s coming as part of FINRA’s Digital ExperienceTransformation initiative.The count columns will appear in the report grid when any or allcolumns under a top-level column is selected to be displayed in thegrid. For example, if you’ve selected Regulator Code column underRegistrations in Individual Roster template, you will need to click onthe Registrations count to see the associated regulators with theindividual’s registrations.Updates to include feature changes to export, columns, andfiltering. Added tips can tricks on transition from CRD Reports toFINRA Gateway Reports.06-23-20Sarah Rose0.310-08-20Sarah Rose0.4Updated documentation to include filter short cuts and tips andtricks.11-05-20Sarah Rose0.5Changed name from Dynamic Report to be FINRA Gateway Reports02-19-21Sarah Rose0.6Updated to include information on Share and Save As features.05-06-21Sarah Rose0.7Updated to describe new landing page, filter details, and changesto export feature.05-07-21Sarah Rose0.8Updated entitlements information06-11-21Sarah Rose0.9Updated Group and Export sections to cover new features andfunctionality in those areas.
Table of ContentsIntroduction. 1Feedback and Support . 1Accessing FINRA Gateway Reports . 2Entitlements . 2Browser Support. 3Reports Tab . 3Pick a Template. 3Search All Templates. 4My Reports . 4Browse Templates by Category . 5Table Features . 6Scrolling within the Table. 8Adjusting the Table Layout. 9Change the Columns . 11Grouping. 14Applying Multiple Groups . 17Modifying Applied Group Settings. 18Removing Groups . 18Filtering the Data . 19Modifying Applied Template Filters. 19Filtering by Predetermined Values . 21Filter Operators – Equals or Does Not Equal . 22Add Filter Condition. 23Filtering by Date . 25Relative Date Range Example . 25Date Is Null Example . 28
Save a Custom Report . 30Save As . 32Share a Custom Report . 32Delete a Custom Report . 34Exporting the Report. 35Quick Export . 35Advanced Export. 38Single File Export . 39Separate Files Export . 39Printing your Report. 50
IntroductionFINRA Gateway Reports, first released in October 2019, was created to make it easier for firm registration andcompliance staff to answer common questions and make informed decisions using the most current data available. Nowaccessible through FINRA Gateway, FINRA Gateway Reports continues to grow the data sets available for on demand, adhoc reporting. This User Guide provides an overview of this new capability with a step-by-step instructions.More Help ResourcesFor more information on FINRA Gateway Reports, visit the FINRA Gateway Reports page on FINRA.org where we haveposted this user guide and data definitions documentation.If you access FINRA Gateway Reports through FINRA Gateway, you can access help documentation and tutorials throughthe “How Can We Help?” menu.Feedback and SupportIf you have a feature suggestion, technical issue, data issue, or other request, you can create a support ticket in FINRAGateway and our team will review and get back to you. If you do not have access to FINRA Gateway, you can use ourfeedback form here: https://finra.aha.io/idea .Page 1
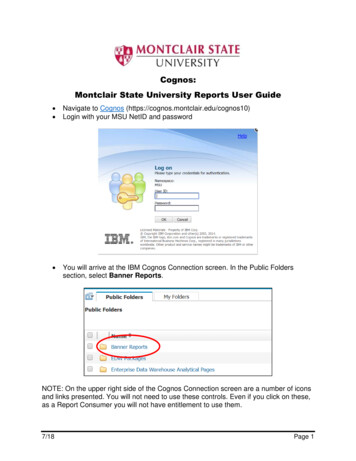
Accessing FINRA Gateway ReportsEntitlementsFINRA Gateway Reports available through the Reports tab in FINRA Gateway. Currently, only broker-dealer firm userswith entitlement to at least one of the following entitlements can access FINRA Gateway Reports. ReportsForm U4OrganizationIA OrganizationAccess the FINRA Gateway at https://gateway.finra.org and insert your credentials and click Accept.Page 2
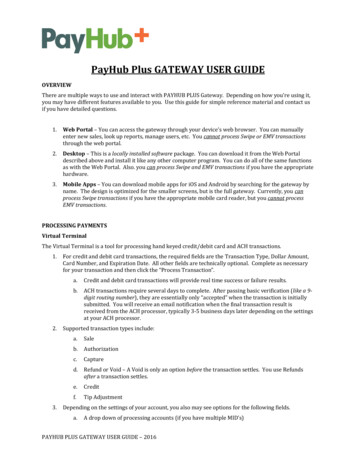
Browser SupportPlease use one of the following web browsers: Chrome, Safari, Firefox or Edge. FINRA Gateway Reports does not supportInternet Explorer. Note: Internet Explorer support will be phased out for FINRA applications.Reports TabAfter logging into FIRNA Gateway, click on the Reports tab.If you are unable to see Reports information, contact an account administrator at your firm to request one of the requiredentitlements as specified in the section above.Pick a TemplatePicking the right template is the first step to using FINRA Gateway Reports. We have provided descriptions for eachtemplate to help guide your decision making.If you have previously set up custom templates, the default view of the Reports tab will be My Reports. If you have notyet set up a custom template, you will see the available default templates.You can toggle between custom templates and default templates using the tabs.Page 3
Search All TemplatesYou can use the search to retrieve templates by keyword.My ReportsThe My Reports section contains custom template you have created by manipulating and saving a default template. Ifyou have not set up a custom template yet, this section will be empty.Page 4
Note custom report templates have a blue background.Browse Templates by CategoryStandard templates are created by FINRA to faciliate common reporting scenarios. Standard templates have a purplebackground. You can browse standard templates by topic using the category navigation in the left margin.For example, clicking on Continuing Education filters the list of templates to the topic of CE.Page 5
Table FeaturesTo get started exploring the table features available in FINRA Gateway Reports, open the Active Individuals Roster. Youcan open the Active Individual Roster by 1) searching for the template by name and selecting from the list that appearsPage 6
or 2) going to the templates tab and clicking on the Active Individuals Roster.Note that within the table certain data points appear in blue font. Click on any one of those numbers to expand the tableto view details about that data point within a sub-table.To collapse the expanded table, click on the number again.Page 7
Scrolling within the TableThe table has scroll bars at the right and bottom of the table to allow you to scroll vertically or horizontally within the table.If you expand a sub-table within the table, the sub-table will also have horizontal and vertical scroll bars.Page 8
Depending on how much data you have on your screen, you may have to use your browser scroll bar to scroll down before yousee the horizontal scroll bar at the bottom of the table used to scroll the table horizontally.Adjusting the Table LayoutSort columns by clicking on the column heading. Columns can be sorted by ascending or descending values (numeric oralphabetical). FINRA Gateway Reports currently does not support count sorting e.g. Registrations. When you applysorting to a column, an arrow will indicate the type of sorting (ascending or descending) that you applied.Page 9
To adjust the order in which columns appear in your table, you can click and hold the column heading and drag it into theposition of your choice.To access additional column formatting options, mouse your cursor over the column heading and the icon below will appear.Click on the icon to access more options.Click on the icon that appears to access the column menu options.Page 10
To copy a value from the table, select the value and right click. You will have the option to Copy or Copy with Header.Change the ColumnsUse the Column tool to add or remove columns from your table. Open the Columns tool.Page 11
Within the Column tool you will see all available columns listed on the left, and all the selected columns listed on the right.Note there is an indicator for instances where a column has nested columns within it. Click the icon to expand a columnvalue to see the columns that are available for the sub-table for that data point.You can remove columns by clicking wherever a column is selected to uncheck that column. You can uncheck columnsfrom the left or right side of the Column tool to remove them from your display.Page 12
You can unselect all selected columns by using the Clear All option at the top of the Column tool.Use search box to search for columns by keyword. Just type a keyword into the search box at the top.If a column you search for appears nested under a parent column, the parent column will appear in the search result. Youcan click to expand to verify the nested columns available. You must add the parent column if you want to include a childcolumn.You can use the Cancel button to exit the Column tool without applying changes. Click the Apply button to apply thecolumn changes you made to the table.Page 13
Once you apply the changes, you can click and drag the columns in the table to reorder them the way you’d like.GroupingThe Group tool is a powerful resource for exploring your data. Certain templates are grouped as a default. When you open atemplate, such as Individuals by Registration Status, you can see the Group information at the top of the page. This showswhat the data is Grouped By. In the column named Group you can see the groupings with counts of records within eachgroup. Grouping by Registration Status gives you a view of all registration statuses within your data set.Page 14
Imagine you want to see individuals at your firm organized by Employment Type so you know who is a non-registeredfingerprinted individual (NRF) versus who is a registered employee. Open the Active Individuals Roster. Click on the Grouptool.Within the Group tool, search for Employment Type. Click the arrow icon next to the word Employment to expand theEmployment group. Select Employment Type Code and click Apply.Page 15
After you click Apply to apply the grouping by Employment Type Code to the Active Individuals Roster, you will get a count ofindividuals within Employment Type.You can click on the group to expand and view details.Page 16
Applying Multiple GroupsImagine you want to know individuals at your firm by their registration category and regulator name. You can use the Grouptool to organize individuals in your firm by Regulator Name and Registration Category Name. Note that the group you applyfirst will be the initial group you see on the result and you will click in to see the next group. That is why the second groupingis slightly indented under the first grouping. You can drag and drop to rearrange the group order.When you apply the two groups, the group tag will turn to a rectangle with a count of the number of groups it contains.Page 17
Modifying Applied Group SettingsClick the Groups tag to edit your group settings. You can add or remove groups and drag and drop to rearrange the grouporder.Removing GroupsIf you want to remove applied groups, you can click the “X” on the group tag.Page 18
Filtering the DataThe Filter tool allows you to refine the data set to include only the records you need. You can filter by any data point youchoose.Modifying Applied Template FiltersTemplates are set up with filters that you can modify to create custom templates. For example, go to the Templates tab,click on the Continuing Education category and open the CE Approaching Requirement template.When you open the CE Approaching Requirement template, you will see a blue tag at the top of the page indicating the typeof filter that has been applied to create this template.Page 19
Click on the blue filter tag to open the filter details.By default, this template is showing individuals with CE window begin date happening in the next 7 days. You can changethose settings to meet your needs. For example, you can change it to be the window beginning in the next 30 days bychanging the number and clicking Apply Filter and Done.Page 20
Filtering by Predetermined ValuesFilter options vary by the type of filter you choose. Some filters include a drop down select list so you can choose from a setof predetermined options. For example, you can filter individuals at your firm by the type of exam they have taken. Choosethe Active Individual Roster template. Then click on the Filter tool.Page 21
From the Filter tool, you can search on the word Exam or scroll to the Exam section from the list that appears. Note you canclick the to expand the option of Exam filters within the subtable. Choose the Exam filter.Filter Operators – Equals or Does Not EqualWhen you choose the Exam filter, you can choose a filter operator. By default, the Equals filter operator will be included.That means the filter will include exams that match the filter you choose. You can change it to Does not Equal if you want toexclude an exam type.Page 22
In this example, we will keep the filter operator Equals and select the exam S7 from the select list of filter options thatappears.Add Filter ConditionIf we want to filter by more than one type of exam, we can click the Add Filter Condition link.Page 23
Clicking the Add Filter Condition option allows us to select another exam type to include. For example, selecting to add afilter for SIE means the filter will include individuals who have taken the Series 7 exam OR the SIE exam.You can add as many filter conditions as you’d like using the Equals filter operator and clicking Add Filter Condition.However, if you choose the Does Not Equal filter operator, you can only choose one filter because the filters function as ORnot AND so the only way to fully exclude a result is to limit it to one. When a filter has more than one option applied, thefilter tag indicator will be a square instead of a rounded oval in the table view. It will also include a count of the number ofoptions that have been selected for the filter.Page 24
Filtering by DateFINRA Gateway Reports provides several options for filtering by date. If you choose the Equals option, you can filter by anexact date. The Less Than option lets you filter results that occurred before the date you specify. The Greater Than optionfilters results that occurred after the date you specify. The Is Null option lets you filter by a date that is missing. And the InRange filter lets you filter by an exact date range using specific dates you provide, or a relative date range, using a timeperiod you want to cover in the filter.Relative Date Range ExampleIf you select the In Range option, you will have a choice of an exact date range using dates you specify, or a relative daterange that can look forward or back in time using time increments of your choice. Relative date ranges are useful in settingup reports because no matter what point in time you open the report, you will get the most up-to-date data.For example, to set up a report of new hires added in the past quarter, you can set up a relative date range on theEmployment Start Date. First, search on employment start date to find and select the appropriate filter.Page 25
Next, choose the In Range filter operator.Page 26
After choosing the In Range filter operator, choose the Relative Range option. In this example, the relative range is set up tocover the past quarter.Apply Filter to apply changes. Click Done. You can save this report as a custom template using the Save tool. Whenever youopen the saved report with the relative date range filter applied, it will show you the new h
FINRA Gateway Reports, first released in October 2019, was created to make it easier for firm registration and compliance staff to answer common questions and make informed decisions using the most current data available. Now accessible through FINRA Gateway, FINRA Gateway Reports co