Transcription
Busting Financial Crime with TIBCO— Ana Costa e Silva, PhDSenior Data Scientist, TIBCO SoftwareWhat if you could use just one financial crime fighting solution that wouldempower your business users to improve handling of financial crimes such as antimoney laundering (AML), credit card fraud, trade surveillance, or medical fraud?Current financial crime fighting systems have a number of disadvantages, including: They flag too many false positives that cause investigators to focus on thewrong cases. They involve manual procedures that result in investigations taking too longto complete. They tend to be a “black box” requiring expensive consultancy to keep aheadof the fraudsters’ ever-changing tactics.In the following pages we explore how TIBCO’s financial crime solution addressesthese disadvantages.PRODUCING MORE RELEVANT ALERTSTIBCO’s approach to fighting financial crime places machine learning at the centerof the crime detection system. Machine learning models use historic data tolearn how to spot risky or abnormal behavior exhibited by transactions, clients,suppliers, or other players. It uses two types of models:Supervised learning algorithms, which tell us how similar to pastfraud a new transaction is.Unsupervised learning algorithms, which tell us how odd a newtransaction seems when compared to past transactions.
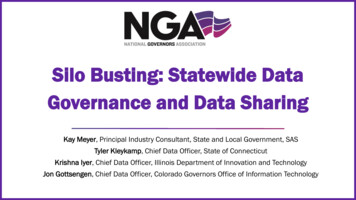
WHITEPAPER 2TIBCO SPOTFIRETIBCO Spotfire data visualizationand analytics software deliversthe most complete set ofanalytics to empower everyindividual to develop and depictcritical insights for faster, betterdecision-making. With Spotfire,organizations can seize newbusiness opportunities and avoidrisks with unmatched speedand flexibility. Using interactivedashboards, visualizations, andpredictive and event-drivenanalytics, users can developinsights immediately on anydevice. Spotfire is an enterpriseclass analytics platform thathelps both business and technicalusers quickly explore data todevelop actionable insights,without requiring IT intervention.TERRTIBCO Enterprise Runtimefor R (TERR) provides a fastand powerful enterprise-gradeplatform on which to run ahuge variety of advancedanalytics based on the popularR language. In addition to broadR package compatibility, TERRdelivers superior performanceand memory management forrunning existing scripts andlarge datasets. TERR is: Embedded in TIBCO Spotfire Desktop and TIBCO Spotfire Analyst, with no additionalinstallation needed, and inthird-party products andcustom applications Integrated into the TIBCOplatform, including TIBCOStreamBase and TIBCOBusinessEvents streaminganalytics for real-timepredictive model scoring Deployable in big dataenvironments (such asApache Hadoop andSpark ) and in grids (viaTIBCO GridServer ) for fast,advanced analysis of big data Free to individual R usersfrom tap.tibco.comThe first model guarantees accuracy, the second the ability to adapt tochanging realities.These models learn from history and then these learnings are applied to thepresent, either in real time or in batch, by simply scoring current data against themodels. Transactions that are found to be fraud-like or odd beyond a certainthreshold will be manually investigated. The setting of the threshold is a businessdecision supported by what-if analyses in TIBCO Spotfire .The following examples explain how the solution can be trained to detectdifferent types of crime.SUPERVISED LEARNING ALGORITHMSModeling with supervised learning algorithms involves obtaining data of confirmedfraudulent and non-fraudulent cases. For example, for a list of transactions monitoredfor AML, one column contains a value of “1” when past transactions were fraudulentand a value of “0” when non-fraudulent. Decision trees, random forests, neuralnetworks, support vector machines, and logistic regression are all examples ofsupervised learning algorithms. Given everything else known about each transaction,they generate optimal ways (models) of separating the 1s and 0s to obtain truepositives with a minimum of false positives.A model is a summary of a pattern in the historic data and therefore a muchsmaller representation of the original data. For example, the decision tree inFigure 1 could have been learned from millions of lines of historic data.If value of the transaction 40K thenIf proportion of value over average balance is 85% thenProbability of a transaction being Fraud 80%,else Probability of a transaction being Fraud 30%else Probability of a transaction being Fraud 10%.Figure 1 Example of the result of a decision tree algorithm on a big data set.TIBCO Spotfire is a visual analytics software tool that allows you to run advancedstatistical models. An easy-to-use Spotfire template can guide the businessend-user through the steps of building and testing model types, even if theuser has no deep knowledge of statistics or data science. The user just needs tounderstand the business.Figure 2 below shows an example of such a template. On the left hand sideunder “Response” the user chooses the variable he wants to model. As an examplefor credit card fraud, the variable would contain the value 0 for all non fraudulenttransactions and 1 for the fraudulent ones. Under “Predictors,” the user chooseswhich features, or columns, of the data he wants to use to build the model. Thenunder “Models,” the user has the option to try different types of models.
WHITEPAPER 3Figure 2 Example of a Spotfire template where business users can train and testdifferent supervised models.Spotfire can automatically detect the presence of new columns in a dataset,and add them to the list of Predictors, which means the user can quickly anddynamically adapt a Spotfire template to include new features. The user is alsofree to include a number of algorithms or just one. When the user presses thebutton “Fit models in parallel,” Spotfire calls out to its statistics engine to run therelevant calculations. Results, including any quality tests performed, are publishedback to Spotfire. In the example in Figure 2, the user only needs to know thatthe best model is arguably the one with highest Area Under the Curve (ACU) asshown in the table.The Spotfire data function carries out all of this work in the backgroundtypically needs to be developed by a data scientist. Data functions arecalculations using your preferred statistical scripting language or workflowtool and are designed for collaboration. Once the data function is created, itcan be easily shared. Any analyst can use data functions without needing toknow any coding. All appropriate business users are empowered to make betterdecisions, including creating fraud models, without being exposed to unnecessarycomplexity. Spotfire supports data functions in different statistical engines, suchas TIBCO Enterprise Runtime for R (TERR), which is embedded in Spotfire, aswell as in open-source R, SAS, Matlab, KNIME, and Lavastorm.UNSUPERVISED LEARNING ALGORITHMSUsing only supervised models is not enough. In fact, some companies may bestarting a financial crime fighting unit without historic knowledge about whichtransactions were fraudulent and which were not. Even when you do have historicknowledge, it is never certain whether all past fraud cases were correctly identified.And even when this certainty is fairly high, fraudsters are creative, and if one strategydid not work, they will try a new one that will leave a different fraud trail behind.TIBCO recommends using a combination of supervised and unsupervisedmodels, and the TIBCO solution accommodates this.
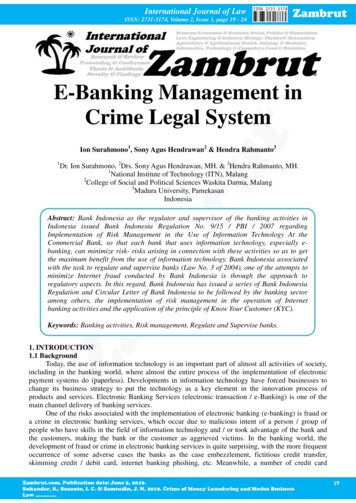
WHITEPAPER 4Unsupervised models have no requirements for prior knowledge about whichtransactions were fraudulent and which were not. Without a goal variable perse, this type of algorithm aims to capture what is “normal” in the data and whichdifferent types of normal there are. Clustering algorithms and self-organizingmaps are examples of this type of model. When applied to financial crime data,these methods allow for profiling normal operations and spotting unusual ones.Unusual does not mean criminal, it means warranting human verification.Figure 3 below contains an example of a Spotfire template that, with minimaltraining, a business user can use to develop an unsupervised model. In this case,a well-established matrix operation called Principal Component Analysis (PCA)is used to represent all transactions. The relevant components are shown on theaxes, where normal transactions appear close to the origin of the chart (0,0 point)and abnormal ones farther from that point. The distance of any new transactionto this origin is a measure of its oddity. This relevant information is not the resultof any human assumption, but is derived directly from the pattern drawn by thewhole history of transactions. Transactions that are unusual beyond an agreedthreshold should be investigated.Figure 3 Example of a Spotfire template in which business users can develop anunsupervised model.GOOD FEATURES MAKE GOOD MODELSAny predictive model is as good as the features put into it. One challengecompanies often face is identifying which characteristics to focus on to identifyfraudulent events. Good fraud features are those that allow spotting unusualbehavior. Often external business consultants are hired to suggest such features,but it’s been our experience that the best features are already intuitively knownby the experts in the firm. Consultants often gather business knowledge frominternal experts and translate this knowledge into quantifiable features that canbe extracted from their databases using SQL. For example, in AML, some relevantfeatures are: Total amount of cash withdrawn. Unusually high values warrant an investigation. Value of withdrawal as a proportion of the account owner’s average balance. Highvalue withdrawals in relation to the average account balance are worth checking. The amount of time between the withdrawal and a previous deposit of asimilar amount.
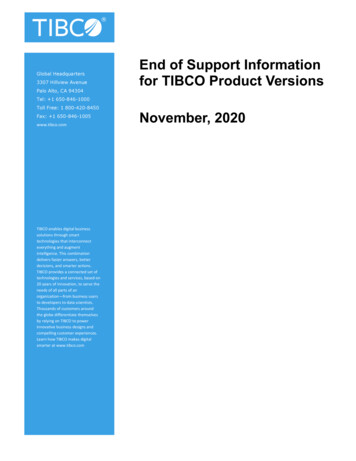
WHITEPAPER 5 The value of the withdrawal as a proportion of the value of the previous deposit. The value of the withdrawal as a proportion of the mean withdrawal ofcustomers who share similar characteristics (gender, age, income, etc.) or ofcompanies in the same economic sector, size, and region. Whether the account owner has a family relationship with one of the bankstaff, etc.Many of these features are gathered and monitored with systems such asActimize, but are treated with individual, and not mathematically optimized,thresholds. Mathematical models can combine all features optimally.A different set of features would be used for finding fraud in medical insuranceclaims. Imagine an insurance policy that covers 100% of all emergency claims. Anobvious fraud for this policy is to declare routine procedures as emergency. Theincentive for this potential fraudulent behavior is specific to the set-up of thisparticular insurance policy. This is why your business people, who understand theterms of your different policies, will know best what would be unusual and potentiallyfraudulent behavior. A conversation with the database administrators is all they needin order to derive the optimal SQL that helps grasp the relevant features. Relevantfeatures for this policy might be: Total number and proportion of emergencies by doctor / clinic / patient Time between an emergency appointment and the purchase of theprescribed medicine Time between emergencies per patient and per familyWhen features have been crystallized into SQL, Spotfire can collect this datastraight from the relevant datasource and visually portray how transactionsbehave. For example, on the left hand chart of Figure 4, it’s easy to spot oddbehavior. In Spotfire you can select the people or transactions that display theoddest behavior and list them. A quick investigation of a few cases will provide abetter feel for the usefulness of the features in detecting criminal activity.If historic data already contains the information on which transactions werefraudulent or non-fraudulent, this knowledge can inform the search for fraudrevealing features. On the right hand chart of Figure 4, a zoomed-in box plot showsthat transactions with higher value have also been more likely to be fraudulent.Network charts provide another rich source of insight to identify people whohave a big impact on the network as a whole, for example, people or organizationsreceiving a large amount of cash deposits from many different people.Figure 4 Visual analysis of AML related features with no past knowledge aboutwhich were fraudulent. The left visualization is deceivingly powerful and plots thenumber of credit card transactions from all users in the last 24 hours. It showsthat the majority of people have very stable behavior (around 0), with just a fewusers showing unusual values that would merit investigation. The right shows adistribution of selected variables by status showing that higher value transactionsare more often fraudulent.
WHITEPAPER 6STREAMING ANALYTICSTIBCO’s streaming analyticssolutions allow you to capture,aggregate, and analyze real-timeand historical data of any variety,volume, and velocity to gaincontextual awareness and actpreemptively. Our technologiessupply the ability to: Understand historicalpatterns and dynamicevent sequencesOne does not necessarily need to visualize every feature, however. Especially forbig data containing many features, it may be impossible to visualize them oneby one. The results of the supervised model can guide the search for the mostrelevant features for spotting fraudulent activity. We should then visualize theseindividually. Figure 5 shows which features have a higher contribution to themodel (the longer the bar, the more important the feature). Although Figure4 showed that “Value” (eighth in rank) is important, other features are morepowerful at distinguishing fraudulent transactions. Anticipate by monitoringall event streams, filteringfor certain sources orqualities, correlating inreal time, and detectingmeaningful patterns Act by first testing measuresof event significance, thensetting business rules thatdrive action, which couldinclude creating new eventsto be fed back into thesystem for discovery While capabilities varybased on goals andrequirements, our best-inclass technologies rapidlycapture, analyze, and act onany complex combination ofevents in real time:TIBCO BusinessEvents TIBCO StreamBase Figure 5 Visualizing the contribution of different predictors used in a model.A combination of visualizing the ranking of the features as well as the detail of theindividual features is important for a number of reasons:1 Validation of the model’s quality. Maybe your best feature is so good becauseit is part of the answer and should therefore be excluded. For example, if youinadvertently included the total value of fraud that was stopped as a predictor,that will obviously (and erroneously) appear as the best predictor.2 Correlation is not causation. It is necessary to ask questions that lead to abetter understanding of the reality being predicted.3 Validation of the data’s quality. Were you expecting a different feature tohave more power than what is showing? Perhaps there are data quality issuescausing a lack of relevance, or maybe outliers introduced a bias. These qualityissues can be quickly spotted in a visualization.4 Surprising top features. Sometimes predictors expected to be irrelevant turnout to have huge predictive ability. This knowledge, when shared with thebusiness, will inevitably lead to better decisions.5 Inspiration for new features. Sometimes the most informative features are thereason to delve into new related information as a source of other rich features.6 Computational efficiency. Features with very low predictive power shouldbe removed from the model as long as the prediction accuracy on the testdataset stays high. This ensures a more lightweight model with a higher degreeof freedom, better interpretability, and potentially faster calculations whenapplying it to current data, in batch or real time.
WHITEPAPER 7BUSINESS PROCESSMANAGEMENTYour processes should conformto your business requirements,not to your system capabilities.TIBCO’s completely modeldriven business processplatform provides the completespectrum of business processstyles as well as unprecedentedscalability and performanceto handle all of your businessprocess needs: Use a model-drivenenvironment to speed andsimplify process design,shielding implementationcomplexity with afast, collaborative, anditerative approach Work with any processstyle: human and systemintegration processes,human workflows, dynamicand event-driven processes,case management, to-dolists, or approval processesin a single platform Alleviate IT involvementin day-to-day changes.Business users can adjustand change their operationsimmediately to takeadvantage of opportunitiesor avoid threats Rely on a native integrationfoundation for true businessdigitalization, allowing yourdata, people, processes,systems and things tobe easily and seamlesslybrought together to supportall your business initiativesTIBCO ActiveMatrix BPMHAVE YOUR MODELS, NOW WHAT?Once business users have created and tested the new models that efficientlyspot potentially fraudulent transactions; They can use Spotfire as an interfaceto manage how the models will be deployed. The models allow boiling allincoming predictors into two measurements: fraudulence and abnormality. It isnow time to set adequate thresholds for them. Embedded what-if analysis in theSpotfire template allows setting thresholds for the two metrics and balancingthe expected number of alerts with the size of your investigative team. Noticethat these two metrics are machine-learning optimized to combine all incomingpredictors in the best possible way.HOW TIBCO DEPLOYS MODELS IN REAL TIMEBecause a model is a summary of historic data, it can be as light as an equationand live beyond the data. Once the user is satisfied with the quality of the modeland the respective thresholds, a press of a button in the Spotfire template isall that’s required to send that model to the real-time event processing enginethat will monitor transactions as they occur. TERR, TIBCO’s statistics engine, hasexcellent integration with all of TIBCO’s streaming analytics products to supportthis automated capability.REDUCING INVESTIGATION TIMEHow does TIBCO propose dealing with the second biggest flaw in current frauddetection systems: the fact that each alert takes too long to investigate?TIBCO’s streaming analytics software sits elegantly in the background. Itseamlessly receives models updated from Spotfire and uses these to score inreal-time every single transaction for its probability of fraud and abnormality. InTIBCO’s Fraud Accelerator, a TIBCO StreamBase workflow receives the model(s)and threshold(s) from Spotfire. It keeps track of model versioning, applies themodel to the streams of transactions in real time, separates those that exceed therespective thresholds, and for each of these alerts creates a new case in TIBCO’sBusiness Process Management tool (BPM). StreamBase also collates the contextof each alert from any number of data sources using Spotfire and sends anemail to investigators warning them a new potentially fraudulent transaction hasbeen spotted. It also sends all output data to TIBCO Live Datamart and TIBCOLiveView , which allows visualizing the flow in real time.Figure 6 provides an example of an automatically generated email report. Itincludes the ID of the transaction, a link to the respective investigative template,the scores for probability of it being like past fraud and for its degree of oddity,the respective thresholds, and the model versions that generated the scores. Italso includes two links:1 To a new Spotfire instance, shown in Figure 7, which contains all the relevantcontext regarding the specific transaction—including data gathered fromavailable data sources about all
platform, including TIBCO StreamBase and TIBCO BusinessEvents streaming analytics for real-time predictive model scoring Deployable in big data environments (such as Apache Hadoop and Spark ) and in grids (via TIBCO GridServer ) for fast, advanced analysis of big data Free