Transcription
#RetireFitRetirement ReadinessBootcamp 2017March 11, 2017
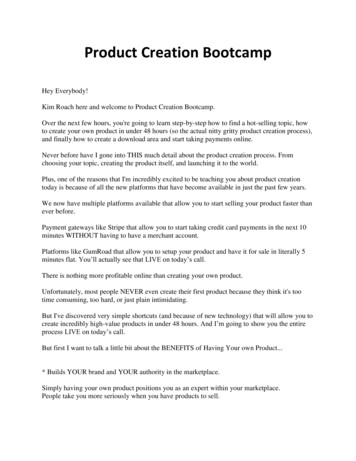
Data through February 28, 2017 FINRA members: For internal or institutional use only.BerwynTickerBERWXBenchmark 1: Russell 2000 TR USDBenchmark 2: S&P 500 TR USDHistorical ProfileReturnRiskRatingMorningstar Analyst Rating 12-15-16 6Below AvgAverageQQBelow Avg663Yield0.0%63Total Assets 125 mil620.015.0Morningstar evaluates mutual funds based on five key pillars, which itsanalysts believe lead to funds that are more likely to outperform over thelong term on a risk-adjusted basis.Analyst Rating Spectrum„ ‰ÁPillar Spectrum Positive§ Negative¶ NeutralPerformance 02-28-1720122013201420152016Trailing3 Mo6 Mo1 Yr3 Yr Avg5 Yr Avg10 Yr Avg15 Yr AvgTax Analysis1st Qtr2nd Qtr3rd Qtr4th 6735.58-4.62-14.4129.39Total /- Bmark /- 0.69-5.39-6.06-4.52-0.980.43%Rank Growth ofCat 3110,06211,19213,07210,26414,94618,31438,268Tax Adj Rtn% %Rank Cat Tax-Cost Rat %Rank Cat3 Yr (estimated)5 Yr (estimated)10 Yr tential Capital Gain Exposure: 14% of assetsWeb Address:Inception:Advisor:Subadvisor:Investment Values ofFundInvestment Values ofBenchmark 1INVESTMENT MANAGERS SERIES TRUSTMilwaukee, DE 84Chartwell Investment Partners, LLCNone* & ( ( & & ( ) ) & )Performance Quartile(within 0.003.641.33-0.3913132Rating and RiskTimePeriodMorningstarRtn vs Cat30.720.878.376.249.76LowLowAvgOther MeasuresAlphaBetaR-SquaredStandard DeviationMeanSharpe RatioMorningstar MorningstarRisk vs Cat Risk-Adj RatingAvg QAvg QAvg QQStandard IndexBest Fit Index-7.80.9140-6.20.888214.870.870.12This provides some solace, but the drop in assetsleaves Grout, who became the lead manager in January,somewhat resource-constrained. Although Killen alsosigned a three-year contract, he has stepped back fromthis fund, keeping his focus on sibling BerwynCornerstone BERCX. The rest of the team, includingcomanagers George Cipolloni and Mark Saylor, as well asanalyst Peter Toscani, is focused on 1.7 billion siblingBerwyn Income BERIX. Grout is on his own, but he iscertainly a capable investor and has the experience tolead the fund. He has been a comanager here for nearly14 years and joined the team nearly 20 years ago. Still,he would benefit from additional research support. Thebest hope for this would be asset growth. A top-decileyear-to-date return doesn't hurt, and Chartwell'sdistribution could cultivate inflows. In the meantime, thefund has a good manager at the helm.Minimum Purchase:Min Auto Inv Plan:Sales Fees:Management Fee:Actual Fees:Expense Projections:Income 00.125NAVTotal Return % /- Bmark 1 /- Bmark 2Income Return %Capital Return %Total Rtn % Rank CatIncome Capital Gains Expense Ratio %Income Ratio %Turnover Rate %Net Assets milPortfolio Analysis 10-31-16Load-AdjReturn %1 Yr3 Yr5 Yr10 YrIncept02-17 1000Add: 100 1000Add: 100No-load, 1.00%R1.00% mx./0.90% mn.Mgt:1.00% Dist:—3Yr: 395 5Yr:—AnnuallyIRA: 1000Total Stocks: 40Share change since 07-31-16SectorRFidelity Inst Govt PortfoYHallmark Financial ServicYHallador Energy CoYNavigant Consulting IncYKMG Chemicals IncYVonage Holdings CorpYMercury Systems IncYRudolph Technologies IncYLandec CorpYACCO Brands CorpYGraham CorpYGranite Construction IncYStillwater Mining CoYHooker Furniture CorpYDeltic Timber CorpTScanSource IncTAshford Hospitality TrustYSpartan Motors IncYDime Community BancsharesYPlexus Corp—Finan SvcsBasic MatIndustrlBasic MatComm SvcsTechnologyTechnologyCnsmr DefIndustrlIndustrlIndustrlBasic MatCnsmr CycBasic MatTechnologyReal EstIndustrlFinan SvcsTechnologyCurrent Investment StyleMarket CapValue Blend Growth 2017 Morningstar. All Rights Reserved. The data and analyses herein does not constitute investment advice; is provided solely for informationalpurposes; is not an offer to buy/sell a security; and is not warranted to be correct, complete or accurate. Morningstar is not responsible for any tradingdecisions, damages or losses resulting from, or related to, the data and analyses or their use.SectorWeightingsGiant0.0 h CyclicalLarge0.0 r BasicMatMid0.0 t CnsmrCycSmall18.9 y FinanSvcsMicro81.1 u Real EstAvg mil:j Sensitive602i CommSrvsValue MeasuresRel Category o EnergyPrice/Earnings18.150.93 p IndustrlPrice/Book1.210.60 a TechnlgyPrice/Sales0.720.63 k DefensivePrice/Cash Flow4.540.57s CnsmrDefDividend Yield % 0.980.63d HlthcareGrowth Measures% Rel Category f UtilitiesLong-Term Erngs 8.200.72Book Value3.050.91 Composition - NetSales2.232.70Cash Flow26.554.44Historical Erngs7.931.58Profitability10Yr:—%Large Mid SmallMorningstar's Take by Kevin McDevitt, CFA 12-15-16The sale of its advisor could help, but at this moment,Berwyn's declining assets are starting to hurt. With ahigher expense ratio and limited resources, we'vedowngraded the fund's Morningstar Analyst Rating toBronze from Silver.Chartwell Investment Partners bought this fund’sadvisor, The Killen Group, in April 2016. The sale providedan exit for founder Bob Killen and locked comanager LeeGrout into a three-year employment contract. Moreimportantly, the Killen team retains its autonomy withinChartwell while also freeing them from operational duties.Chartwell could provide some stability as the fundfeels the pinch from a shrinking asset base. Largelybecause of 350 million in estimated outflows during thepast three years, the fund's assets have dropped to just 140 million from a peak of 518 million in December2013. Partly as a result, the fund's expense ratio rose 6basis points in 2015 to 1.22%, 3 basis points greater thanthe small-cap no-load group median. However, even ifassets continue to decline, Chartwell added a fee waiverthat will keep the expense ratio capped at its current levelthrough April 2018.Address:Growth of 10,00010.0 Positive Positive Positive Positive§ NegativeMorningstar Analyst RatingŒInvestment StyleEquity6Morningstar PillarsProcessPerformancePeopleParentPriceMstar CategorySmall Blend%Return on EquityReturn on AssetsNet Marginß5.732.813.12 Mutual FundsYTD Ret %% 2.672.612.602.342.342.312.312.272.24% ofStocksRelBmark .000.301.000.190.00Cash15.0Stocks 85.0Bonds0.0Other0.1Foreign 3.2(% of Stock)A
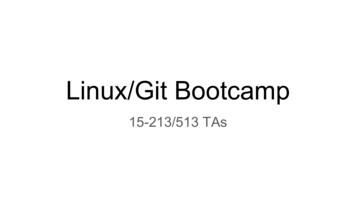
Data through February 28, 2017 FINRA members: For internal or institutional use only.Baird Short-Term Bond InstBenchmark 1: BBgBarc US Govt/Credit 1-5 Yr TR USDBenchmark 2: BBgBarc US Agg Bond TR USDTickerBSBIXHistorical ProfileReturnRiskRatingMorningstar Analyst Rating 03-09-16„2Above AvgAverageQQQQAbove Avg222Yield1.6%SEC Yield1.66%22Total Assets 4,267 mil214.013.0 Positive Positive Positive Positive Positive10.0Morningstar evaluates mutual funds based on five key pillars, which itsanalysts believe lead to funds that are more likely to outperform over thelong term on a risk-adjusted basis.Analyst Rating Spectrum ‰ÁPillar Spectrum§ Negative¶ NeutralPerformance 02-28-1720122013201420152016Trailing1st Qtr2nd Qtr3rd Qtr4th 1.490.892.25Total /- Bmark /- 12.251.471.842.80—Tax AnalysisTax Adj Rtn% %Rank Cat Tax-Cost Rat %Rank k Growth ofCat 10,0003 Mo6 Mo1 Yr3 Yr Avg5 Yr Avg10 Yr Avg15 Yr Avg3 Yr (estimated)5 Yr (estimated)10 Yr 10,02110,22510,44710,95613,186—596471Potential Capital Gain Exposure: 0% of assetsWeb Address:Inception:Advisor:Subadvisor:Baird Funds IncMilwaukee, WI 53202866-442-2473www.bairdfunds.com08-31-04Robert W. Baird & Co. IncorporatedNone& * ( * * * & & & * (Performance Quartile(within ng and RiskTimePeriodMorningstarRtn vs Cat2.251.471.842.802.86 Avg AvgAvgOther MeasuresMorningstar MorningstarRisk vs Cat Risk-Adj RatingAvg QQQQ-Avg QQQQAvg QQQStandard IndexBest Fit IndexAlphaBetaR-Squared0.70.25700.60.7781Standard DeviationMeanSharpe Ratio0.891.471.46as a lower allocation to non-investment-grade ornonrated securities than its average category peer.Management tends to take a duration-neutral stancerelative to its bogy but makes active bets on sector, yieldcurve, and individual security selection. Over the life ofthe strategy, the fund has maintained a persistentoverweighting to credit and underweighting to Treasuriesand government-related securities. As of early 2016, thecredit allocation occupied 68% of the portfolio--aroundthe middle of its historical allocation range.The fund’s historical performance is solid. Over thetrailing five years ended February 2016, the portfoliogenerated 2% of annualized return, ahead of the indexand better than 80% of its category peers. Low volatilityand rock-bottom fees further contribute to this fund’sconsistent performance and risk-conscious appeal.NAVTotal Return % /- Bmark 1 /- Bmark 2Income Return %Capital Return %Total Rtn % Rank CatIncome Capital Gains Expense Ratio %Income Ratio %Turnover Rate %Net Assets mil 25000Add: — 25000Add: —No-load0.25%, 0.05%AMgt:0.25% Dist:—3Yr: 975Yr: 169MonthlyIRA: 2500010Yr: 381 2017 Morningstar. All Rights Reserved. The data and analyses herein does not constitute investment advice; is provided solely for informationalpurposes; is not an offer to buy/sell a security; and is not warranted to be correct, complete or accurate. Morningstar is not responsible for any tradingdecisions, damages or losses resulting from, or related to, the data and analyses or their use.Date ofMaturityAmount 000Value 0.500.490.490.490.480.480.470.470.460.460.46Total Fixed Income: 538US Treasury Note 2.625%US Treasury Note 1.375%US Treasury Note 2%FNMA CMO 1.513%FNMA CMO 1.626%California Rep Auto RecCf Inds 6.875%Kubota Cr Owner Tr 2015CIBC 1.6%Erac Usa Fin Company 14Diamond 1 Fin Corp/DiamDiscover Card Exe Tr 20Merc-Benz Auto Lease TrBanque Fed Du Cred MutuKeysight Tech 3.3%Ford Cr Auto Own Tr 201Keb Hana Bk 144A 1.75%Dollar Gen Corp New 4.1Ing U S 2.9%Protective Life GlobalCurrent Investment StyleSector BreakdownDurationLtd Mod ExtGovernmentGovernment RelatedCorporateAgency MBSNon-Agency Residential MBSCommercial MBSCovered BondAsset BackedMunicipalCash & EquivalentsOther1figure provided byfund1.9 Yrs2.0 YrsA2.81%101.44% of parAvg Eff Duration1Avg Eff MaturityAvg Credit QualityAvg Wtd CouponAvg Wtd Price% Assets15057312012370% of Bonds Composition - NetCoupon RangeMinimum Purchase:Min Auto Inv Plan:Sales Fees:Management Fee:Actual Fees:Expense Projections:Income 4,157Portfolio Analysis 12-31-16Load-AdjReturn %1 Yr3 Yr5 Yr10 YrIncept02-17QualityHigh Med LowMorningstar's Take by Emory Zink 03-09-16While Baird Short-Term Bond inhabits a well-troddeninvestment-grade landscape, management’s experienceand low fees have given the fund an edge, deliveringconsistent return to investors and earning this fund aMorningstar Analyst Rating of Silver.Mary Ellen Stanek helms a team of six named coportfolio managers who average 32 years of experiencein the industry and have contributed to this strategy fromits inception in 2004. The team is rounded out with fiveadditional senior portfolio managers and four analysts.Although this is fewer in number than many larger firmswith comparable funds, Stanek and her support counterthis by sticking to sectors and investments that they canthoroughly research with the fund’s given resources.It is not only the firm’s leadership that has remainedstalwart--the process is consistent as well. Similar tomany of its short-term bond Morningstar Category peers,the team invests in a mix of corporates, mortgages, andTreasuries, and it benchmarks itself against the BarclaysU.S. Government/Credit 1-3 Year Index. Emphasis is onhigher-quality holdings, and the fund tends to have ahigher allocation to A and BBB rated securities, as wellAddress:Investment Values ofFundInvestment Values ofBenchmark 111.0Morningstar Analyst Rating PositiveGrowth of vestment StyleFixed Income2Morningstar PillarsŒMstar CategoryShort-Term Bond0% PIK0% to 4%4% to 6%6% to 8%8% to 10%More than 10%0.082.28.66.32.90.0Credit Analysis% bonds 12-31-16AAAAAABBBBBBBelow BNot Rated32122728ß CashStocks7.10.0BondsOther92.90.0Special SecuritiesRestricted/Illiquid SecsEmerging-Markets SecsOptions/Futures/Warrants1000Mutual FundsD2310
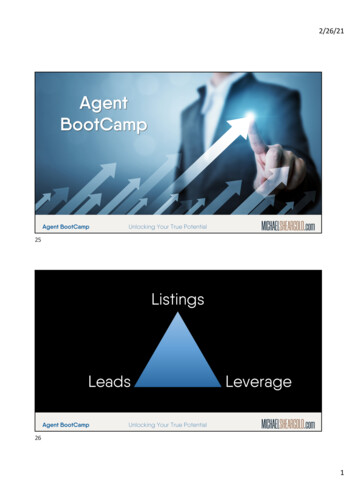
Data through February 28, 2017 FINRA members: For internal or institutional use only.American Funds Capital Income Bldr ABenchmark 1: Morningstar Gbl Allocation TR USDBenchmark 2: Morningstar Mod Tgt Risk TR USDHistorical ProfileReturnRiskRatingMorningstar Analyst Rating 07-08-16„TickerCAIBX1Above AvgAverageQQQQAbove Avg111Yield3.4%1Total Assets 102,404 mil1116.014.012.010.0 Positive Positive Positive Positive star evaluates mutual funds based on five key pillars, which itsanalysts believe lead to funds that are more likely to outperform over thelong term on a risk-adjusted basis.Analyst Rating Spectrum ‰ÁPillar Spectrum Positive§ Negative¶ NeutralPerformance 02-28-1720122013201420152016Trailing3 Mo6 Mo1 Yr3 Yr Avg5 Yr Avg10 Yr Avg15 Yr AvgTax Analysis1st Qtr2nd Qtr3rd Qtr4th .906.61-2.926.90Total /- Bmark /- 63-1.920.651.09-0.52—%Rank Growth ofCat 310,58710,25811,25011,33314,10215,36228,302Tax Adj Rtn% %Rank Cat Tax-Cost Rat %Rank Cat3 Yr (estimated)5 Yr (estimated)10 Yr ential Capital Gain Exposure: 14% of assetsWeb Address:Inception:Advisor:Subadvisor:Investment Values ofFundInvestment Values ofBenchmark 1Capital Income Builder IncLos Angeles CA tal Research and Management CompanyNone* * ( ( & * * & * * (Performance Quartile(within .50-0.52-0.170.003.50520.000.00.69,953NAVTotal Return % /- Bmark 1 /- Bmark 2Income Return %Capital Return %Total Rtn % Rank CatIncome Capital Gains Expense Ratio %Income Ratio %Turnover Rate %Net Assets milRating and RiskTimePeriodPortfolio Analysis 12-31-16Load-AdjReturn %MorningstarRtn vs Cat6.032.225.863.779.03HighHighAvg1 Yr3 Yr5 Yr10 YrInceptOther MeasuresMorningstar MorningstarRisk vs Cat Risk-Adj RatingAvg QQQQQAvg QQQQQAvg QQQStandard IndexBest Fit d DeviationMeanSharpe Ratio7.864.260.55peers and higher than the MSCI All-Country World HighDividend Yield Index's 13.1%.The equity managers, however, look for less interestrate-sensitive dividend growers, too. For example, sinceentering the portfolio in late 2012, current top-five holdingAmgen AMGN has nearly tripled its quarterly dividend to 1 per share. Plus, they’re talented and veteran stockpickers. American's multimanager system of separatelyrun portfolio sleeves allows them to play to their strengthsand damps volatility. The fund's conservative bondportfolio also helps in that regard. It has largely avoidedjunk bonds in recent years and serves as ballast.Even as the fund's asset mix between stocks andbonds has shifted considerably during the past decade,outperformance has been consistent. The fund hasbeaten its typical rival in seven of the past 10 calendaryears on its way to a top-quartile 5.5% 10-year returnthrough June 2016. Over the long haul, the fund shouldcontinue to reward investors for its risks.Minimum Purchase:Min Auto Inv Plan:Sales Fees:Management Fee:Actual Fees:Expense Projections:Income Distribution: 250Add: 50IRA: 25 50Add: 505.75%L0.24% mx./0.11% mn., 0.01%AMgt:0.23% Dist:0.24%3Yr: 756 5Yr: 89110Yr: 1282Quarterly 2017 Morningstar. All Rights Reserved. The data and analyses herein does not constitute investment advice; is provided solely for informationalpurposes; is not an offer to buy/sell a security; and is not warranted to be correct, complete or accurate. Morningstar is not responsible for any tradingdecisions, damages or losses resulting from, or related to, the data and analyses or their use.Total Stocks: 228Share change since 09-30-16SectorCountryYPhilip Morris InternationYVerizon Communications InYAbbVie IncYAltria Group IncYNational Grid PLCYCoca-Cola CoTCrown Castle InternationaTImperial Brands PLCYAT&T IncTExxon Mobil CorpYSSE PLCTNovartis AGTSampo Oyj AYAmgen IncLockheed Martin CorpTRoyal Dutch Shell PLC BTReynolds American IncYChevron CorpYDominion Resources IncSingapore TelecommunicatiCnsmr DefComm SvcsHlth CareCnsmr DefUtilitiesCnsmr DefComm SvcsCnsmr DefComm SvcsEnergyUtilitiesHlth CareFinan SvcsHlth CareIndustrlEnergyCnsmr DefEnergyUtilitiesComm SvcsUnited StatesUnited StatesUnited StatesUnited StatesUnited KingdomUnited StatesUnited StatesUnited KingdomUnited StatesUnited StatesUnited KingdomSwitzerlandFinlandUnited StatesUnited StatesUnited KingdomUnited StatesUnited StatesUnited 21.491.451.431.431.401.341.341.271.191.121.01% ofStocksRelBmark 1Current Investment StyleMarket CapValue Blend Growth%SectorWeightings% AssetsGiant62.0 h Cyclical23.150.56Large28.3 r BasicMat1.960.31Mid8.8 t CnsmrCyc6.110.52Small0.7 y FinanSvcs11.570.61Micro0.2 u Real Est3.510.78Avg mil:j Sensitive38.351.0756,783i CommSrvs12.763.35Value MeasuresRel Category o Energy10.881.75Price/Earni
this fund, keeping his focus on sibling Berwyn Cornerstone BERCX. The rest of the team, including comanagers George Cipolloni and Mark Saylor, as well as analyst Peter Toscani, is focused on 1.7 billion sibling Berwyn Income BERIX. Grout is on his own, but he is certainly a capable investor