Transcription
The Risk/Reward Properties of BullSpreadsBull Spreads are versatile instruments. They can be used to trade direction, totrade volatility or, in conjunction with conventional products, as a short term riskmitigation tool.In all these uses, the key Bull Spread advantages apply – a low amount of collateralis typically required, and your risk is strictly capped without the danger of youbeing stopped out by a temporary adverse move. This means it is often possible touse Bull Spreads to enhance your Return on Risk and Return on Capital Employedover a short term trading horizon.In this presentation we will compare the risk/reward properties of Bull Spreadswith the risk/reward properties of trading the underlying, where risk is managed inthe underlying by the use of a stop order.Futures trading and options trading involve risk, which may result in financial loss, and are not suitable for everyone.Any trading decisions that you may make are solely your responsibility. The trading activity and other informationpresented herein are for informational purposes only. The contents hereof are not an offer, or a solicitation of anoffer, to buy or sell any particular financial instrument offered on Nadex.
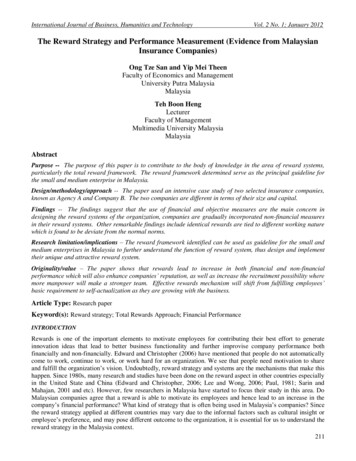
An example network of Bull Spreads: Spot E/ The chart below shows a typical pattern of Bull Spread contracts on the E/ spot rate. For E/ , contracts are available with tenors of oneday, 8 hours and 2 hours (overlapping each hour). This means there are 10 potential contracts available at any given time. The contractsare created throughout the day, centered on where the underlying is at the time of creation, so there are almost always contracts withfloors and ceilings close to the latest level of the underlying.The chart below shows the floor and ceiling levels for 7 of the contracts available on E/ at 7am ET on a hypothetical day (we’ve left outthe 6am-8am set of contracts, for clarity).Daily Ceiling7am-3pm Ceiling14300142807am-3pm Ceiling141557am-9am Ceiling141207am-9am 007am-3pm Ceiling7am-3pm Floor7am-9am Ceiling7am-9am Floor5am6amSpot E/ 7am8am7am-9am Floor9am10am11am7am-9am Floor7am-3pm Floor7am-3pm FloorDaily Floor12pm1pm2pm3pm
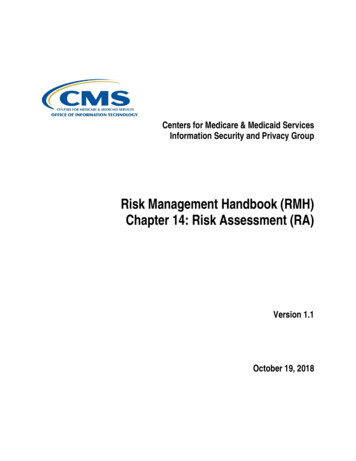
Zooming in:7am-3pm Ceiling141557am-9am Ceiling141207am-9am Ceiling14070140307am-9am Ceiling14020140007am-9am Floor6am5am1397013920139057am-3pm Ceiling7am-3pm Floor7am8am9amIf the trader has a view that is smallscale and short term, (that is,he/she is expecting a trade durationof less than a couple of hours with aprofit target of less than 100 pips),the 7am-9am contracts (in green,here) may offer the most attractivetrading opportunities.If the trader has a view going out tothe end of the trading day (3pm ET),or is targeting a bigger marketmove, then the wider 7am-3pm BullSpreads (in blue, here) may be themost appropriate.7am-9am FloorSpotE/ Zooming in, we can see whichcontracts might be of interest to aspot E/ trader.7am-9am Floor7am-3pm Floor
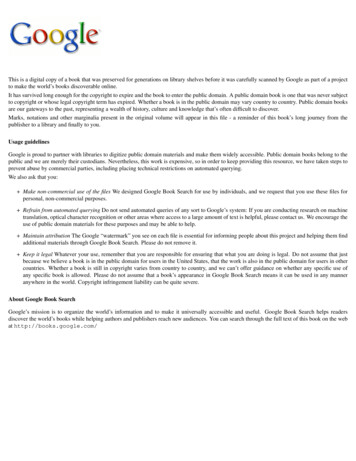
7am-9am contracts:Let’s assume we have a very short term trading horizon,and focus on the 7am-9am contracts.7am-9am 14020-14120141207am-9am 13970-14070Spot E/ trading at14017140707am-9am 13920-14020140201400013970There are three. The highest, shown in red here, has aFloor roughly where the current market is, and a Ceiling100 points higher. It is priced around 10 pips higher thanthe spot rate. This is because any buyers of the contractwould gain the benefit of a nearby Floor that would captheir risk but never stop them out.7am-9am 14020-141205am6am7amSpotE/ 8am9am7am-9am 13970-14070139207am-9am 13920-14020ContractEUR/USD 14020-14120 (9am)EUR/USD 13970-14070 (9am)EUR/USD 13920-14020 (9am)Bid fer Size604045The lowest, shown in blue here, has a Ceiling roughlywhere the current market is. It is priced around 7 pipslower than the spot rate. This is because any sellers ofthe contract would gain the benefit of the nearby Ceilingthat would cap their risk but never stop them out.The middle contract, shown in green here, is centered onthe current spot rate and trades almost exactly at thatrate – it has no nearby Floor or Ceiling to introduceoptionality into its price.Note that these prices assume average volatility for E/ and that no major announcements are expected. If, forexample, Nonfarm Payrolls were about to be announcedat 8.30am, it is likely that Nadex participants would placea higher value on the protection offered by Bull SpreadFloors and Ceilings. In that scenario it is likely that thetop and bottom contracts would trade further from thespot rate than the 7-10 pips seen here.Bull Spread trades above spot rate when spot rate is close to floorBull Spread trades at or close to spot rate in middle of rangeBull Spread trades below spot rate when spot rate is close to ceiling
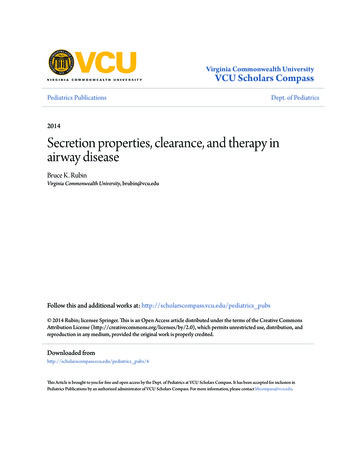
EUR/USD 13920-14020 (9am):Now let’s assume we have a view that the E/ ,having met resistance, is about to start trackingdownwards. One way to trade this move in alimited risk way would be to sell the spot at14017 and place a stop at some key level like,say, 14050. This caps risk at 33 pips in mostcases (although if the market makes a surprisejump upward, gapping through our stop level,the biggest potential loss could be worse,possibly much worse, than this).Spot E/ trading at14017140007am-9am 13920-14020Bull Spreadbid at 14009140205am6am7am8amSpotE/ 139207am-9am 13920-14020ContractBid SizeBidOfferOffer SizeEUR/USD 14020-14120 (9am)50140261402860EUR/USD 13970-14070 (9am)55140161401840EUR/USD 13920-14020 (9am)35140091401145Maximumrisk: 11 pipsAnother way to take this view is to short the13920-14020 Bull Spread, shown here in blue.The risk here would be capped at just 11 pips in9amall circumstances – the Bull Spread cannotsettle, or be priced, any higher than its CeilingMaximumprofit: 89 pips level of 14020 at any point, regardless ofgapping in the market. And the risk cap herehas the quality of an option; in other words,the underlying market may temporarily gothrough the level of the Ceiling withoutstopping out our position – we could still profitif we’re proven right later on in the life of thecontract.The price for this is that we are selling 8 pipsbelow the spot rate and we are accepting a capon our highest possible profit – just as thecontract cannot settle above 14020, neithercan it settle below 13920. So we are risking anabsolute worst case loss of 11 pips to make aprofit that can never be higher than 89 pips.
Scenario 1: We are wrong in our viewNow let’s roll the clock forward in a hypothetical world where we were wrong about the E/ . In this world, the E/ travels thoroughthe 14050 stop level at 8.05am; had we been short the spot E/ with a stop at 14050 we would have seen our position close at thispoint for a loss of 33 pips. Our Bull Spread would remain live until expiration at 9am, when it would settle at a value of 14020; a loss tous of only 11 pips.Spot E/ entry levelat 1401714000Stop at 140507am-9am 13920-14020Bull Spread entrylevel at 14009140205am6amSpot trade stoppedout at 8.05am at14050, for a loss of33 pips7am8amSpotE/ 139207am-9am 13920-14020Bull Spread expiresat 9am at 14020,for a loss of 11 pips9am
Scenario 1: We are wrong in our viewHere’s what this would look like in terms of P&L. These numbers have assumed we have traded in the same -per-pip size in each case: 1standard lot (E100,000) of E/ , or 10 lots of the Nadex Bull Spread. In either case, our exposure per pip (of spot E/ ) or per point (of the BullSpread) would be 10.We can see that the Bull Spread strategy cost us only one third of the losses we would have experienced trading the spot with a 33 pip stop.We can also see that the Bull Spread strategy required only about 4% of the capital required to establish the spot position, assuming spot FXis margined at 2% ( 110 vs. 2803.40). This has the effect of hugely magnifying our (negative) Return on Capital, from -12% to -100%. But,in absolute dollar terms, we only lost one third as much.Spot FX margin required (1 standard lot)Bull Spread collateral required (10 lots) 2,803.40 110.00Spot FX risk (USD, assuming no slippage)Bull Spread risk (USD) 330.00 110.00Spot FX P&L (pips)Spot FX P&L (USD)Bull Spread P&L (points)Bull Spread P&L (USD)-33- 330.00-11- 110.00Return on Capital Employed (spot FX)Return on Capital Employed (Bull Spread)-12%-100%Return on Risk (spot FX, assuming no slippage)Return on Risk (Bull Spread)-100%-100%Example does not include fees and commissions, which may vary by broker
Scenario 2: We are immediately correct with our viewNow let’s look at another scenario. This time, let’s assume we were right – the E/ is unable to break through resistance around the 14020level and falls back by 70 pips or so over the following 2 hours. This time we take profits when the spot hits 13950. The Bull Spread canalso be bought back at 13950 at this point (we are not particularly close to a Floor or Ceiling, and very little time is left until expiration, sothe Bull Spread trades at the same price as the spot rate).Spot E/ entry levelat 140177am-9am 13920-14020Bull Spread entrylevel at 140091402014000Stop at 140505am6am7am8amBull Spread exitlevel of 13950, fora profit of 59 pipsSpot trade exitlevel of 13950, fora profit of 67 pipsSpotE/ 139209am7am-9am 13920-14020
Scenario 2: We are immediately correct with our viewComparing the numbers, we can see that the Bull Spread strategy has made less than the simple spot trading strategy in absolute dollarterms, because we paid for option-like risk insurance that, in this case, wasn’t needed.Again though, we can see the effect of the very low collateral requirements of Bull Spreads at work. Because we only had to put 110 downto establish the Bull Spread position (rather than the 2800 necessary to trade the spot), our return on capital was enormously magnified,coming to 536% rather than 24%.Spot FX margin required (1 standard lot)Bull Spread collateral required (10 lots) 2,803.40 110.00Spot FX risk (USD, assuming no slippage)Bull Spread risk (USD) 330.00 110.00Spot FX P&L (pips)Spot FX P&L (USD)Bull Spread P&L (points)Bull Spread P&L (USD)67 670.0059 590.00Return on Capital Employed (spot FX)Return on Capital Employed (Bull Spread)24%536%Return on Risk (spot FX, assuming no slippage)Return on Risk (Bull Spread)203%536%Example does not include fees and commissions, which may vary by broker
Scenario 3: We are right, but face an intermediate adverse moveThis time consider a scenario where the option-like nature of the Bull Spread contract’s Ceiling level is at its most valuable. Here ourposition moves significantly against us before coming good. And in this hypothetical example, the adverse move is enough to trigger thestop on spot E/ , locking in a loss on the spot E/ trade of 33 pips. The Bull Spread position survives, however, and we are able to close itout later at a level of 13950, for a profit of 59 pips.Spot E/ entry levelat 1401714000Stop at 140507am-9am 13920-14020Bull Spread entrylevel at 14009140205am6amSpot trade stoppedout at 14050, for aloss of 33 pips7am8amBull Spread exitlevel of 13950, fora profit of 59 pipsSpotE/ 139209am7am-9am 13920-14020
Scenario 3: We are right, but face an intermediate adverse moveAnd here are the numbers – a huge difference in outcome.This is the kind of result that explains why stop orders are free, but options cost money. Or, to put it another way, why Bull Spread pricesdiverge from the underlying market level when the underlying is close to the Bull Spread’s Floor or Ceiling. This divergence in price is areflection of optionality in the contracts, and it is only optionality that can control risk without stopping a trader out.Spot FX margin required (1 standard lot)Bull Spread collateral required (10 lots) 2,803.40 110.00Spot FX risk (USD, assuming no slippage)Bull Spread risk (USD) 330.00 110.00Spot FX P&L (pips)Spot FX P&L (USD)Bull Spread P&L (points)Bull Spread P&L (USD)-33- 330.0059 580.00Return on Capital Employed (spot FX)Return on Capital Employed (Bull Spread)-12%536%Return on Risk (spot FX, assuming no slippage)Return on Risk (Bull Spread)-100%536%Example does not include fees and commissions, which may vary by broker
Scenario 4: We catch a major market move perfectlyFinally, let’s look at the dream scenario where, almost immediately after we go short, the market suffers a significant sell-off, and we let ourposition run.In this case the Bull Spread bottoms out at its Floor level, expiring at 9am at 13920 for a profit of 89 pips. The spot trade, however, has nocap on profits – in this example an exit is assumed at 13890, a profit of 127 pips.Spot E/ entry levelat 140177am-9am 13920-14020Bull Spread entrylevel at 140091402014000Stop at 140505am6am7am8am9amSpotE/ 139207am-9am 13920-14020Bull Spread expiresat 9am at 13920, fora profit of 89 pipsExit from spottrade at 8.45am at13890, for a profitof 127 pips
Scenario 4: We catch a major market move perfectlyThe spot E/ strategy is the clear winner here, in absolute dollar terms, mostly because of the fact that the maximum profit available onour Bull Spread strategy, given our entry level, was 89 pips.However, the Bull Spread is still ahead in terms of return on capital; collateral of just 110 resulted in a profit in this case of 890. The E/ spot trade required 25 times as much capital – over 2800 – to generate a profit of 1270.Spot FX margin required (1 standard lot)Bull Spread collateral required (10 lots) 2,803.40 110.00Spot FX risk (USD, assuming no slippage)Bull Spread risk (USD) 330.00 110.00Spot FX P&L (pips)Spot FX P&L (USD)Bull Spread P&L (points)Bull Spread P&L (USD)127 1,270.0089 890.00Return on Capital Employed (spot FX)Return on Capital Employed (Bull Spread)45%809%Return on Risk (spot FX, assuming no slippage)Return on Risk (Bull Spread)385%809%Example does not include fees and commissions, which may vary by broker
Scenarios comparedLooking at these scenarios together,
Spread) would be 10. We can see that the Bull Spread strategy cost us only one third of the losses we would have experienced trading the spot with a 33 pip stop. We can also see that the Bull Spread strategy required only about 4% of the capital required to establish the spot position, assuming spot FX is margined at 2% ( 110 vs. 2803.40). This has the effect of hugely magnifying our (negative) Return