Transcription
The Accounts Payable Network - Benchmarks: The State of Accounts Pay.1 of dules.php?name Art.Benchmarks: The State of Accounts Payable 2013May 2013The goal of accounts payable departments today is to progress towards a day when their staffs focus less on clerical dataentry work and more on analytical, strategic tasks. With modern technology giving accounts payable the power to become avalue-adding function in the organization, as opposed to merely a cost center, how close are AP departments to meeting thisgoal?While just a small percentage of organizations believe they are at this level, many are making great strides. In fact, a thirdof organizations report that their accounts payable teams focus more on problem solving than on clerical tasks. However, just3 percent say their departments help perform strategic activities like spend analysis.Transforming AP from a clerical process into an analytical one requires a lot of steps. Where do AP organizations stand todayin terms of implemented technologies? Have departments rolled out best practices, such as mandating invoices come directlyto AP? Most importantly, what are AP managers' top concerns right now?TAPN's latest survey results on the State of Accounts Payable provide a snapshot of where organizations are today,highlighting the progress they have made and the work that still must be done. In addition, the results reveal how executivemanagement, internal customers, and AP itself view accounts payable's contributions to the organization.Report ContentsStudy ParticipantsOrganization Size (number of employees)Industry (NAICS)Summary Study ObservationsSurvey ResultsOrganization of Accounts PayableAssessment, Top Concerns, Awareness of AP ValueAP Staff Education, Proficiency, and TrainingDisbursement MetricsUse of TechnologyRegulatory ComplianceStudy ParticipantsThe Accounts Payable Network surveyed 420 organizations of all sizes and industries. Following is the participant profile byorganization size and industry by NAICS code.6/6/2013 4:57 PM
The Accounts Payable Network - Benchmarks: The State of Accounts Pay.2 of dules.php?name Art.Industries Represented (NAICS classification)IndustryPercent of ParticipantsConstruction4%Educational Services7%Finance and Insurance10%Health Care and anufacturing19%Mining3%Professional, Scientific andTechnical ServicesPublic Administration(Government)Retail TradeTransportation andWarehousing5%10%5%4%Utilities4%Wholesale Trade3%6/6/2013 4:57 PM
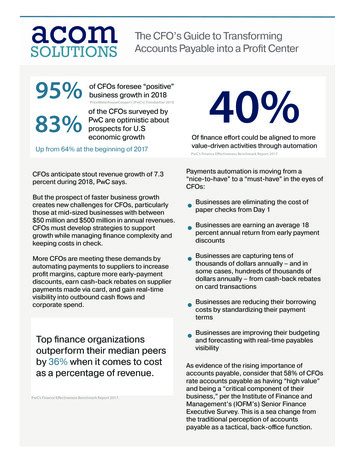
The Accounts Payable Network - Benchmarks: The State of Accounts Pay.3 of 28Other8%Do Not /html/modules.php?name Art.Return to TopSummary Study ObservationsThe State of APJust 3 percent of organizations report they have reached AP operating level 3, defined as focusing primarily onanalytical and strategic tasks.Seventy-one percent are either in level 1 (primarily clerical activities) or between levels 1 and 2 ( performingprimarily problem-solving and exception-handling tasks).Meanwhile, 27 percent of participants are either operating in level 2 or between levels 2 and 3.Seventy-two percent of organizations have centralized accounts payable, with 30 percent organized into sharedservices centers.Accounts payable organizations are twice as likely to be part of a shared services center today than five years ago.In most organizations (91 percent), the accounts payable function is part of the finance and accounting group.Procurement has control of accounts payable in 5 percent of organizations.At least some collaboration exists between AP and purchasing in 87 percent of organizations. Forty-six percent ofparticipants say the two departments are well coordinated.Eighty-one percent of participants believe their internal customers are aware of AP's contribution to the organization,although most think internal customers are only "somewhat aware."Participants are more likely to believe executive management is aware of AP's contribution, with one-fourth describingexecutive managers as "very aware."Just under half of organizations report that their AP staff is "very aware" of their own contributions.Fifty-six percent of participants say that getting access to capital expense dollars for process improvements is eithervery difficult or impossible.More than two-thirds of organizations do invest in training for their AP staffs. The most popular training method is staffcross training.AP Top ConcernsThe top concern in accounts payable departments today is improving and reducing errors.Five years ago, the top concern was making on-time payments.Performing spend analysis - a key activity of level 3 AP departments - is the top concern for only 2 percent ofdepartments.Organizations are less concerned today with reducing costs than they were five years ago.Staff Education and ProficiencyAP staff members today are more likely to be college-educated than five years ago. Sixty-three percent have at leastan associate's degree today, compared to 43 percent five years ago.The median organization reports that their average staff member has 10 years of AP experience.Eighty percent of organizations say that staff proficiency in AP has increased during the last five years.In terms of AP certification, 12 percent of organizations hold departmental certification, while 41 percent oforganizations invest in certification for their staff members. The median organization has 1 certified individual on staff.Disbursement MetricsThe median organization processes 43,000 invoices per year, while the median department has 6 FTEs on staff.6/6/2013 4:57 PM
The Accounts Payable Network - Benchmarks: The State of Accounts Pay.4 of dules.php?name Art.Fifty-five percent of the median AP department's invoices are against purchase orders, while POs reflect 70 percent ofthe median organization's total dollar spend.The median organization receives 70 percent of their invoices directly in AP from the supplier.Once invoices arrive in AP, it takes the median organization 10 days to get it ready for payment. First quartileorganizations have invoices ready to pay in just five days.Most organizations have not achieved straight-through invoice processing (invoices arrive, match, and are approvedfor payment with no human intervention).Paper remains the most common invoice receipt method, representing 70 percent of the median organization's totalinvoice volume.PDF invoices are the second most common, accounting for 20 percent of the median participant's invoice volume. EDIand electronic invoices still have only minor penetration.30-day payment terms are the most common across all company sizes and industries.Late payments are not a serious problem for a large percentage of AP departments. The median department reportsthat 90 percent of their invoices are paid on time.Only a quarter of participants track days payable outstanding. Of those that do, the median organization reports a DPOof 21 days.Even though discounts can reap big savings, few suppliers actually offer them. Just 5 percent of the mediandepartment's suppliers offer early-payment discounts.When suppliers do offer discounts, many AP departments struggle to capture them. The median organization reportsthat it captures just 5 percent of available discounts, though third quartile departments capture 86 percent.AP departments tend to have the last word when it comes to payment timing, with 74 percent reporting that theymanage this function. Ten percent of participants report that the corporate controller controls payment timing.While the trend over the past five years has been to pay invoices faster (54 percent), larger companies are the mostlikely to say they have extended payment terms during the last five years.Checks remain the most common payment method, representing a majority of total dollars spent and invoices paid.The median cost to process an invoice is 5.Use of TechnologySixty percent of organizations describe themselves as having high or medium automation. Just 5 percent report havingno automation.The most commonly-implemented technologies are p-cards and automated workflow. Vendor self-service web portalsand web-based Electronic Data Interchange are the least commonly-implemented technologies.Most departments prefer to implement their accounts payable technologies as on-premises software. Travel &entertainment expense reporting software is the most likely to be implemented via the cloud.The median participant's vendor master file contains 5,000 vendors (third quartile companies have 15,000).Meanwhile, nearly a quarter of organizations never clean their master files.Tax and Regulatory ComplianceAP departments are confident in their understanding of 1099-MISC payment reporting and withholding requirements,with 81 percent describing themselves as fully compliant.Fifteen percent fewer companies describe themselves as fully compliant with state 1099 reporting and withholdingrequirements than federal requirements.Eighty-two percent of organizations are at least partially compliant with state sales and use tax laws.Organizations are the most likely to not comply with laws requiring they check their disbursements against blockedparties lists.Return to Top6/6/2013 4:57 PM
The Accounts Payable Network - Benchmarks: The State of Accounts Pay.5 of dules.php?name Art.Survey ResultsOrganization of Accounts PayableCentralization of APIn order for accounts payable departments to transition into more strategic roles, centralization is a necessary precondition.During the past five years, the percentage of accounts payable departments organized as part of a shared services center hasdoubled. Similarly, the percentage of decentralized AP departments has been nearly halved.A clear dividing line exists between large organizations and small and medium sized ones in terms of AP being part of ashared services center. Larger organizations are more likely to have complex processes that could benefit from thestandardization that shared services can bring. In addition, they have more financial resources to undergo a large-scalecentralization project.6/6/2013 4:57 PM
The Accounts Payable Network - Benchmarks: The State of Accounts Pay.6 of dules.php?name Art.Percent of Organizations in Shared Services (By Company 00-19,99920,000 22%19%22%29%40%45%46%Percent inSharedServicesNumber of FTEs in APAll IndustriesNumber of FTEs1st Quartile3Median63rd Quartile14Average22Oversight of Accounts PayableIn most organizations, accounts payable reports up through finance and accounting. While the procurement function is AP'snatural ally in the procure-to-pay process, just 5 percent of accounts payable departments report to procurement.6/6/2013 4:57 PM
The Accounts Payable Network - Benchmarks: The State of Accounts Pay.7 of dules.php?name Art.However, larger organizations are more likely than smaller ones to put AP under procurement. AP reports to procurement injust 1 percent of organizations with fewer than 250 employees. Meanwhile, 21 percent of organizations with more than20,000 employees have AP report to procurement.Collaboration with PurchasingEven if AP departments rarely report to procurement, the two departments should work together. Bringing AP andprocurement together improves contract compliance and drives spend analysis.Fortunately, 87 percent of organizations report at least some collaboration between AP and purchasing/procurement. Just 10percent report no collaboration whatsoever.6/6/2013 4:57 PM
The Accounts Payable Network - Benchmarks: The State of Accounts Pay.8 of dules.php?name Art.Assessment, Top Concerns, Awareness of AP ValueLevel AssessmentThe Accounts Payable Network defined three operational levels, then asked participants to assess where their operation fell inrelation to these levels. The three levels are:1. Level 1: Primarily clerical activity, i.e. manual data entry of paper invoices, manual workflow, etc.2. Level 2: Primarily problem solving (e.g. exception handling, credits management, etc.) made possible by theelimination of a significant percentage of paper and implementation of process automation.3. Level 3: Focused on analytic and strategic activities, e.g. spend analysis, discount capture, and cash management.Most departments described themselves as either level 1 or between levels 1 and 2.6/6/2013 4:57 PM
The Accounts Payable Network - Benchmarks: The State of Accounts Pay.9 of dules.php?name Art.There is some minor correlation between company size and how the organization described themselves. Forty-four percent ofcompanies with 20,000 employees described themselves as level 2 or above, while only 21 percent of companies with lessthan 250 employees did so.Top ConcernsA lot of things can change in five years. Survey participants identified their top concerns working in accounts payable todayand their top concerns five years ago. While the top concern five years ago was making on-time payments, todaydepartments are more concerned with improving processes and reducing errors.Three notable concerns that have decreased in importance during the last five years are reducing costs, developing andmaintaining effective policies, and making on-time payments. Organizations may have become better at addressing theseconcerns, or the drive to improve processes has become more imperative.6/6/2013 4:57 PM
The Accounts Payable Network - Benchmarks: The State of Accounts Pay.10 of dules.php?name Art.AP Value AwarenessAccounts payable best practice consultants frequently remind AP managers of the importance of public relations. Managersneed to tell their story so that internal customers and executive management understand AP's contributions to theorganization. How successful are they?Eighty-one percent of participants say their internal customers are at least somewhat aware of AP's contributions, while 84percent say their executive managers are aware. Interestingly, smaller companies are more likely than larger ones to reportthat internal customers and executive managers are very aware. This could be a result of smaller organizations workingmore closely to these individuals.6/6/2013 4:57 PM
The Accounts Payable Network - Benchmarks: The State of Accounts Pay.11 of dules.php?name Art.Equally as important as spreading AP's message to customers and managers is making sure the AP staff itself understandstheir own contributions. Not even half of organizations report their AP staff is very aware of AP's contributions to theorganization.6/6/2013 4:57 PM
The Accounts Payable Network - Benchmarks: The State of Accounts Pay.12 of dules.php?name Art.Access to Capital Expense DollarsOne of the end goals of spreading AP awareness is to help ensure AP has access to capital expense dollars to make processimprovements. If management understands how AP affects the bottom line, then they may be more likely to invest in APimprovements. However, 56 percent of organizations describe getting access to capital expense dollars as very difficult orimpossible.Staff Education, Proficiency, and TrainingAP Staff EducationToday's accounts payable professional has more formal educaton than his or her counterpart five years ago. While a majorityof AP staff had just a high school diploma five years ago, today most have a college degree. The increased average education6/6/2013 4:57 PM
The Accounts Payable Network - Benchmarks: The State of Accounts Pay.13 of dules.php?name Art.level places additional expectations on the AP staff to provide value-adding services to the organization.6/6/2013 4:57 PM
The Accounts Payable Network - Benchmarks: The State of Accounts Pay.14 of dules.php?name Art.Years of ExperienceThe average number of years of accounts payable experience in AP departments has remained virtually unchanged duringthe past five years.AP Staff ExperienceAll ParticipantsNumber of YearsFirst Quartile5Median10Third Quartile15Average12AP Staff Experience 5 Years AgoAll ParticipantsFirst QuartileNumber of Years5Median10Third Quartile156/6/2013 4:57 PM
The Accounts Payable Network - Benchmarks: The State of Accounts Pay.15 of html/modules.php?name Art.11Staff ProficiencyWhile the average education level of the AP staff has increased during the past five years, so to has the staff's proficiency.TrainingMore than two-thirds of participants invest in some kind of training for their staff. The most common forms of training includestaff cross training, online training courses, and obtaining accounts payable certification.6/6/2013 4:57 PM
The Accounts Payable Network - Benchmarks: The State of Accounts Pay.16 of dules.php?name Art.Disbursement MetricsInvoice VolumeThe median reported invoice volume is 43,000 per year, although that figure can vary widely. While organizations with fewerthan 250 employees processes an average of 33,000 invoices per year, organizations with more than 20,000 employeesprocess an average of 1.2 million.Invoices Processed per YearAll ParticipantsNumber of Invoices6/6/2013 4:57 PM
The Accounts Payable Network - Benchmarks: The State of Accounts Pay.17 of 281st .com/html/modules.php?name Art.15,0043,0003rd Quartile140,000Average239,138Invoices can arrive in a variety of methods, including paper via mail, PDF via email, electronic data interchange, and otherelectronic formats. Most invoices still arrive on paper, although larger companies have significantly reduced paper volumes.The median organization with 20,000 employees receives just 25 percent of their invoices on paper, compared to 80 percentfor organizations with less than 250 employees.PDF invoices are the second most common format; there is no significant difference in PDF invoice volume amongorganizations of different sizes.Most organizations are not receiving a large percentage of invoices electronically - whether EDI or other electronic formats.Very large organizations are the most likely to have EDI and other electronic invoices.The following tables provide a breakdown of the different invoice receipt methods:Percent Invoices Received on Paper via MailAll ParticipantsPercentageUpper Quartile30%Median70%Lower Quartile90%Average61%Percent Invoices Received as PDF via Email (efax)All ParticipantsFirst QuartilePercentage5%Median20%Third Quartile40%Average26%Percent Invoices Received via Traditional EDIAll ParticipantsLower QuartilePercentage0%6/6/2013 4:57 PM
The Accounts Payable Network - Benchmarks: The State of Accounts Pay.18 of 28Median0%Upper twork.com/html/modules.php?name Art.Percent Invoices Received as Electronic Data (Not EDI)All ParticipantsPercentageLower Quartile0%Median0%Upper Quartile5%Average8%Purchase Order InvoicesRequiring invoices be tied to a purchase order is a proven practice for faster processing and ensuring compliance withcompany purchasing policies. The median organization ties a majority of their invoices to a purchase order, which accountsfor more than two-thirds of their total dollar spend. Larger comp
Accounts payable organizations are twice as likely to be part of a shared services center today than five years ago. In most organizations (91 percent), the accounts payable function is part of the finance and accounting group. Procurement has control of accounts payable in 5 percent of organizations.File Size: 733KB