Transcription
STD Analysis and Visualization Tool (SAViT)Rodney PresleyCDC/NCHHSTP/DSTD Data Management Team LeadMassimo MirabitoNCHHSTP Informatics & Northrop GrummanCDC Health Information Consortium (CHIIC)November 8, 2016National Center for HIV/AIDS, Viral Hepatitis, STD, and TB PreventionDivision of STD Prevention
Contributors and AcknowledgementsCDC Alesia Harvey Doug Correll Elizabeth Torrone Craig Cousins Hillard Weinstock Robert Nelson Thomas SukalacNorthrop Grumman Kumar Batra Rishi Tarar Silver Wang
Presentation Overview Current tool – STD Net Capabilities Limitations Desirable capabilities of replacement tool STD Analysis and Visualization Tools (SAViT) project Findings and recommendationNext steps
STD Net Data sources Historical hard copy formsooooAggregated by some combination of sex, age, or raceAggregation varies across diseases and yearsFrequency of reporting varies by years, disease, and geographic unitSome data available from 1963, most from 1981 Electronic data -- National Electronic Telecommunications Systemfor Surveillance (NETSS)ooooIndividual case reportsReported weeklyDifferent jurisdictions adopted NETSS in different yearsData available from 1992
STD Net Capabilities Calculates case count and rates by multiple combinations of year,area, sex, age, and race for reportable STDs Available outputs Table.csv fileBar graphLine graphChoropleth map
STD Net Limitations Can only select pre programmed queries Slow processing speed for queries accessing non aggregated, caselevel data Cumbersome to maintain programs Not currently programmed to access SQL data tables
STD Net Desirable capabilities of replacement tool Allow user to construct any query Speed up queries of case level data Provide multiple output formats in multiple file formats Provide transparent access to SQL data repository Reduce maintenance and modification efforts
SAViT
SAViT Overview Analysis conducted between March 2015 and July 2015High-level assessment of 12 technologiesBI platform vendors assisted and validated the capabilitymatrixAnalysis was not validated or peer-reviewed
SAViT Evaluation Criteria Architecture - OS requirements, API, Data AccessSecurity - Type of authentication (SSL, AD, Kerberos, Oauth,Development - IDE, Report Designers, Programming Model, 508Visualization - Tabular, Maps, cross-tabs,, drill down, export, Ad-HocTechnical Support - Telephone, eMail, SLAs, forumsOther - In use at CDC, Open Source, Licensing, Cost
Detail Evaluation Criteria Development ArchitectureVersionOpperating SystemsTechnology Stack SupportRequires Plugin (Flash , Silverlight etc)HTML Based VisualizationJavacript APIREST APIWeb AccessServer EditionData IntegrationData Access SupportMulti-Vendor DB SupportMulti-Dimentsional databases (Data Cube)ODBCJDBCMulti-datasource capabilityData Source SupportMicrosoft Excel FileFlat FilesXML FilesScripted DatasourceStatistical files (SAS, STATA, R) Integrated Development EnvironmentDashboard designerFull programmatic control/scriptingGrouping, aggregations, sub-totals, calculationsMulti-section and sub-reportsConditional sections and logicOn demand reportingScheduling reportsMobile ReadyBig Data CapableSection 508 Capable Visualization CapabilitiesTabular dataMapChartsCross-Tab reportsDrill DownDash-BoardsExport ExcelExport PDFExport WordExport PowerpointAd-Hoc ReportingAd-Hoc Analysis Technical SupportTelephone SupporteMail SupportService Level AgreementDocumentationWeb Forums and other resources OtherCurrently in use at CDCOpen SourceSource Code AvailableMulti-User SupportLicensePricing SecuritySecure socket Layer SupportActive DirectorySAML - 3rd party integrationKerberosOauth 2.0
Software EvaluatedBI Platforms Actuate BIRTBIRT (Open Source)*CognosInstantAtlas*Pentaho PremiumPentaho (Open Source)QlikViewSAP Business Objects*SAS Visual analytics*Tableau** Currently at CDCVisualization Libraries D3.JS* FusionCharts*Not Evaluated Microsoft Palantir*
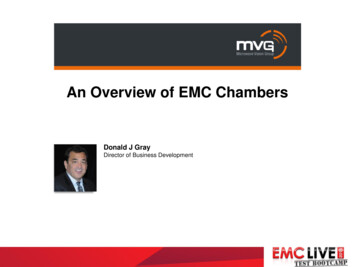
Software Analysis
Software Analysis (continued) Architecture DevelopmentHTML Based Visualization Integrated Development Environment Javacript API Dashboard designer REST API Full programmatic control/scripting Web Access Grouping, aggregations, sub-totals, calculations Data IntegrationData Access SupportMulti-section and sub-reports Conditional sections and logic Multi-Vendor DB Support On demand reporting Multi-Dimentsional databases (Data Cube) Mobile Ready Multi-datasource capability Visualization CapabilitiesData Source SupportMicrosoft Excel File Tabular data Flat Files Map XML Files Charts Scripted Datasource Cross-Tab reports Statistical files (SAS, STATA, R) Drill Down SecurityDash-Boards Secure socket Layer Support Export Excel Active Directory Ad-Hoc Reporting
Software Analysis (continued)
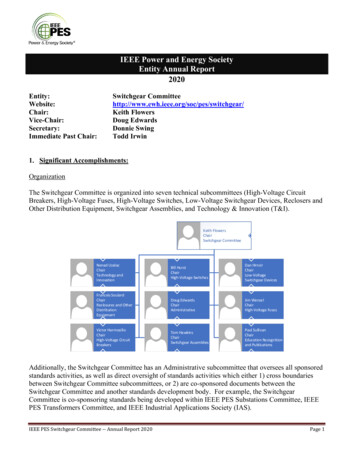
Software Analysis (continued)ActuateCognosQlikSAP*SAS Visual AnalyticsTableauLicensing TypeSubscriptionUser LicencingUser LicensingServer LicensingYear 0 156,000 111,404 79,000 534,692Year 1 196,000 58,564 55,800 136,419Year 2 196,000 58,564 55,800 147,333 TCO817,267303,098264,1141,029,669Named usersServer Licensing 55,630 53,930 53,930 53,930 53,930 53,930 273,937 108,494 108,494 108,494 108,494 108,494 236,425622,922Year 3 196,000 58,564 55,800 159,119Year 4 196,000 58,564 55,800 171,849Year 5 196,000 58,564 55,800 185,597* SAS Visual Analytics will be deployed and maintained by ITSO and DSTDP will not incur any infrastructure cost. Annual licensing costs are stillvalid and will be equivalent to the negotiated price between the CDC and SAS and will be captured through the Working Capital Fund (WCF). SASprojections are based on the current rate of 1,172 per user and will be renegotiated in 2018.
Analysis (continued)
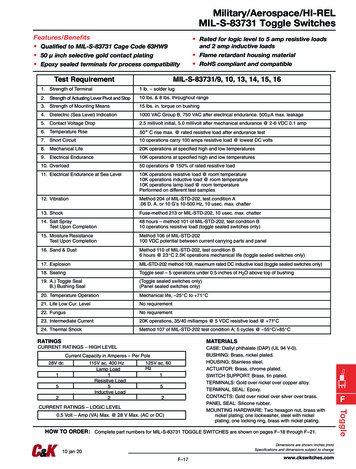
Software Analysis
Software Analysis (continued)
Key Findings The market is saturated with Data Visualization softwareSome products are more mature and capable than othersNeed to clearly define goals and expectationsThere is significant upfront commitmentBI Platforms require full long-term commitmentPricing models may varyNo single offering to address all needsNo additional cost to use SAS Visual Analytics until 2018
Next steps Gather cost information for two contenders Purchase costsMaintenance costPersonnel costsInfrastructure costs (servers, web portals etc.)Request trial evaluation of tool Recruit NON data managers / analysts to evaluate
Next steps Compare notes with other CDC users of datavisualization tools Customer support / service Total costs User acceptance and adoption
QuestionsFor more information please contact Centers for Disease Control and Prevention1600 Clifton Road NE, Atlanta, GA 30333Telephone: 1-800-CDC-INFO (232-4636)/TTY: 1-888-232-6348Visit: www.cdc.gov Contact CDC at: 1-800-CDC-INFO or www.cdc.gov/infoThe findings and conclusions in this report are those of the authors and do not necessarily represent the official position of theCenters for Disease Control and Prevention.National Center for HIV/AIDS, Viral Hepatitis, STD, and TB PreventionDivision Name in this space
Nov 08, 2016 · Server Licensing 273,937 108,494 108,494 108,494 108,494 108,494 622,922 Tableau * SAS Visual Analytics will be deployed and maintained by ITSO and DSTDP will not incur any infrastructure cost