Transcription
RESEARCH ARTICLEOhio Journal of Public Health, December 2019, Vol. 2, Issue 2ISSN: 2578-6180Ohio Journal of Public Health, December 2019, Vol. 2, Issue 2ISSN: 2578-6180RESEARCH ARTICLEHuman Development and Controlled Substance Prescribing in Ohio CountiesPatricia Factor, MPH, MCHES, CHEP1; Wallace Chambers, MHA2; JoAnna “Anna” C. S. Kauffman, MD3; Tunu Kinebrew, MPA4;Natasha Yonley, MPH, CPH5; Ross M. Kauffman, PhD, MPH, CPH61Galion City Health Department, Galion, OH2Cuyahoga County Board of Health, Parma, OH,3Family Medicine Residency at St. Rita's Medical Center, Mercy Health, Lima, OH4Cincinnati Health Department, Cincinnati, OH5Tuscarawas County Health Department, Dover, OH6Center for Interdisciplinary Studies, Ohio Northern University, Ada, OHCorresponding Author: Ross M. Kauffman, 525 North Main Street, Ada, OH 45810, (419) 772-1057, r-kauffman.2@onu.eduABSTRACTBackground: Human development is a holistic measure of well-being. The American Human Development Index(AHDI) operationalizes the concept for the American context, using a composite measure of income, education, andhealth. This work presents the first county-level examination of AHDI for the state of Ohio and examines the relationshipbetween human development and controlled substance prescribing.Methods: Publicly available data from the census and prior publications were compiled to calculate county -levelAHDI for all 88 Ohio counties. Correlations were examined between AHDI and 4 classes of controlled substances, opioids,benzodiazepines, stimulants, and sedatives, using Pearson product moment correlation coefficient.Results: County AHDI scores ranged from 3.3 to 7.6, with mean and median values of 4.8. At the county level,human development is negatively correlated with opioid (r -0.46, r2 0.22, P 0.0001) and benzodiazepine (r -0.43,r2 0.18, P 0.0001) prescribing and positively associated with stimulant prescribing (r 0.49, r 2 0.24, P 0.0001).Neither sedative prescribing practices (r 0.09, P 0.40) nor median age (r -0.09, P 0.41) were significantlycorrelated with AHDI.Conclusion: There is a strong correlation between AHDI and prescribing of several classes of controlled substances. Work remains to ascertain mechanisms and directionality of these relationships. Whether higher prescribing in areaswith lower human development is an attempt to medicate health inequity or low human development is an additionalmanifestation of the opioid epidemic, this study underscores the necessity of pursuing equity in all policies.Keywords: Opioids, Controlled substances, Prescribing, Human development, Human development indexINTRODUCTIONImproving the well-being of populations is the central work ofpublic health. Human development is a capabilitarian constructionof well-being, that is, one which posits one’s ability to act and existin a manner consistent with one’s values as the ultimate measureof utility.1,2 Introduced in 1990, the Human Development Index(HDI) was an attempt by the United Nations to operationalize thisidea by combining health, education, and economics into a single,holistic measure of human well-being in populations.3The American HDI (AHDI), an adaptation for use within the UnitedStates, employs the same dimensions, but utilizes contextappropriate measures. Specifically, AHDI measures economic wellbeing using median personal earnings, health using life expectancyojph.org24at birth, and education using a composite measure of educationalattainment and school enrollment.4 Measure of America, a projectof the Social Science Research Council, has applied the AHDI atnational, state, and, in some areas, county and local levels, examining geographic, demographic, and temporal trends.The Ohio Automated Rx Reporting System (OARRS), a prescriptiondrug monitoring program, was established by the State of OhioBoard of Pharmacy using powers granted by Ohio Rev Code§4729.75, a 2005 law.5,6 The Ohio Automated Rx Reporting Systemseeks to reduce the misuse and diversion of controlled substancesby identifying potentially criminal behavior by health care providers, identifying individuals who may need help with addiction, anddriving policy decisions such as prescribing guidelines.Ohio Public Health Association
RESEARCH ARTICLEOhio Journal of Public Health, December 2019, Vol. 2, Issue 2The Ohio Automated Rx Reporting System gathers data on DrugEnforcement Agency Schedule II, III, IV, and V drugs, and publiclyreleases quarterly county-level data on 4 classes of drugs: (1) opioids commonly used to treat acute or chronic pain (excludingbuprenorphine, which is used to treat opioid dependence),(2) benzodiazepines used in the treatment of panic and anxietydisorders, (3) stimulants used to treat attention and hyperactivitydisorders, obesity, or sleep-related disorders, and (4) nonopioidsedatives used for treatment of insomnia.As an example of how ecological studies are conducted, one of theauthors (RMK) assembled a set of state-level data for students toconduct their own studies in an introductory epidemiology class.One of the stronger relationships observed was between AHDI7and opioid prescription,8 which had a strong, negative correlationcoefficient.9 To explore this relationship further, the current studycalculates the AHDI for all 88 counties in Ohio, and examines thecorrelation between human development and physician prescribing practices at the county level. The AHDI and constituent indexscores for each Ohio county are also presented for use in futureresearch.METHODSSetting and DesignWe used county-level data for all 88 Ohio counties. The data werecollected during or around 2016. An ecological study was performed using publicly available data.ISSN: 2578-6180Health Index. Life expectancy at birth in 2014, the most recent yearfor which data were available, was accessed via the Global HealthData Exchange to calculate the Health Index.13,14 Life expectancywas linearly rescaled so that life expectancies from 66 to 90 yearsremapped to a 0 to 10 scale.Education Index. Educational attainment drew data from 9-yearestimates from the 2016 American Community Survey drawn fromtable DP02, Selected Social Characteristics in the United States.15An Educational Attainment Score was determined by summing thepercentage of residents aged 25 years and older with at least ahigh school degree (HC03 VC95), at least a bachelor’s degree(HC03 VC96), and a professional degree (HC03 VC92) and dividing the result by 100. An Educational Attainment Index was calculated by linearly rescaling scores so that Educational AttainmentScores of 0.5 to 2.0 remapped to a 0 to 10 scale.Educational enrollment data were 5-year estimates from the 2016American Community Survey drawn from table S1401, SchoolEnrollment.16 The net gross enrollment ratio was calculated bydividing the population aged 3 years and over enrolled in school(HC01 EST VC01) by the population aged 3 to 24 years (sum ofHC01 EST VC16, HC01 EST VC18, HC01 EST VC21, HC01 ESTVC24, and HC01 EST VC39). For the Enrollment index, the enrollment ratio was linearly rescaled so that values of 60% to 95%remapped to a 0 to 10 scale.ProceduresThe Education Index was calculated as a weighted average of theEducational Attainment and Enrollment Indices, with EducationalAttainment receiving twice the weight of Enrollment.Publicly available data were gathered from multiple sources to calculate the AHDI for each of Ohio’s 88 counties. Ohio Northern University’s Institutional Review Board reviewed and determined theproject to be exempt from review due to the use of aggregate data.Age. County-level data on median age (HD01 VD02), a potentialconfounder, was evaluated using 5-year estimates from the 2016American Community Survey drawn from table B01002, MedianAge by Sex.17MeasuresStatistical AnalysisDependent VariablesTests for association between paired samples were obtained usingPearson product moment correlation coefficients in R (64-bit, version 3.4.3 for Windows) using the cor.test function.18,19 FullR code for the analyses is included in the Supplemental Material.Maps showing the geographic distributions of key variables wereconstructed using the free and open-source geographic information system QGIS (version 2.18.3 for Windows).20 A shapefilecontaining county boundaries was obtained from the Ohio Department of Transportation’s Transportation Information MappingSystem (TIMS).21 Detailed methodology for constructing choropleth maps are found in Supplemental Material Appendix B. Figuredesigns were implemented using the Solarized color palette.22Prescribing Practices. County-level data on controlled substanceprescribing practices were downloaded from OARRS through thequarterly county data.10 Total number of doses prescribed percapita in 2016 were compiled for opioids, benzodiazepines, stimulants, and sedatives.Independent VariablesAmerican HDI. The AHDI is calculated as the mean of the Income,Health, and Education Indices, constructed in accordance withpublished methodologies for the report Measuring America: TenYears and Counting.11Income Index. Median personal earnings were evaluated using5-year estimates from the 2016 American Community Surveydrawn from table S2001, Earnings in the Past 12 Months (In 2016Inflation-adjusted Dollars).12 To calculate the Income Index, thelog of the median earnings (HC01 EST VC02) was rescaled so thatvalues of log ( 16009) -log ( 67730) remapped to a 0 to 10 scale.ojph.org25RESULTSThe AHDI scores for Ohio counties ranged from a minimum of 3.3to a maximum of 7.6, with a median and mean value of 4.8. Fullstudy data are presented in tabular form in the Supplemental Material. The minimum score of 3.3 was observed in Holmes County,where a low Income Index and state-minimum Education IndexOhio Public Health Association
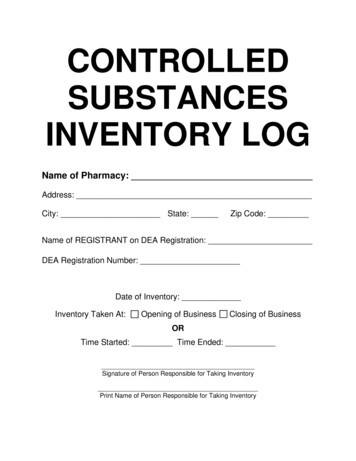
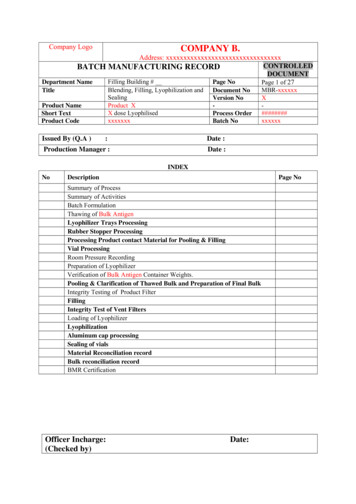
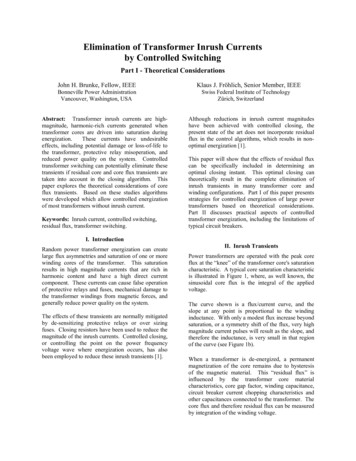
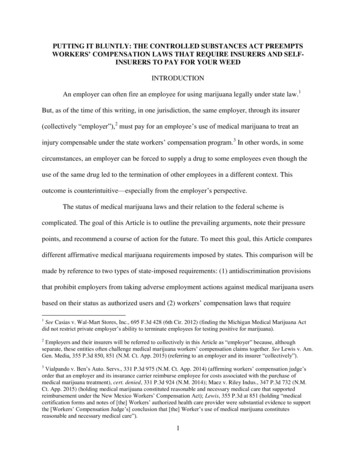
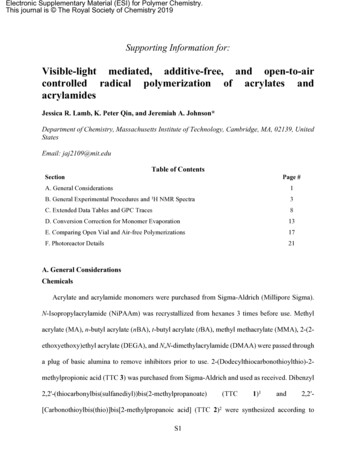
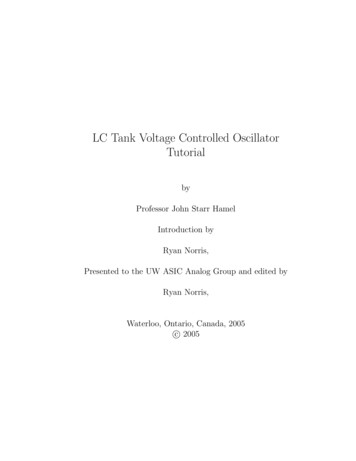
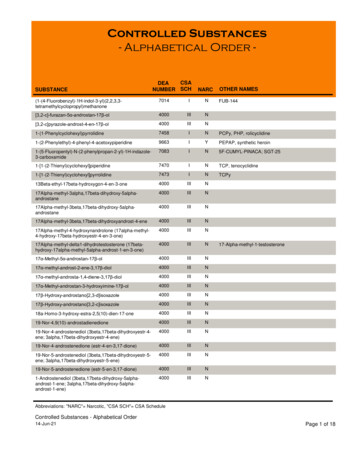
RESEARCH ARTICLEOhio Journal of Public Health, December 2019, Vol. 2, Issue 2offset a top 10 ranking on the Health Index. Delaware County hadnot only the highest AHDI score of 7.6, but also the first- orsecond-highest score in each of the subindices. A map showing thegeographic distribution of human development scores is presented in Figure 1.ISSN: 2578-6180The geographic distribution of prescribing practices for controlledsubstances, as reported in OARRS, are illustrated in Figure 2. Opioids (r -0.46, P 0.0001), benzodiazepines (r -0.43, P 0.0001),and stimulants (r 0.49, P 0.0001) were all significantly associated with AHDI score at the county level (Figure 3). Prescribingpractices for sedatives were not significantly associated with human development at the county level (r 0.09, P 0.40). Medianage was also not significantly associated with human developmentin the sample (r -0.09, P 0.41).DISCUSSIONIn the current study, the AHDI was significantly correlated with 3of the 4 classes of controlled substances: opioids, benzodiazepines,and stimulants. Interestingly, human development was negativelycorrelated with the former 2 classes of drugs, meaning better-offpopulations are less likely to have high rates of opioid and benzodiazepine prescribing, but positively correlated with stimulantprescriptions.The ecological design of the current study necessitates cautionwhen interpreting results, especially with regard to the ecologicalFigure 1. Geographic Distribution of the American HDI in OhioCounties, 2016Figure 2. Geographic Distribution of Prescribing Practices in Ohio Counties, 2016. Annual Per Capita Prescribed Doses for 4 Classes ofControlled Substances as Reported in the Ohio Automated Rx Reporting System (OARRS)ojph.org26Ohio Public Health Association
RESEARCH ARTICLEOhio Journal of Public Health, December 2019, Vol. 2, Issue 2ISSN: 2578-6180Figure 3. Scatterplot of Per Capita Prescriptions of 4 Classes of Controlled Substances Versus American HDI in 88 Ohio Counties in 2016fallacy.23 An association at the group level does not necessarilyimply that such a relationship holds at the individual level. Further, individual-level studies would be needed to determine if oneor more of the components comprising the American HDI are individually linked to prescribing practices.Confounding is another key consideration in determining validity.Age is a frequent source of confounding in observational research,24 and so received special attention in the current study.While prescribing practices are known to vary with age,25 thedegree of relationship between human development and agedistribution is less clear. A population’s age distribution mightpotentially impact multiple components of HDI. For example, eduojph.org27cational attainment can only be achieved over time and earningstypically increase with age. However, age distribution, as measured by median age, was not significantly associated with American HDI score in this study. As confounders must be associatedwith both the cause and effect, age does not appear to be a confounder here.Work remains to fully map the complex pathways through whichsocial determinants influence health, but the central importance ofsuch factors is well established.26 As a composite measure of socialdeterminants, causal relationships involving human developmentare likely similarly complex and bidirectional. The strength of theobserved relationships and consistency across multiple classes ofOhio Public Health Association
RESEARCH ARTICLEOhio Journal of Public Health, December 2019, Vol. 2, Issue 2drugs support the utility of human development as a measure ofwell-being at the county level despite this ambiguity.Several possible mechanisms could explain the observed relationships, in both causal directions. The components underlying theAmerican HDI are all core social determinants of health, and inthis way may shape outcomes like prescribing practices.27 Education shapes occupation. Manual jobs may predominate in areaswith less education, which may increase the prevalence of injuriesrequiring opioid prescriptions.28 Low-income areas might haveinferior housing options, with higher rates of crime and less accessto stress-relieving green space, increasing the prevalence of anxiety disorders and subsequent benzodiazepine prescriptions.29,30While children from lower-socioeconomic status (SES) have beenfound to have higher diagnosed rates of attention deficit/hyperactivity disorder (ADHD), children from high-SES households have had higher rates of treatment, potentially explaininggreater stimulant prescriptions.31It is also possible that the higher prescribing of opioids and benzodiazepines in low AHDI areas are, in a literal sense, an attempt byour health care system to medicate the sequelae of social inequity.Compelling recent work has demonstrated higher rates of reported physical pain among those who experience emotional trauma.32Prescribing differences may highlight physical manifestations ofdiffering levels of human development.There are also valid hypotheses with the opposite causal direction.For example, overprescribing of opioids and benzodiazepines,drugs with a strong potential for abuse, may undermine the socialfabric in ways that reduce human development.In all likelihood, there is a complex, bidirectional relationshipbetween AHDI and prescribing practices. Elucidating the relativestrength of these components could be valuable direction forfuture work.A major limitation of the AHDI derives from its goal of adaptingthe concept of human development for a typical “American” context. Holmes County, the primary outlier in our sample, illustratesthe limitations of the selected measures. Holmes County lies at theheart of one of the largest Amish settlements in the world.33 Amishculture does not strongly value formal education, as evidenced byHolmes County’s state-minimum Educational Index score. Despitethe low score, Holmes County also had the lowest rate of opioidprescriptions, likely due to Amish patterns of medical utilization.34Future studies should examine the contributions of the component indices as independent and concurrent predictors of healthoutcomes. More focused measures (eg, life expectancy at birth)may prove more useful for predicting specific outcomes than thecomposite AHDI measure. Full data are appended to facilitate suchresearch.The concept of human development is consistent with a vision ofhealth as “complete physical, mental, and social well-being.”35 Thisis the first publication of county-level AHDI in Ohio. The strengthojph.org28ISSN: 2578-6180of relationships observed in the current study suggest that AHDImay be useful for future researchers as a proxy for social determinants or wellness-related outcome.PUBLIC HEALTH IMPLICATIONSThis work presents the first county-level examination of the AHDIfor the state of Ohio and provides a potentially valuable measurefor use by future researchers and public health professionals. Human development is predictive of prescribing practices, thoughthe directionality of the relationship is not clear. Future workshould explore potential causal pathways linking human development and prescribing practices. The opioid epidemic is a significant public health crisis. Whether higher prescribing in areas withlower human development is an attempt to medicate health inequity or low human development is an additional manifestation ofthe opioid epidemic, this study underscores the necessity of pursuing equity in all policies.ACKNOWLEDGEMENTSThis research was conducted by the Ohio Public Health Association Epidemiology Section’s Collaborative Research Group. Special thanks to OhioNorthern University’s Northern Opioid Alliance for inspiring the statelevel analysis that led to this work. This work would not have been possible without multiple free and open-source projects, including the R Projectfor Statistical Computing, the QGIS Project, and Solarized.REFERENCES1. Desai M. Human development: Concepts and measurement. EuropeanEconomic Review. 1991;35(2):350-357. doi:10.1016/0014-2921(91)90136-72. Robeyns I. The Capability Approach. In: Zalta EN, ed. The StanfordEncyclopedia of Philosophy. Winter 2016. Metaphysics Research Lab,Stanford University; 2016. s/capability-approach/. Accessed September 21, 2019.3. United Nations Development Programme. About Human Development.Human Development Reports. http://hdr.undp.org/en/humandev/.Accessed May 28, 2019.4. Social Science Research Council. About Human Development. Measureof America. cessed May 28, 2019.5. Ohio Automated Rx Reporting System (OARRS). Ohio Data SubmissionDispenser Guide. Columbus, OH: State of Ohio Board of Pharmacy; ensed%20drugs%20to%20OARRS.pdf. Accessed June 13, 2019.6. Ohio Automated Rx Reporting System (OARRS). OARRS 2018 AnnualReport. Columbus, OH: State of Ohio Board of Pharmacy; 2018. 20(2018).pdf.Accessed June 13, 2019.7. Lewis K, Burd-Sharps S. The Measure of America: American HumanDevelopment Report 2013–2014. New York: Measure of America, SocialScience Research Council; 2013. http://measureofamerica.org/measure of america2013-2014/. Accessed June 1, 2019.8. Centers for Disease Control and Prevention. U.S. State PrescribingRates, 2017. CDC Injury Center. html. Published 2017. Accessed June 1, 2019.Ohio Public Health Association
RESEARCH ARTICLEOhio Journal of Public Health, December 2019, Vol. 2, Issue 29. Kauffman RM, Kauffman JCS, Kauffman, Rudi D., Kauffman, Ryan D.Human Development and Opioid Prescribing: A Secondary Analysis ofSocial Determinants of the Opioid Crisis. 2019.ISSN: 2578-618024. Phillips LR. Age: a truly confounding variable. West J Nurs Res.1989;11(2):181-195. doi:10.1177/01939459890110020410. Ohio Automated Rx Reporting System (OARRS). Quarterly County Data.Ohio Automated Rx Report
The Ohio Automated Rx Reporting System (OARRS), a prescription drug monitoring program, was established by the State of Ohio Board of Pharmacy using powers granted by Ohio Rev Code . values of log ( 16009) -log ( 67730) remapped to a 0 to 10 scale. Health Inde