Transcription
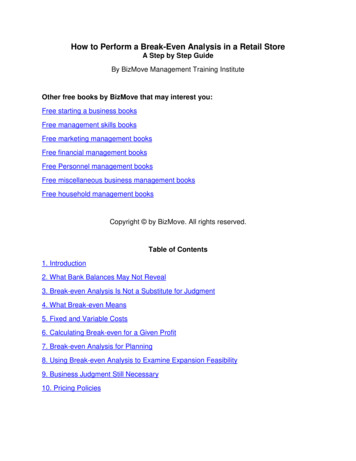
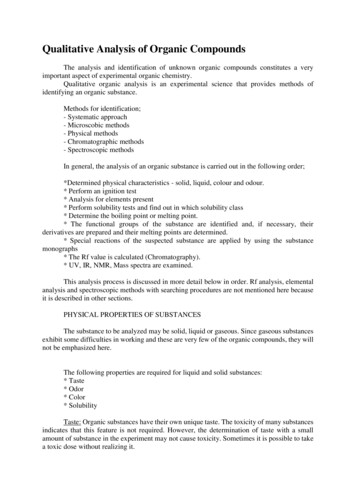
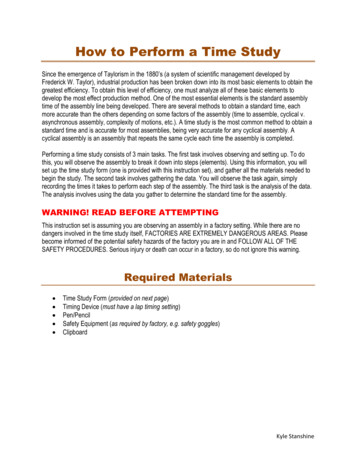
Perform Qualitative Risk AnalysisIntroduction Risk analysis can be categorised into two broad methods. They are qualitative and quantitativein nature.Purpose and Objective The Perform Qualitative Risk Analysis process assesses and evaluates the characteristics ofindividually identified project risks and prioritizes risks based on agreed-upon characteristics.Evaluates probability and impact of individual risk on the project objectives.Risks are categorized according to their sources or causes.Identifies areas of greater risk exposure (e.g., project completion date, budget, deliverable’sscope) and facilitates risk responses.Methods of qualitative risk analysis are applied to the list of positive and negative risks createdor updated by the Identify Risks Process.Quantitative Risk Analysis helps to determine the overall risks to project objectives resultingfrom the potential interactions and combined effect of all risks.Risk responses are more effective while addressing root cause (several risks originating from acommon source).Critical Success Factors for Perform Qualitative Risk Analysis Process Critical success factors are:o Use Agreed-Upon Approacho Use Agreed-Upon Definitions of Risk Termso Collect High-Quality Information about Risks, ando Perform Iterative Risk AnalysisSeveral factors leading to successful qualitative risk analysis are summarized in Figure 6-1.Figure 6-1 Building Risk Analysis Credibility 2012 RMstudy.comPage 1 of 12
Perform Qualitative Risk Analysis1. Agreed-Upon Approach: Agreement of the project stakeholders is a fundamental criterion and a common theme.High-quality information collected contributes to the reliability and credibility of processoutputs. This approach is the foundation of process credibility.Probability of occurrence, impact on individual objectives, urgency (proximity), andmanageability are the risk assessment factors.o Urgency: Risks requiring near term responses may be considered more urgent to address.Indicators of urgency are as follows: Lead time required for the execution of risk response Clarity of symptoms, and Warning signs triggering risk response (detectability)o Manageability: Some risks are unmanageable and attempting to address them is a waste ofresources. So the project team may examine and decide to: Go forward and establish a contingency reserve. Stop or re-scope the project because of a high probability ofunmanageable threat posed by risks and fear of missing out on opportunities.Inform the customer of the risks and ask for a decision from their point of view. o Impact external to the project: The importance of a risk may be increased if it affects theenterprise beyond the project.2. Agreed-Upon Definitions Risk assessment should be based on agreed-upon definitions of important terms, and theyshould be used consistently. Example: Levels of probability and impact on objectives helps to give realistic risk assessments,and facilitates communication of results between management and stakeholders.3. Highly Quality Information It is gathered by interviews, workshops, and other means using expert judgment. Individual data subject to reporting or intentional bias should be identified and remedied, orelse a different and unbiased source of information should be found and used. 2012 RMstudy.comPage 2 of 12
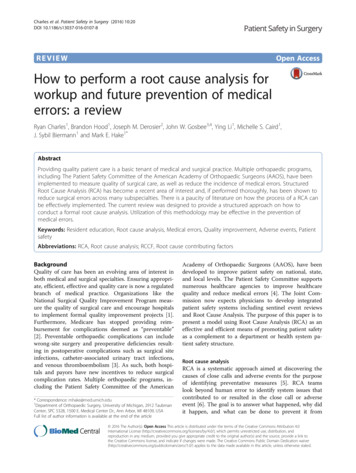
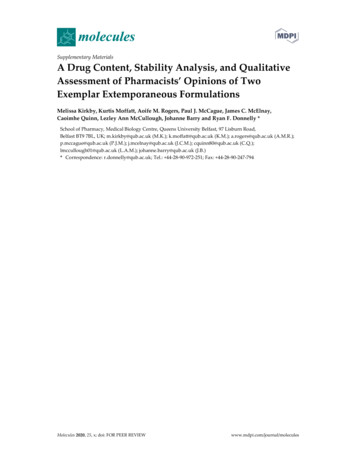
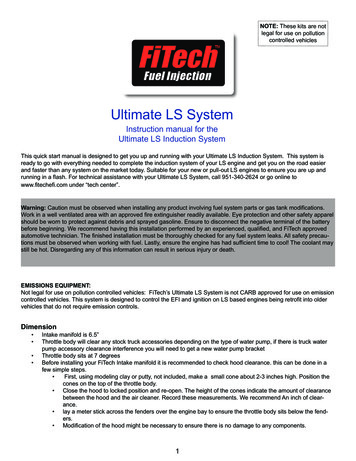
Perform Qualitative Risk Analysis4. Iteration Periodical analysis of individual risks of project enhances the success of qualitative risk analysis. The frequency of analysis is planned in the Plan Risk Management process, and events withinthe project also influence it.Tools and Techniques for the Perform Qualitative Risk Analysis ProcessTools and techniques identify the risks that are important to the project’s success. They are asfollows:oSelect Risk Characteristics that define Risks’ ImportanceoCollect and Analyze DataoPrioritize Risks by Probability and Impact on Specific Objectives,oPrioritize Risks by Probability and Impact on Overall ProjectoCategorize Risk CausesThe tools and techniques used for assessing individual risks will identify the risks that are importantto the project’s success. This process is illustrated in Figure 6-2Figure 6-2: The Perform Qualitative Risk Analysis Process 2012 RMstudy.comPage 3 of 12
Perform Qualitative Risk Analysis1. Select Risk Characteristics Helps to distinguish high level risk response from low level risk response. The criteria that make a risk important to management are agreed upon in advance andimplemented in the tools used. Output includes a listing of risks in priority order or in priority groups such as high, moderate,and low.2. Collect and Analyze Data Assessment of individual risks is based on information collected about them. Data collection, evaluation tools, including interviews, workshops, and references to databasesof prior projects require management support and attention. Intention bias should be avoided while relying in expert judgment for the information.3. Prioritize Risks by Probability and Impact on Specific Objectives Helps to distinguish a risk’s priority in terms of probability and impact on project objectives. It is useful since it is common to have uneven impacts on various project objectives.4. Prioritize Risks by Probability and Impact on Overall Project The reason behind constructing a measure of a specific risk’s response is to easecommunication with management and other stakeholders. The organization should be explicit about the single risk prioritization index, if needed, whichreflects the establishment’s preference among objectives. It should be documented in the Plan Risk Management process.5. Categorize Risk Causes Brings improvement in analysis of the probability and magnitude of project risk and effectiveresponses. Identifying common root causes of a group of risks reveal both the magnitude of the risk eventand effective strategies that might address several risks simultaneously. Better understanding of the chain of risks lead to the implementation of risk for the project. It provides a realistic picture of problems of risk mitigation using scarce resources. 2012 RMstudy.comPage 4 of 12
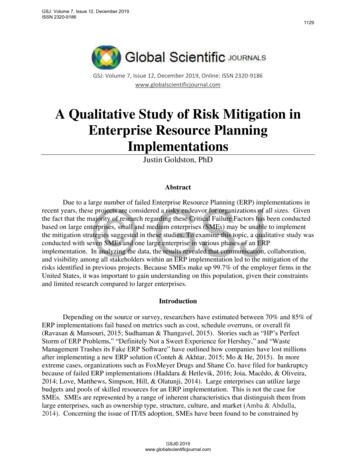
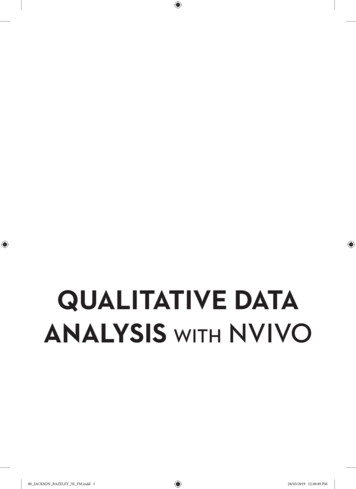
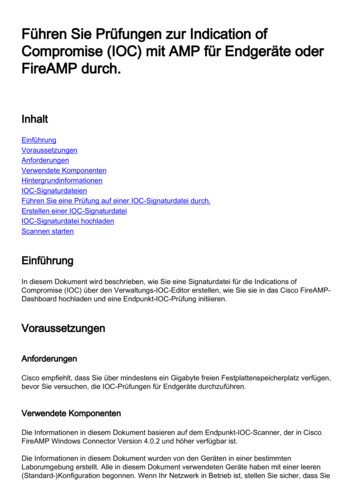
Perform Qualitative Risk Analysis Combined results of the Perform Qualitative Risk Analysis and risk breakdown structure showsclusters of priority risks arising from specific sources and high risk areas. Assessment of high priority risks’ impact on one objective reduces the uncertainty of thatobjective.Documentation of Results It adds structure to the list of undifferentiated risks into categories of priority. Priorities are based on probability of risk occurrence and impact on project objectives. The information is stored in risk registry and is easy to use and update. List of prioritized risks is posted to the project participants for improving the plan and riskshaving high priority are segregated for further analysis and monitoring. Low priority risks are placed on a watch list and are less often reviewed for changes.APPENDIX The Perform Qualitative Risk Analysis process prioritizes the further analysis of theundifferentiated list of risks identified in the Identify Risks process. Organizations apply resources to “high risk” based on their priority indicated by risks’probability and impact characteristics.TECHNIQUES1. Root Cause Analysis:A root-cause analysis identifies basic causes of risks that may point to fundamental forces; it alsoidentifies common sources of risks. Risks that may be related because of their common rootcauses may also be identified. Preventive action may be taken according to the details that arearrived at through this technique. The success of this technique depends on the willingness bymanagement to accept and address the root cause rather than adopting partial workarounds.The root-cause analysis technique reduces the instances of problems occurring instead ofreacting to problems when they occur.Disadvantages: Root causes cannot be identified in risk management techniques that areorganized by individual risk.Other potential causes of risk may be overlooked in this technique. Moreover, there may be novalid strategy to address the root cause once it has been identified. 2012 RMstudy.comPage 5 of 12
Perform Qualitative Risk AnalysisFigure 6.3 Example of a Root Cause Analysis2. Estimating Techniques Applied to Probability and Impacts: Addresses both key dimensions of a risk, namely its degree of uncertainty (probability) and itseffect on project objectives (impact).Terms for probability (e.g. probable, almost certain) and impact (e.g. insignificant, major) areambiguous and subjective.Impact can be represented by a range of values that can not be put into specific impact levelsuch as “moderate impact on time.”Critical success factors such as agreed definitions and terms reflect stakeholders’ risk toleranceand thresholds.Values used in the definitions represent the same level of impact across objectives as perceivedby the management or stakeholders.Consistent use of agreed-upon terms and definitions across all identified risks.The probability of a risk occurring can be specified by assigning levels of risk probability byranges of probability.Risk estimation in terms of probability and impact helps the subject experts to assess a risk’sprobability within a range rather than as a specific value.Impact level definitions are project-specific.The values used to specify the level of impact from very low to very high (if a 5*5 matrix is beingused) should be:oHigher impact, for threats and opportunities, as they move from very low to veryhigh for a specific objective. 2012 RMstudy.comPage 6 of 12
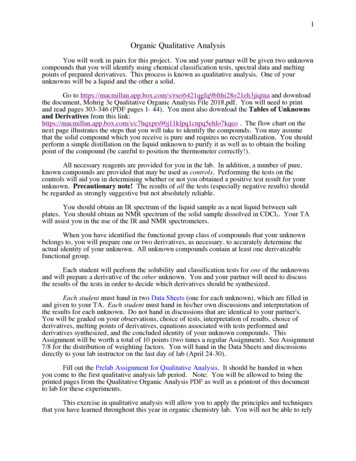
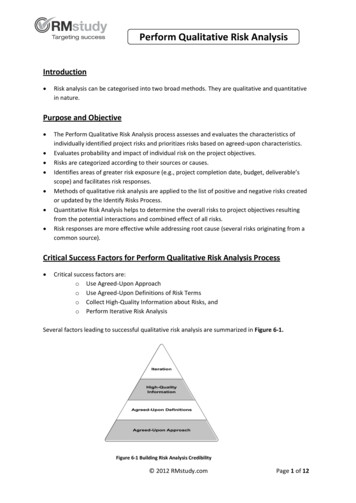
Perform Qualitative Risk AnalysisoLevels are defined by the organization as causing the same amount of pain orgain to the project for each level across objectives.oIf a risk’s possible impact is uncertain and could be assigned to more than onelevel of impact (e.g. from moderate to high), the analyst may choose to assignthe risk to the impact level that represents the expected or average impact.oThe risk may be flagged for extra analysis in order to reduce the range ofuncertainty to fit within a single range.An example of impact level definitions is shown in Figure: D11. These definitions should be tailoredfor opportunities and threats and scaled by stakeholders to the specific project.SCALEPROBABILIY - IMPACT ON PROJECT OBJECTIVESTIMECOSTQUALITYVHI61-99% 40 days 200KVery significant impact on overall functionalityHI41-60%21-40 days 101K- 200KSignificant impact on overall functionalityMED21-40%11-20 days 51K- 100KSome impact in key functional areasLO11-20%6-10 days 11k- 50KMinor impact on overall functionalityVLO1-10%1-5 day 1K- 10KMinor impact on secondary functionsNIL 1%No changeNo changeNo change in functionalityFigure 6.4: Example of Definitions for Levels of Probability and Impact on Four Specific Objectives Used to EvaluateIndividual Risks.Note: Opportunities are to be treated as representing a positive saving in time or cost, or increasedfunctionality. For threats, each impact scale is interpreted negatively, i.e. time delays, increased cost,or reduced functionality.3. Post-project reviews/ Lessons Learned/ Historical Information: The review of risk databases of previous projects, such as those that arise from post-projectreviews or lessons learned exercises or historical information within an organization or industrycan reveal information relevant for a current project. This technique leverages previous experience, and prevents the occurrence of the samemistakes or missing the same opportunities again. 2012 RMstudy.comPage 7 of 12
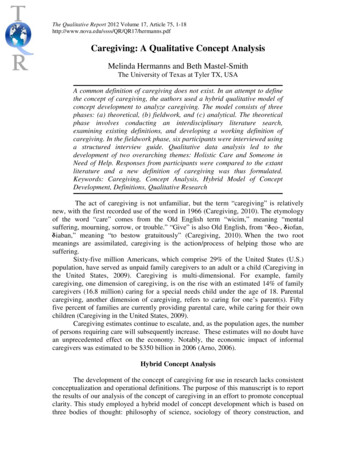
Perform Qualitative Risk Analysis Participation of previous project team members and a well-structured project lessons databaseincreases the effectiveness of this technique. Disadvantages:ooOnly those risks that have occurred previously can be identified.The information available may also be incomplete with no details on ineffectivestrategies, lack of details of successful resolution etc.4. Probability and Impact Matrix (P-I Matrix): Allows the organization to prioritize the project risks for further analysis (e.g. quantitative) orrisk response. Reflects the organization’s level of risk tolerance. Critical success factors include clear and unambiguous input data for assigning levels ofprobability and impact. Effective estimation of impact and likelihood of risks. Organizations should be careful to assess the combinations of probability and impact that qualifya risk as low, moderate or high risk so that the method used reflects the organization’s riskattitude. Definitions used to designate the levels of impact (L, M, H) for each objective should representthe same level of impact as perceived by the organization’s management or project stakeholdersas reflecting the organization’s utility function. Drawbacks include inefficiency in handling risk ranking factors such as urgency or manageabilityand the range of uncertainty in the assessment of a risk’s probability or impact overlapping aboundary. 2012 RMstudy.comPage 8 of 12
Perform Qualitative Risk AnalysisProbability and Impact Risk WVLOWImpact (Threats)VLOWImpact (Opportunities)Figure 6.5: Example of Probability-Impact Matrix Used to Sort Risks (Threats and Opportunities) into High Risk (H),Moderate Risk (M), and Low Risk (L) Classes.5. Analytic Hierarchy Process (AHP): Assists in developing a relative weighing for project objectives that reflects the organization’spriorities for time, cost, scope, and quality for the project. Assists the creation of an overall project priority list of risks with respect to individual objectives.This prioritization determines how trade-offs affect different objectives. Critical success factors for the effective application of this method include: it acts as an expertfacilitator in the process, agreement by management that it is useful to develop a consistent setof priorities among objectives, and use of proper method or available AHP software. Weaknesses include organizational decisions often made by committees than individuals anddifficulty in gathering information about pair-wise comparison of the objectives from high-levelmanagement. 2012 RMstudy.comPage 9 of 12
Perform Qualitative Risk AnalysisA spread sheet implementation is given below:Preference Factors1Equally Preferred2Mildly Preferred3Moderately Preferred4Greatly Preferred5Always PreferredInput Matrix (Preference 4.004.001.00Note: Preference factors input is given in Blue color. Principal Diagonal is 1.0 by definition. Other cellscalculated as 1/ preference factor for same objectives.Calculated Factors (Preference Factor / Column Total)Weighting FactorsCostTimeScopeQualityAverage of um13.006.256.331.701.0Figure 6.6: Example of Analytic Hierarchy Process Computations to Determine the Relative Weighting of Four ProjectObjectives. 2012 RMstudy.comPage 10 of 12
Perform Qualitative Risk AnalysisTerms and Concepts1. Contingency reserve: The amount of funds, budget, or time needed above the estimate toreduce the risk of overruns or project objectives to a level acceptable to the organization.2. Effect: Conditional future events or conditions which would directly affect one or more projectobjectives if the associated risk happened.3. Impact: A measure of the effect of a risk on one or more objectives if it occurs. Also known asconsequence.4. Implementation: The realization of an application, or execution of a plan, idea, model, decision,specification, standard, algorithm or policy. Various steps involved are often overseen by aproject manager using project management methodologies set forth in the ProjectManagement Body of Knowledge.5. Iteration: The act or repeating the process usually with the aim of approaching a desired goal ortarget or result.6. Likelihood: See probability7. Objectives: Something toward which work is to be directed, a strategic position to be attainedor a purpose to be achieved, a result to be oriented, a product to be produced, or a service tobe performed.8. Perform Qualitative Risk Analysis: The process of prioritizing risks for further analysis or actionby assessing and combining their possibility of occurrence and impact.9. Prioritization: Identification of project priorities which allows clarifying ranking of tasks andunderstanding how these tasks will be executed throughout the life-cycle of the project. Ithelps the project manager and team to clearly see the project goals and objectives.10. Probability: A measure of how likely an individual risk is to occur. Also known as likelihood.11. Risk: An uncertain event or condition that, if it occurs, has a positive or negative effect on aproject’s objectives.12. Risk Breakdown Structure (RBS): [Tool] A hierarchically organized depiction of the identifiedproject risks arranged by risk category and subcategory that identifies the various areas andcauses of potential risks. It is tailored to specific project types.13. Risk Register: The document containing the results of the qualitative risk analysis, quantitativerisk analysis, and risk response planning. 2012 RMstudy.comPage 11 of 12
Perform Qualitative Risk Analysis14. Root Cause: An initiating cause that gives rise to a causal chain which may give rise to risks.15. Scalability: It is the ability of a system or component to accommodate greater demand whilemaintaining an acceptable response time for users. It is an important factor for projectmanagement anticipating for future growth.16. Stakeholder: Person or organization (e.g., customer, sponsor, performing organization, or thepublic) that is actively involved in the project, or whose interests may be positively ornegatively affected by execution or completion of the project. A stakeholder may also exertinfluence over the project and its deliverables. 2012 RMstudy.comPage 12 of 12
4. Probability and Impact Matrix (P-I Matrix): Allows the organization to prioritize the project risks for further analysis (e.g. quantitative) or risk response. Reflects the organization’s level of risk tolerance. Critical succe