Transcription
Adam L. Berger, CFA*Vice President, Head of Portfolio SolutionsAQR Capital Management, LLCSUMMER 2009Ronen IsraelPrincipalAQR Capital Management, LLCTobias J. Moskowitz, Ph.D.Fama Family Professor of FinanceBooth School of Business, University of ChicagoThe Case for Momentum InvestingThough known to financial academics for many years, momentum is for most investorsthe "undiscovered style,” a valuable tool in building diversified portfolios with aboveaverage returns.Definition. Momentum is the tendency of investments to exhibit persistence in theirrelative performance. Investments that have performed relatively well, continue to performrelatively well; those that have performed relatively poorly, continue to perform relativelypoorly. Momentum is about much more than buying a handful of hot stocks – it is adisciplined, systematic investing style that applies across asset classes.Intuition. Momentum is a phenomenon driven by investor behavior: slow reaction tonew information; asymmetric responses to winning and losing investments; and the"bandwagon” effect. Numerous academic and practitioner studies have confirmedmomentum’s existence.Implications. Virtually all investors can expect higher risk-adjusted returns by addingmomentum to their portfolios. Growth investors will see that momentum delivers muchbetter performance. Value investors will find momentum to be an effective complement.Value-growth investors will want to consider momentum as an alternative to their growthallocation.This paper introduces a family of investable momentum indices, and in so doing, opensthis powerful strategy to a broad range of investors.ACKNOWLEDGEMENTS: We would like to thank our AQR colleagues whose extensive contributions, insights and research made thispaper possible: Michele Aghassi, Gregor Andrade, Cliff Asness, Brian Crowell, Andrea Frazzini, Jacques Friedman, Marco Hanig,Sarah Jiang, David Kabiller, Lars Nielsen, Lasse Pedersen, Prasad Ramanan, Sharon Song, London Thomson-Thurm, and Dana Wolf.*Adam Berger can be reached by email: adam.berger@aqr.com
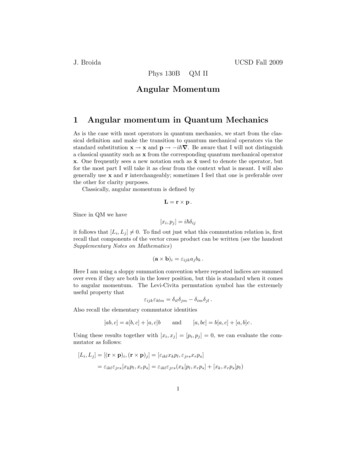
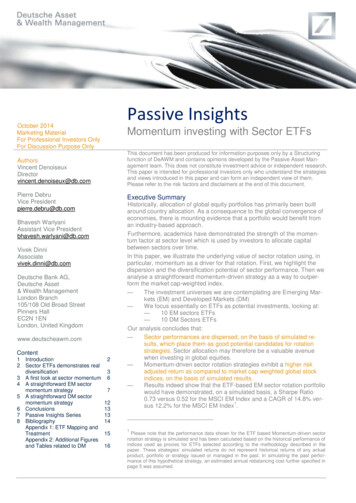
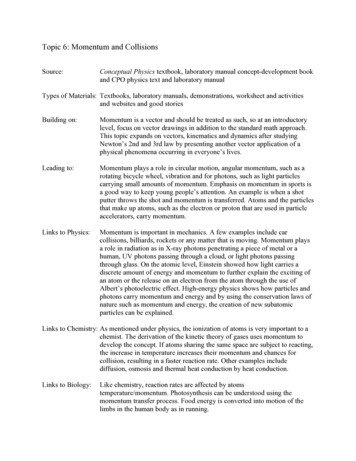
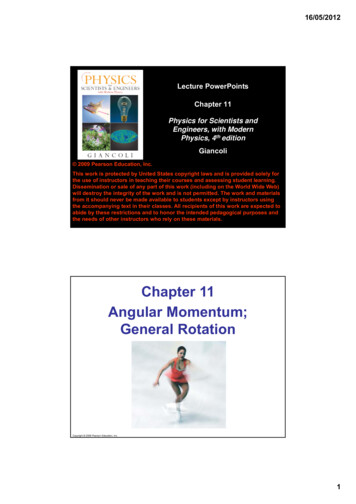
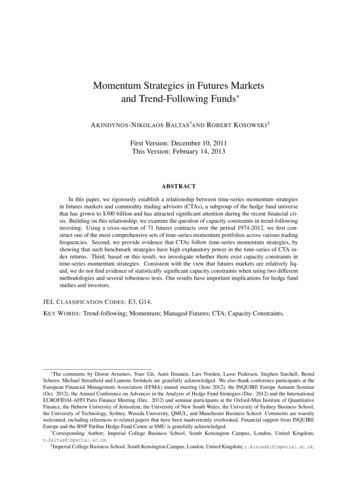
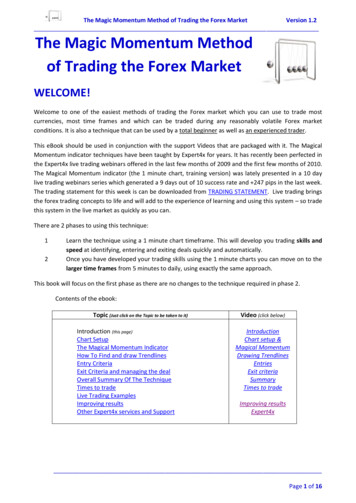
PART I – WHAT IS MOMENTUM?published papers have explored momentum since, including150 in the last five years.Momentum is the tendency of investments, in everymarket and asset class, to exhibit persistence in theirrelative performance for some period of time.EXHIBIT 1 shows the performance of individual U.S.stocks broken into quintiles. Over the next year, thestocks with the best momentum (P5) outperform theones with the worst momentum (P1), both in absoluteterms and relative to the equity market as a whole.When applied to stock picking, momentum (like valueor growth) is about relative performance among stocks,and not about overall trends in the market. It workswhether a market is in an upswing or downswing.Momentum can be used to identify securities likely tooutperform, making it a powerful investment tool. It isalso negatively correlated to value investing, making itan effective diversification component. Regardless ofinvestment philosophy, virtually all investors can expectimproved risk-adjusted returns by including momentum.Historical EvidenceThe evidence for momentum is pervasive, supported byalmost two decades of academic research. The first modernstudies were done in the early 1990s, 1 and more than 300The original momentum studies focused on the periodfrom 1963-1990 in U.S. equities. Subsequent studies havefound momentum in earlier periods 2 (as far back as theVictorian age!) and in the out-of-sample period after theoriginal research was published. 3 Evidence supportsmomentum in markets outside the U.S. 4 and for assetsother than individual stocks, such as industries, bonds,commodities, currencies, and global stock market indices. 5EXHIBIT 2 shows evidence for momentum in a range ofglobal asset classes and markets. Since these are long-shortreturns, they are independent of gains from market exposure.Momentum delivers attractive Sharpe ratios (risk-adjustedreturns) universally.Exhibit 1: Performance of Stocks with Good and Bad MomentumAverage Annual Returns for Portfolios Grouped by Momentum(January 1927 to December 2008)Annual Return in Subsequent 12 Months (%)201510Average Return of Each Quintile5Excess Return of Each Quintile*0-5-10P120% of stocks withWorst MomentumP2P3P4P520% of stocks withBest MomentumSource: AQR Capital Management. Data is based on monthly returns from overlapping portfolios. Momentum is calculated as the past 12-month return excluding themost recent month. *Return in excess of the beta-adjusted CRSP Value Weighted Index.1Jegadeesh and Titman (1993), Asness (1994)Chabot, Ghysels, and Jagannathan (2009), Grundy and Martin (2001)3 Carhart (1997), Jegadeesh and Titman (2001), Asness, Moskowitz, and Pedersen (2009)4 Europe: Rouwenhorst (1998), Emerging markets: Rouwenhorst (1999), Asia: Chui, Titman, and Wei (2000), Globally in 40 different equity markets: Griffin, Ji, and Martin (2005)5 Asness, Moskowitz, and Pedersen (2009), Industries: Moskowitz and Grinblatt (1999 and 2004), Asness, Porter, Stevens (2000), Countries: Asness, Liew, and Stevens (1997)22 F O R I N V E S T M E N T P R O F E S S I O N A L U S E O N LYPlease read important disclosures at the end
Possible Explanations of MomentumThere are several possible explanations for momentum.One is that momentum’s higher returns are compensationfor some unique risk associated with investments thathave recently outperformed. As of yet, no such risk factorhas been convincingly identified. If it is not compensationfor risk, the existence of momentum seems to challengethe efficient market hypothesis that past price behaviorprovides no information about future behavior. 6 In otherwords, momentum is associated with some inefficiency inmarkets, perhaps due to investor behavior. Severalpossible behavioral explanations have been put forth. 7First, investors may be slow to react to new information.Efficient market theory assumes that once new informationis released, it is instantly available to all investors andthat prices immediately adjust to reflect the news. Inpractice, however, different investors (for example, atrader versus a casual investor) receive news from differentsources, and react to news over different time horizonsand in different ways. Also, anchoring and adjustment is abehavioral phenomenon in which individuals update theirviews only partially when faced with new information,slowly accepting its full impact. There is ample evidencesupporting slow-reaction-to-information theories, rangingfrom market response to earnings and dividendannouncements to analysts’ reluctance to update theirforecasts.Second, investors (as human beings) are prone to whatbehavioral economists and experimental psychologistscall the disposition effect . Investors tend to sell winninginvestments prematurely to lock in gains, and hold on tolosing investments too long in the hope of breaking even.The disposition effect creates an artificial headwind:when good news is announced, the price of an asset doesnot immediately rise to its value because of prematureselling. Similarly, when bad news is announced, the pricefalls less because investors are reluctant to sell. 8Third, investors are susceptible to the bandwagon effect(also called over-reaction ). Short-term traders may userecent performance as a signal to buy or sell. Longer-terminvestors look to recent performance to confirm theirconvictions. The interaction between these investors cancreate price run-ups or -downs that can persist for manymonths until an eventual correction. 9 Notable extremeexamples include the technology bubble of the late 1990sand the energy rally of 2007-2008.There continues to be a lively debate about the root causesof momentum. (A similar debate is ongoing for valueinvesting as well). What is clear is that the overwhelmingevidence from a range of markets, asset classes, andtime periods supports the argument that momentum isneither a random occurrence nor an effect that disappearsonce the impact of transaction costs is incorporated.Exhibit 2: Historical Performance of Momentum Across Asset ClassesSharpe Ratio of aLong-ShortMomentum StrategyAnnualized Return of aLong-ShortMomentum StrategyTime PeriodStudiedIn Individual StocksUSUKJapanContinental EuropeStock Markets 5%1975-20081985-20081985-20081988-20081988-2008In Other Asset ClassesBond Markets (Developed)Currencies (Developed)CommoditiesEquity Indices (Developed)Other Assets ce: Asness, Moskowitz, and Pedersen (2009). The above uses a long-short portfolio to isolate the returns to momentum strategies from their respective directionalmarket returns. Hypothetical long-short back-test where each momentum portfolio is scaled to an estimated 15% annualized volatility based on either AQR or BARRA riskmodels; gross of transaction and financing costs. (Based on our research, adding transaction and financing costs would not have a significant effect on the results shown.)6 The past performance of different investments is not a secret. If markets are efficient, this information should be fully incorporated into market prices, and no one should be able to profitby investing in stocks or other investments that have done well recently. The existence of momentum implies that stocks do not (as widely believed) move in a "random walk."7 Many of these explanations are based on the Nobel-prize winning work of Daniel Kahneman and the late Amos Tversky. See, for example, Kahneman and Tversky (1979).8Research in behavioral finance shows a strong tendency for retail investors and even mutual fund managers to exhibit the disposition effect. See Odean (1998) and Grinblatt and Han(2005) for retail investors and Frazzini (2006) for managers.9 Although these corrections can lead to short-term losses for momentum, our research suggests that equity momentum strategies do not have larger or more frequent drawdowns thanother equity styles (value, growth, and core).F O R I N V E S T M E N T P R O F E S S I O N A L U S E O N LYPlease read important disclosures at the end 3
Time HorizonsReaders may note that momentum may be caused by bothan under-reaction to information (slow assimilation ofnews) and an over-reaction (the bandwagon effect), whichwould perhaps seem to cancel each other out. In fact, theunder-reaction and over-reaction may reinforce oneanother since they typically operate over different timehorizons. Momentum may be initiated by slow reaction toinformation, caused or sustained by behavioral biases likethe disposition effect, then reinforced by the bandwagoneffect over several months. The net result is that momentumwill persist for a period of time (6-12 months) beforeultimately leading to reversals as too many investors pileon and prices become detached from fundamentals.the last five years will do so over the next five years.Indeed, on a five-year horizon we find the opposite effectin the data. Stocks that outperform for a long period oftime will generally become expensive, and expensivestocks tend to under-perform less expensive stocks. Thisis the value effect, and long-run past performance is agood (backwards!) value indicator. 10 However, theevidence does show that assets that have performed wellover the last 12 months tend to do better over the next 312 months than assets that have performed poorly overthat same period. This is the time horizon in whichmomentum works best.Consistent with this intuition, investments do not exhibitmomentum over just any time horizon. For instance, wecannot say that the stocks that have performed best overPART II – INTRODUCING THE AQR MOMENTUM INDICESFor an idea with so much support from academic researchand historical evidence, momentum has made surprisinglymodest inroads into investors' portfolios. Contrast thiswith value and size (large cap vs. small cap). There arehundreds of investment funds focused on each of thesestyles, but hardly any based purely on momentum.One contributing factor is the lack of a momentum index.Academic research on value and size spawned a numberof value and market capitalization indices, such as theS&P and Frank Russell indices. But there are nocomparable equity momentum indices. At the time ofFama and French’s original work on value and size,momentum research was in its infancy. 11 Today, over adecade later, momentum is part of virtually every academicmodel and empirical study related to asset pricing. 12We feel momentum is at a point in its history not unlikevalue and growth two decades ago: backed by overwhelmingevidence, but with no real benchmark or index to follow.Now is the time to provide such an index, to givewidespread access to this important investment style.AQR Momentum Indices: MethodologyAQR has developed an index methodology that capturesmomentum in an intuitive and transparent way, making itaccessible to all investors. For the U.S. market, we havecreated two momentum indices: 13 The AQR Momentum Index( Large Cap and Mid Cap U.S. Equities ) The AQR Small Cap Momentum Index( Small Cap U.S. Equities )Determining the Universes. The AQR indices are builtfrom two distinct universes. For the large and mid capU.S. index, we examine the 1,000 largest stocks bymarket capitalization. For the small cap U.S. index, welook at the next 2,000 largest stocks. The universes arescreened using certain liquidity and other criteria.10Stocks that have performed relatively well over a 5-year period tend to have poor value and therefore perform relative poorly going forward, as shown by DeBondt and Thaler (1985) andFama and French (1996).11 In their subsequent study on value and size, Fama and French acknowledged that the “main embarrassment of the three-factor model [is] its failure to capture the continuation of shortterm returns of Jegadeesh and Titman (1993) and Asness (1994) [later to be known as the momentum effect]” (Fama and French, 1996).12 This includes the recent study of Fama and French (2008), who start by noting that "the anomalous returns associated with. momentum are pervasive."13 There is also an AQR International Momentum Index (Non-U.S. Equities). This paper focuses on the U.S. indices for ease of exposition, but the international evidence is similar.4 F O R I N V E S T M E N T P R O F E S S I O N A L U S E O N LYPlease read important disclosures at the end
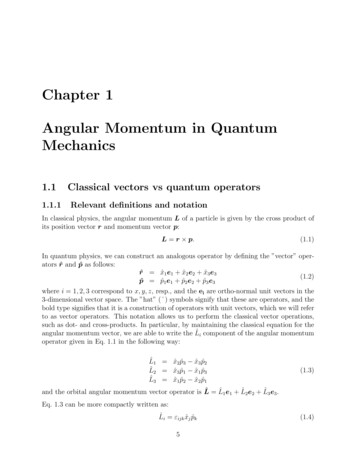
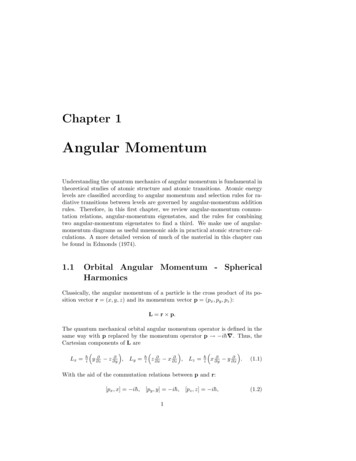
Identifying Momentum. We determine momentum bylooking at the total return of every stock in each universeover the past year. 14 As previously discussed, momentumis based on relative rather than absolute performance. Ina sharply falling market, virtually all stocks may have lostmoney in the last year; in this instance, the stocks withthe strongest momentum will be those that fell the least.Setting the Constituents. Once we have ranked the stocks,we construct the index from the one-third with thestrongest momentum. Within each index, we weight thestocks according to their market capitalization.Rebalancing. Because momentum is based on recent performance, we need to adjust our indices fairly frequently(compared to a value index, for example). Rebalancing ona quarterly basis maintains the momentum characteristicbut does not erode returns through excessive trading.AQR Momentum Indices: PerformanceEXHIBITS 3 and 4 show the performance of the AQRMomentum Index and the AQR Small Cap MomentumIndex relative to a variety of other indices for comparisonpurposes. A few key results stand out:Performance. The AQR Momentum Indices each outperform a comparable core index over the period studied.They also outperform other investment styles such asvalue and growth.Volatility. The AQR Momentum Indices are somewhatmore volatile than the comparable core and value indices,but are similar to growth indices.Sharpe Ratio. The Sharpe ratios of the AQR MomentumIndices are higher than their comparable core andgrowth indices, and similar to those of value indices. Relativeto a comparable core equity index, the information ratiosExhibit 3: Performance of the AQR Momentum IndicesJanuary 1980 - April 2009Annual ReturnAnnualized VolatilitySharpe RatioAQRMomentum Index13.7%18.6%0.38Excess Return over Russell 1000Tracking Error to Russell 1000Information RatioCorrelation to Momentum Index2.5%8.1%0.301.00Estimated Transactions Costs0.7%Russell 1000Value Index11.7%14.9%0.350.5%5.1%0.10-0.50AQR Small CapMomentum Index15.4%22.2%0.40Russell 2000Value Index12.8%17.1%0.36Excess Return over Russell 2000Tracking Error to Russell 2000Information RatioCorrelation to Momentum Index4.2%7.0%0.601.001.6%6.2%0.25-0.58Estimated Transactions Costs1.5%Annual ReturnAnnualized VolatilitySharpe RatioRussell 1000Growth Index10.6%18.0%0.23Russell 1000Index11.2%15.7%0.30-0.6%4.9%-0.130.43Russell 2000Growth Index9.6%23.0%0.13Russell 2000Index11.2%19.5%0.24-1.6%5.7%-0.290.51Source: AQR Capital Management. Given that the core research on momentum was published in the early 1990s, a large portion of the results shown here are out-of-sample.AQR Momentum Indices are historical indices and not the returns to actual portfolios.14Note, in calculating the return, we exclude the most recent month to avoid situations in which a stock that has moved sharply in the very short term may be due for a correction. There isevidence across a range of asset classes that sharp, short-term changes in price may be caused by liquidity effects and tend to reverse themselves. Jegadeesh (1990), Lo and MacKinlay(1990), and Lehmann (1990) find strong short-term (one-day to one-month) reversals among stocks. Most academic studies of momentum also exclude the most recent month (see Asness(1994) and Fama and French (1996) for early examples). Excluding the most recent month also lowers the turnover of the index.F O R I N V E S T M E N T P R O F E S S I O N A L U S E O N LYPlease read important disclosures at the end 5
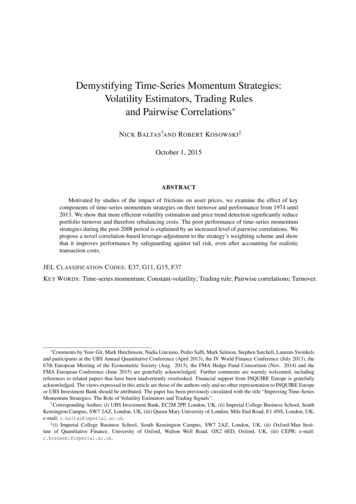
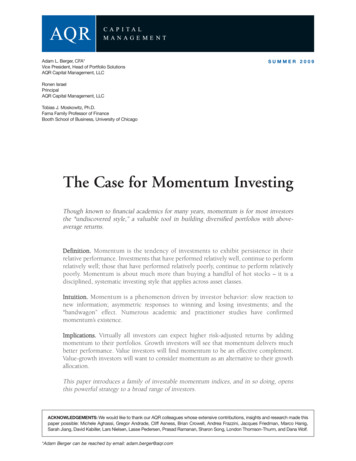
important, and we have included an estimate of thesecosts for the AQR Momentum Indices. The costs are notinsignificant (0.7% annually for large cap and 1.5% forsmall cap), but they are not high enough to materiallychange the attractiveness of momentum, both in absoluteterms and relative to value and growth.of the AQR Momentum Indices are higher than those ofgrowth and value indices.Correlation. The excess returns of the AQR MomentumIndices (over a core equity index) are positively correlatedto the excess returns of a comparable growth index, andnegatively correlated to the excess returns of a comparablevalue index (see EXHIBIT 4). As we will show in the nextsection, these correlations make momentum a better alternative to growth and an attractive complement to value.Backtests do have inherent limitations. However, basedon the historical evidence from academia, the wealth ofout-of-sample evidence from other time periods and assetclasses, along with AQR's experience with momentumbased strategies for over a decade, we are confident thatour indices capture the characteristics of momentuminvesting.Transaction Costs. In EXHIBIT 3, neither the AQRMomentum Indices nor the comparison indices reflectany transaction costs. However, transaction costs areExhibit 4: Comparing Momentum to Growth and ValueAnnual Excess Returns of AQR Momentum Index and Russell 1000 Growth Index30%Correlation: 0.420%10%AQR Momentum IndexRussell 1000 Growth 986198519841983198219811980-20%Annual Excess Returns of AQR Momentum Index and Russell 1000 Value Index30%Correlation: -0.520%10%AQR Momentum Index0%Russell 1000 Value 6198519841983198219811980-20%Source: AQR Capital Management. January 1980 to December 2008. Returns are excess to Russell 1000 Index. AQR Momentum Index is a historical index and does notrepresent the returns t
Hypothetical long-short back-test where each momentum portfolio is scaled to an estimated 15% annualized volatility based on either AQR or BARRA risk models; gross of transaction and financing costs. (Based on our research, adding transaction and financing costs w