Transcription
The Magic Momentum Method of Trading the Forex MarketVersion 1.2The Magic Momentum Methodof Trading the Forex MarketWELCOME!Welcome to one of the easiest methods of trading the Forex market which you can use to trade mostcurrencies, most time frames and which can be traded during any reasonably volatile Forex marketconditions. It is also a technique that can be used by a total beginner as well as an experienced trader.This eBook should be used in conjunction with the support Videos that are packaged with it. The MagicalMomentum indicator techniques have been taught by Expert4x for years. It has recently been perfected inthe Expert4x live trading webinars offered in the last few months of 2009 and the first few months of 2010.The Magical Momentum indicator (the 1 minute chart, training version) was lately presented in a 10 daylive trading webinars series which generated a 9 days out of 10 success rate and 247 pips in the last week.The trading statement for this week is can be downloaded from TRADING STATEMENT. Live trading bringsthe forex trading concepts to life and will add to the experience of learning and using this system – so tradethis system in the live market as quickly as you can.There are 2 phases to using this technique:12Learn the technique using a 1 minute chart timeframe. This will develop you trading skills andspeed at identifying, entering and exiting deals quickly and automatically.Once you have developed your trading skills using the 1 minute charts you can move on to thelarger time frames from 5 minutes to daily, using exactly the same approach.This book will focus on the first phase as there are no changes to the technique required in phase 2.Contents of the ebook:Topic (Just click on the Topic to be taken to it)Introduction (this page)Chart SetupThe Magical Momentum IndicatorHow To Find and draw TrendlinesEntry CriteriaExit Criteria and managing the dealOverall Summary Of The TechniqueTimes to tradeLive Trading ExamplesImproving resultsOther Expert4x services and SupportVideo (click below)IntroductionChart setup &Magical MomentumDrawing TrendlinesEntriesExit criteriaSummaryTimes to tradeImproving resultsExpert4xPage 1 of 16
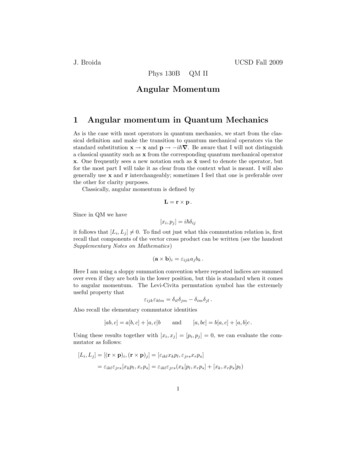
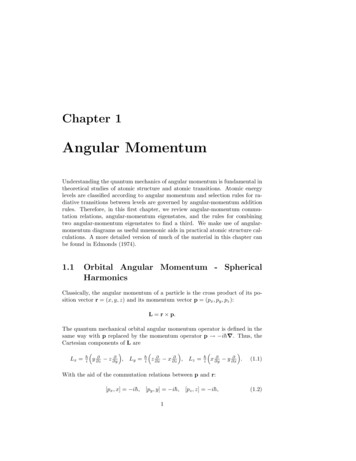
The Magic Momentum Method of Trading the Forex MarketVersion 1.2CHARTSYou can use any charting system you wish in order to trade this technique, as long as you can createcandlestick charts with an RSI (Relative Strength Indicator) indicator as shown below.When using charts to trade the Forex market there are normally 2 sections to the charts.1. The 1st section where the price movement is shown (normally using candle sticks) and2. the second part (which is normally located below the price section) is the indicator section wheresome independent indicators are shown.In this eBook we use MetaTrader charts as Metatrader has a very large market share and you canaccess these charts for free by applying for a demo account from any Metatrader Broker.Page 2 of 16
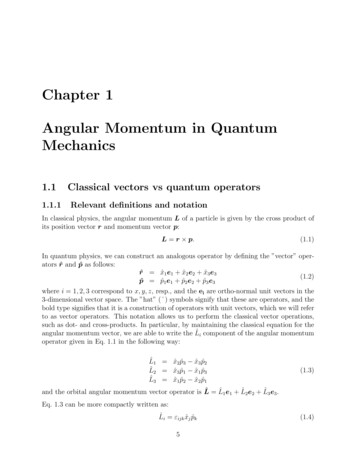
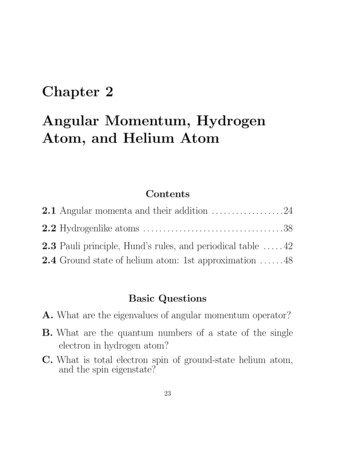
The Magic Momentum Method of Trading the Forex MarketVersion 1.2THE MAGIC MOMENTUM INDICATORWe use the Relative Strength Index (RSI) momentum indicator as our prime indicator when trading the 1Indicator Simple Way of trading the Forex Market. This indicator measures the momentum present in themarket – this means that it shows who is in charge – the bulls or the bears. When the bulls are in chargethe market is in a Buy phase and when the bears are in charge the market is in a Sell phase.The RSI that we use has a setting of 4. This means that the position of the indicator reading is based on themomentum information 4 candles or time frames back. If we were to increase the setting to say 14 theindicator can become very flat and difficult to read. If we decrease the setting to 2 then the indicatorbecomes too sensitive and the readings become meaningless. So over time a setting of 4 has served us well.We also set 3 levels on the indicator. The 25, 50 and 75 levels. We will explain how these levels are usedlater in this eBook.In the gold rush days in the USA they had bull and bear fights. The bull attacked by using its horns, strikingand swinging them upwards (Buy market). The bears used their great big paws to push down on the enemy(Sell market) – so that’s where those expressions come from.So, naturally when the bulls are in charge we want to be in a buy transaction and when the bears are incharge we want to be in a sell transaction. This indicator tells us who is in charge.In a normal sideways market the 50 or middle line on the indicator separates the bull (Buy) area from thebear (Sell) area. Above that line is the buy area and below the line is the sell area.Page 3 of 16
The Magic Momentum Method of Trading the Forex MarketVersion 1.2Sometimes the bulls are so strongly in charge in an upward trending market that we credit them with morethan 50% of the area. We allocate 75% of the area to them (everything above the 25% line) as they havebeen so dominant that the bears will take some time to recover their strength. So only when the indicatordrops below the 25% line will we consider as a sellSometimes the Bears are so strongly in charge in a downward trending market that we credit them withmore than 50% of the area. We allocate 75% of the area to them (everything below the 75% line) as theyhave been so dominant that the bulls will take some time to recover their strength. So only when theindicator goes above the 75% line will we consider as a buyAs you can see by adopting this dynamic bull and bear area approach, it keeps us “in the trend” longer andtherefore creates less whipsaws (unnecessary and unprofitable buy and sell transactions). It also turns amomentum indicator which normally is best used in a sideways market, into a trending indicator at thesame time.Page 4 of 16
The Magic Momentum Method of Trading the Forex MarketVersion 1.2When the indicator moves from (say) a sell area to the buy area, it is a signal that we should considerchanging from a sell (if we were in one) to a buy transaction or entering a buy.Remember that this technique is all about making sure that you (your transaction) are facing in the rightdirection when a trend develops. When you are is such a trend the technique applies risk management thatis aimed at ensuring that you stay in the trend on hopefully a risk free basis. See how this is done later inthe ebook.Page 5 of 16
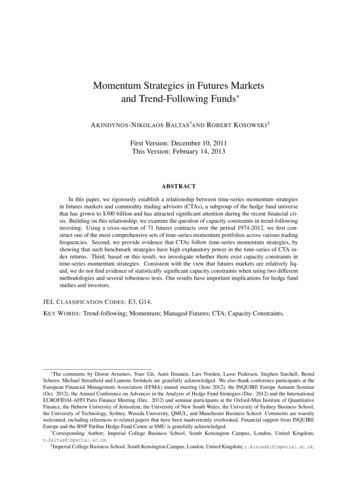
The Magic Momentum Method of Trading the Forex MarketVersion 1.2TRENDLINESThe RSI indicator measures momentum which is the same as the market sentiment. However the pricechart always reflects reality. So the momentum indicator on its own is not enough to be the main trigger fora transaction. It merely provides the motivation and evidence for a transaction but the main trigger toenter deals comes from the Price chart when trendlines are violated.We like to use trendline violations by the price as the main trigger to enter transactions (deals). A trendlineis nothing more than joining a number of swing lows to produce a support trendline. When using swinghighs in the same way it creates a resistance trendline.Trendlines can also be drawn on the RSI indicator. The bigger the angle of the trendline the more aggressive(less reliable) the trendline becomes. The purple lines below are less aggressive than the red lines whichhave been drawn at steeper angles.Often trendlines on the RSI warn us that we should be looking for aggressive trendlines on the price chart.Our main method of entry is when the price crosses over a price trendline after being warned about it bythe RSI crossing over an RSI trendline or over the buy / sell dividing line.Remember that this technique is all about making sure that you (your transaction) are facing in the rightdirection when a trend develops. When you are is such a trend the technique applies risk management thatis aimed at ensuring that you stay in the trend on hopefully a risk free basis. See how this is done later inthe bookPage 6 of 16
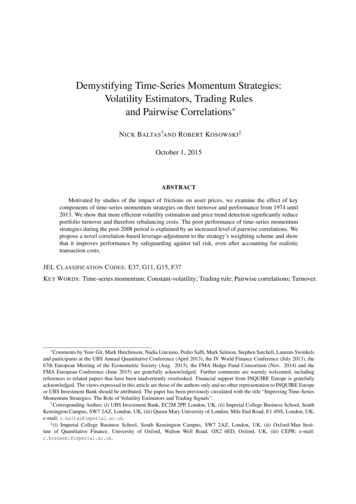
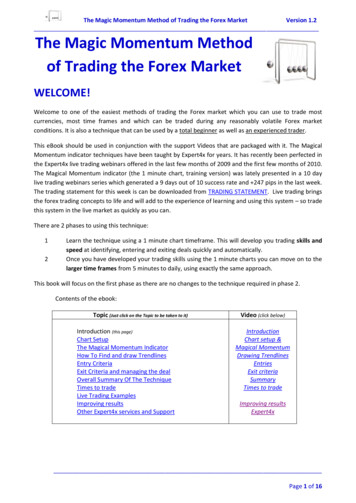
The Magic Momentum Method of Trading the Forex MarketVersion 1.2THE TRADING TECHNIQUEThe EntryThe system basically works like this:1. When the RSI starts showing a move from (say) the buy area to the sell area and/or has atrendline violation, we would immediately look for2. A trendline on the price chart which is being violated (if we have not already drawn one in). Asthe trendline is violated we would then enter a sell transaction. In a fast moving (volatile) marketwe will enter immediately. In a slow market we may wait for more confirmation by waiting for the1 minute candle to close and a new 1 minute candle to open.Below is an example of a sell transaction.See more examples later in the book. This system can be a continuous system in that the entry triggers canalso be the exit triggers for a previous transaction. The exit trigger for one transaction can also be the entrytrigger for the next transaction.Page 7 of 16
The Magic Momentum Method of Trading the Forex MarketVersion 1.2MANAGING AND EXITING DEALSYou can use any broker that gives you competitive spreads and easy processing. We use FXCM MICRO whogenerally gives us a 2.8 spread on the GBPUSD and 1 click processing. This means that we can enter amarket order with a stop and a target using the number of lots we want to trade in 1 click. They are thebest in the market at the moment. This system will work with any broker that is competitive and easy touse.Based on the 1 minute chart method we trade with a 16 pip stop loss (sometimes 14 in a nicely movingmarket) and no target. The stop loss should be implemented at the same time or immediately afterentering. Experienced and disciplined traders can trade with a mental stop if they have confidence to do so.Sometimes deals just do not perform as expected and may not even go positive and will be stopped out at 16 pips. If this happens we just have to wait for the next trading signal.Using this method you will find that your stop is seldom hit as you are more likely to change the direction ofyour trade before it reaches your 16 pips stop. The stop includes the spread so if the spread is 2.8 youreffective stop is only 13.2 pips (16 pips less the spread of 2.8).Once a deal is active and going positive we manage the transaction in a number of ways depending on thetrading conditions. Based on the 1 minute chart method we could use any of the techniques below. You could close the transaction the minute you see a strong signal to trade the other way. This is avery common reason to exit at either a profit or a loss and this reason also prevents your stop lossbeing hit.You could close 50% of the transaction at between 5 and 10 pips and move the stop tobreakeven thereby creating a risk free deal for the remaining 50%. Hopefully you will have caught atrend and the price will continue to trade away from the entry price.You could close 50% of the transaction at between 5 and 10 pips and move the stop to -4 or -9.This ensures a small profit if your stop is reached but gives the transaction enough room to becomepart of a larger trend. Hopefully you will have caught a trend and the price will continue to tradeaway from the entry price.You could close the entire transaction at say 10 or 15 if that is what you would be happy with.If you have caught a trend (the price has gone 15 pips on the 1 minute chart) You could use the RSI 75% or 25% exit method (See later in the book)You could use the 15 Moving average crossover method (see later in the book)When trading the 1 minute chart, experiment with these exit techniques to find the conditions which makeeach better to use.Please review the trading session examples later on in the eBookPage 8 of 16
The Magic Momentum Method of Trading the Forex MarketVersion 1.2ALTERNATIVE EXIT TECHNIQUESThe signals and triggers used to enter this technique are also very good exit signals. Besides being signals toexit trades they can be used to enter the next transaction too.The idea behind this technique is actually to make sure that your transaction is pointing in the rightdirection when a good trend occurs and to stay in the transaction as long as the trend continues.The 1 minute chart is a very sensitive chart and ideally it should best be used as an entry chart to enterlonger and stronger trends. An advanced exit technique is to use a moving average crossover to exit a tradeentered on the 1 minute chart. In this respect the 15 period, smoothed, moving average based on the closeprice can be used.This advanced exit technique will only be used once you are happy with the basic approach.The way of adjusting the bull and bear areas as discussed previously comes close to achieving the sameresult as using the above moving average.Page 9 of 16
The Magic Momentum Method of Trading the Forex MarketVersion 1.2BEST TIMES TO TRADERemember that this technique is all about making sure that you (your transaction) are facing in the rightdirection when a trend develops. When you are is such a trend the technique applies risk management thatis aimed at ensuring that you stay in the trend on hopefully a risk free basis.It is therefore important to trade the Forex Market when trends are most likely to develop. The trick is touse this system at times when there is reasonable volatility in the market so that the trends that areentered into, last a reasonable time.Times to avoid are when markets generally have low or very high volatility: The quite period between the Asian and European markets.The quite period between the US and Asian markets.At times before and during major announcementsThe best times are in the first 2 to 3 hours of Major market openings- the Asian Market (9:00am Tokyo)- the European Market (7:00am GMT)- the London Market (9:00am GMT)- the New York Market ( 8:30am New York)To convert these times to your local times use http://www.timeanddate.com/We have also found that sometimes trends develop at the start of an hour.1. 7:00am, 8:00am, 9:00am and 10am GMT are often the session highs or lows of the Europeantrading sessions.2. 9:00am to 10am Tokyo can sometimes produce nice trends.3. 8:30am, 9:00am, 10:00am and 11:00am New York are also good times for new trends.4. Sometimes 12:00 am produces some interesting moves as the European market closes while the USMarket is still active.To convert these times to your local times use http://www.timeanddate.com/Page 10 of 16
The Magic Momentum Method of Trading the Forex MarketVersion 1.2OVERALL SUMMARY OF THE TECHNIQUERemember that this technique is all about making sure that you (your transaction) are facing in the rightdirection when a trend develops. When you are is such a trend the technique applies risk management thatis aimed at ensuring that you stay in the trend on hopefully a risk free basis.Use the 1 minute charts to develop your trading skills before moving on to the longer term time frames.Only trade at times when there is a good chance that the price will move quite well - TimesSkills that you have to develop and be comfortable using this technique with are:1.2.3.4.5.6.7.8.Setting up the chartsDrawing trendlinesFollowing the trading systemTrading profitablyEntering trades quicklyExiting trades quicklyReversing trades quicklyIdentifying trading setups quicklyThe technique is:Identify entry opportunities:1. See a trendline violation or a 50 line violation on the RSI2. Look for a corresponding trendline violation on the price chart3. Enter the dealExiting the deal using any of the techniques below:1. Your stop is hit ( this is an involuntary option which should not happen that often)2. You reverse the direction of your trade whether you are positive or negative.3. You close 50% of your deal at 5pips and move your stop to breakeven – mainly use this in slowmarkets.4. You close 50% of your deal at 5 pips and move your stop to -4 – mainly use this in fasttrending markets.5. The price moves over the 75% line on the RSI in trending markets (markets that move 15 pipson the 1 min chart) when in a sell. When in a buy, you would close your deal when it movesover the 25% line.6. The price crosses over the 15 moving average in a trending market.Bear in mind this is a beginner technique to ensure that you have the trading skills to identify tradingopportunities quickly, enter deals efficiently and make a profit. As your trading experience increases:- youcan investigate and apply filters that will make the technique even better and you can move onto longertime frames – please try to do this only once you are trading the 1 minute charts profitably.Page 11 of 16
The Magic Momentum Method of Trading the Forex MarketVersion 1.2EXAMPLES OF LIVE TRADING SESSIONSLow range sideways day:Trade12Description:(We use 2 lots and a 14 pip stop for all deals entered into)BUY due to a RSI trendline break and 50 line crossover andprice trendline violation. Cashed in 1st Lot at 5 and movedstop to -5. Cashed in 2nd lot at 10 when sell signal receivedReversed into a SELL due to a RSI trendline break and 50 linecrossover and trendline violation. Cashed in 1st Lot at 5 andmoved stop to -5. Cashed in 2nd lot at -1 when buy signalreceivedResult 15 4Page 12 of 16
The Magic Momentum Method of Trading the Forex MarketVersion 1.2Reversed into a BUY due to a RSI trendline break and 50 linecrossover and trendline violation. Cashed in 1st Lot at 5 andmoved stop to -5. Stopped out a -5 on 2nd lot.3Reversed into a SELL due to a RSI trendline break and 50 linecrossover and trendline violation. Cashed in 1st Lot at 5 andmoved stop to -5. Cashed in 2nd lot at 4 when buy signalreceived4Reversed into a BUY due to a RSI trendline break and 50 linecrossover and trendline violation. Cashed in 1st Lot at 5 andmoved stop to -5. Stopped out a -5 on 2nd lot.5Reversed into a SELL due to a RSI trendline break and 50 linecrossover and trendline violation. Cashed in 1st Lot at 5 andmoved stop to -5. Cashed in 2nd lot at 16 on retracement –end on days trading (2 hours trading)62 Hourtrading dayMainly sideways market ranging 25 pip most of the sessionbefore a slow sell breakout at the end. Best trend was only 30pips at the end. Note that based on the trending marketprinciple the crossing of the 75 line would have been the exitcriteria of the last deal. As this was the last deal of the day anearlier exit was made0 90 21 49Page 13 of 16
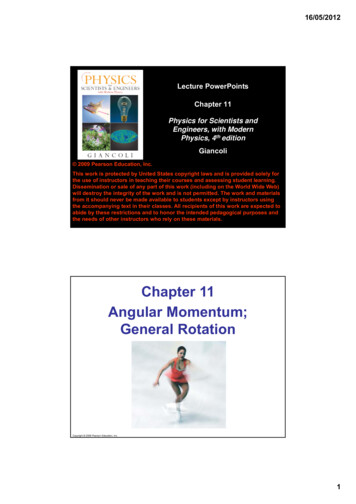
The Magic Momentum Method of Trading the Forex MarketVersion 1.2A trending sessionA 1 trade day:- Enter a 2 lot Buy on a RSI trendline and 50 line violation and a price trendline violation.Cashed in the 1st lot at 5 and moved the stop to -5. Cashed the 2nd deal in when the RSI indicator linemoved over the 25 level. Result 5 50 55 pips in 70 minutes. Ended the day’s trading.Remember to have a look at our trading statement showing our trades made in LIVE trading conditions infront of 100’s of clients in our LIVE Forex trading webinars. Made 247 pips in the 5 days of trading STATEMENTPage 14 of 16
The Magic Momentum Method of Trading the Forex MarketVersion 1.2HOW TO IMPROVE RESULTSThis system should be profitable on its own as described above. Our traders certainly are achieving positiveresults just using these concepts. There are, however, filters that may help you improve your results. Theuse of these filters is beyond the scope of this book but they are given as suggestions should your forextrading experience include the use of or knowledge of these concepts:12345678The use of candle reversal formations to confirm the trendline breakout.The use of price patterns e.g. double tops and bottoms to confirm reversals and supporttrendline breakouts.The use of the magic moving average to support trendline breakouts. Click here for more info Magical MAThe use of Fractals to support reversal signals causing trendline breakouts.The use of multi-time frame chart references to confirm the importance of the breakout. SeeWATOThe use of volume signals to confirm entry and exit conditions. See WATOThe use o
CHARTS You can use any charting system you wish in order to trade this technique, as long as you can create candlestick charts with an RSI (Relative Strength Indicator) indicator as shown below. When using charts to trade the Forex market there a