Transcription
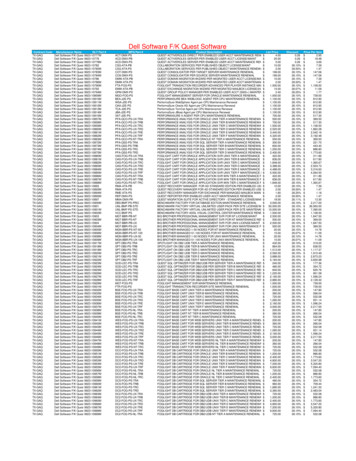
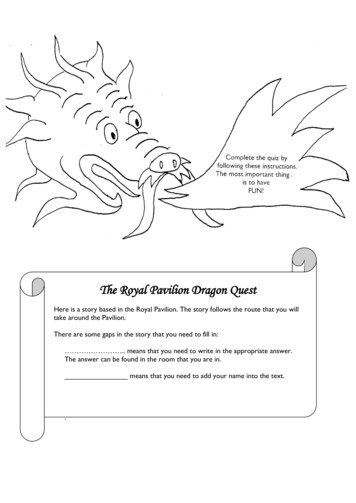
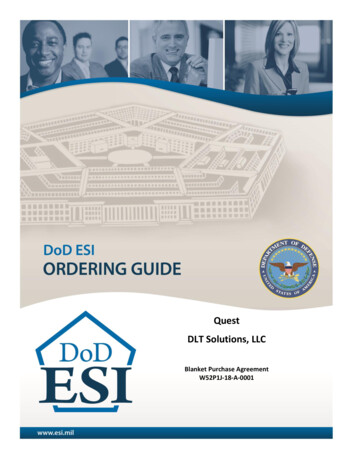
Product Review: Quest Software’sJames F. Koopmann Foglight Performance AnalysisPine Horse, Inc.for OracleIntroductionI’ve always been interested and intrigued by the processes DBAs use to monitor their databases.I’ve seen many DBAs hunched over keyboards (affectionately called “gargoyle DBAs”) continuallywatching sessions execute and resources being consumed. I’ve often wondered what these gargoyleDBAs are trying to catch their database system doing. Of course I know—they’re trying to catch anapplication or user perform a lock, generate an I/O request, or spend time in some obscure resourcewait event. I think it’s time we ask ourselves why this manual, time-intensive monitoring is takingplace. A more viable approach to performance monitoring is recognizing that resource consumptionon databases is going to happen. The key is to know when resource consumption has happened, wasit a problem, will it happen again, and at what levels.WorkloadRegardless of how manyapplications, users, or SQLstatements we throw atthem, our database systemshave a physical and finiteset of resources and timethat can be used to servicerequests and provide resultsets back to applicationsand users. The amount ofwork a database systemproduces or can produce,along with the resourcesconsumed, in a specifiedtime is considered itsworkload. In order todetermine the trueperformance of our database systems, it is imperative that we are able to monitor the workload andrelate the resources used to the various consumers against a timeline.Page 1 of 7
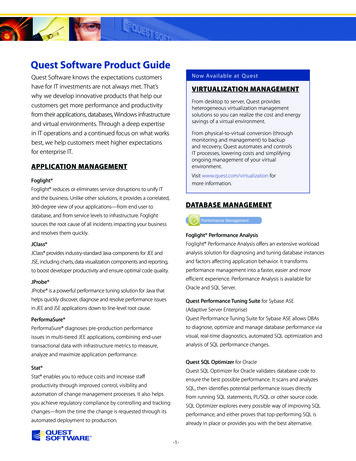
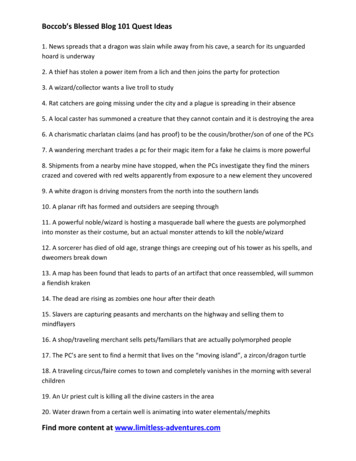
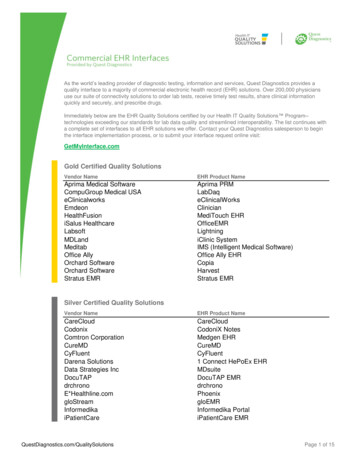
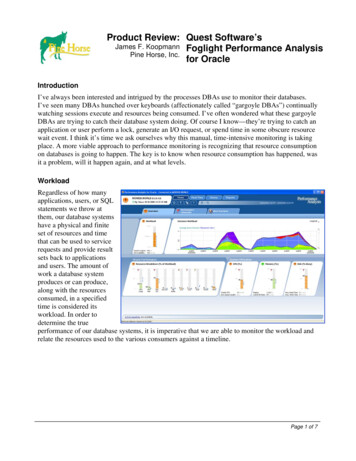
Product Review: Quest Software’s Foglight Performance Analysis for OracleIt was good to see thatworkloads are at the heart ofthe Foglight PerformanceAnalysis product. The powerof workload monitoring withPerformance Analysisbecomes apparent as you sliceand dice into variousworkloads and the resourcesthey consume—looking atworkloads from various anglesor dimensions. PerformanceAnalysis supports a number ofdimensions, including SQLstatements, programs, OSusers, DB users, clientmachines, command types, actions, modules, client info, and sessions. You can group and drilldown within these dimensions to quickly find anomalies in workloads. For instance, you couldeasily find an application server from a server farm that is producing a higher level of transactions.Without workload monitoring, this is nearly impossible to find.Collecting the statisticsEvery database performance tool has to have a method of collecting statistics. In my opinion, this iswhere Performance Analysis shines. The collection mechanism, StealthCollect, is an agent that isdeployed on the database host, attaches to the Oracle shared memory, creates a read-only shadowprocess of the SGA, and reads memory blocks without ever needing to log in to the Oracle instance.With a collection rate of up to 400 samples per second, the agent sends samples to a middlewaremachine where a set of processes takes the memory samples and stores them in a readable form—relieving the database host of any processing. This is quite different from other collectiontechniques that use the standard Oracle API, which relies on a SQL connection to Oracle andquerying the V and X structures. Using the standard API is actually very expensive, stresses theproduction system, and has been known to cause the Oracle database to lock up. StealthCollect,which bypasses the Oracle API, is non-intrusive, maintains a small footprint, and offers thefollowing benefits: Continually and more frequently collects samples, regardless of the current state of thedatabase, to provide consistent and high-quality data. Other tools often fail or time out whentrying to connect to an Oracle instance having performance problems. Offloads processing and does not stress the database system. Performance Analysis collectsstatistics outside the database and immediately sends the data to a middleware server whereall storage, processing, analysis, and reporting are performed. Consumes minimal CPU and is self-adjusting. StealthCollect runs outside the database,doesn’t use any of the database’s CPU resources, and is not affected by a poorly tuneddatabase. Further, you can specify the maximum amount of system CPU StealthCollect uses,and it also adjust its collection rate to match the amount of activity on the database.Page 2 of 7
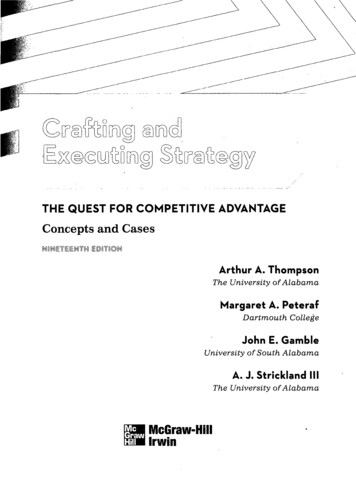
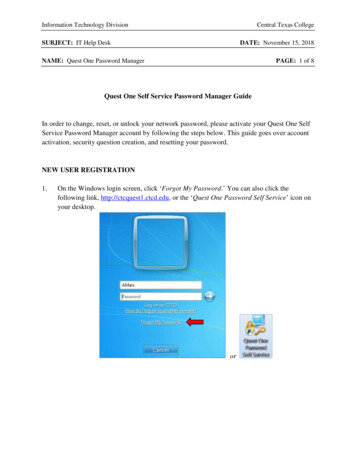
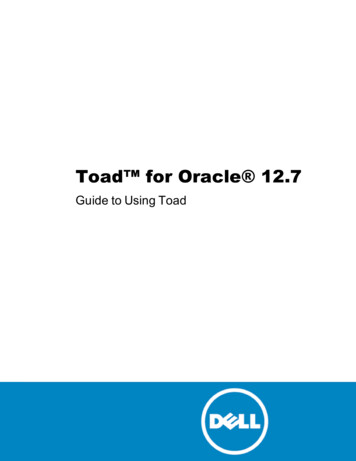
Product Review: Quest Software’s Foglight Performance Analysis for OracleAbout the only downside of StealthCollect is that it, like any agent, must be installed on eachmonitored host. This can be a logistical barrier to overcome—obtaining install permissions that aDBA typically doesn’t have because of security separation within an organization. The good newsis that StealthCollect should only have to be deployed or upgraded on the database host once forany version of Oracle. Quest has built the agent to dynamically support new patches so if an OPatchcomes out, StealthCollect automatically calibrates for that patch.Working with Performance AnalysisAfter StealthCollect collects statistics, the middleware is able, by default only, to store 90 days ofperformance data. With an optional repository, history can be increased to 5 years, also a suggesteddefault. Clearly the purpose of Performance Analysis is to offer the customer a mechanism for thecollection and long-term storage of statistical data to enable all types of diagnostics against this datasuch as trending, root cause analysis, and capacity planning.In terms of usability,Performance Analysis isvery intuitive. Much likefile navigation, usersexpand, collapse, anddrill down withindimensions, those highlevel workloadgroupings, and quicklysee representations ofresources consumed forthe workload. It is veryeasy to see patterns andidentify anomalies inresource usage—quicklypointing the DBA toareas to investigatefurther, either withdrilldowns or any number of reports. As far as screen layout is concerned, as the user navigates,they are presented with three panels: one for total resources consumed, another with a detailedlisting of performance data, and one with a graph that shows the percentage of resources consumedby the detail selected in the detailed listing. This makes it easy to not only see total resourcesconsumed for the selected workload, but also to see how that workload is affected by individualdatabase activity.Performance Analysis goes beyond the simple collection and presentation of raw performance data.Its strength is in its ability to aggregate raw data and offer current and historical workload analysisto quickly detect anomalies from trends and pinpoint root causes within those anomalies. The DBAis able to pinpoint true performance issues causing resource consumption issues and then validatetuning efforts. Simply put, Performance Analysis allows for the quick digestion of performanceinformation, directs DBAs in tuning efforts, and provides valuable current and historical workloadtrend analysis to understand resource consumption—going far beyond just raw data or traditionalperformance metrics.Page 3 of 7
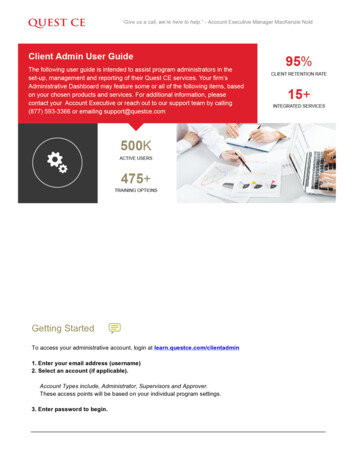
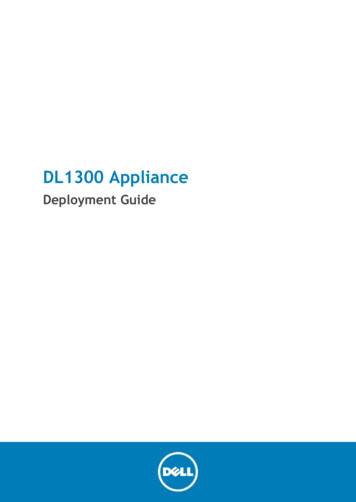
Product Review: Quest Software’s Foglight Performance Analysis for OracleCompareChange is the only thing that is constant andwithout change there would be no problems. Attimes I think I’ve built my entire database careeraround the concept of change. When I get calledinto an organization and they ask me to fix theirperformance problems, the first question I ask is,“What’s changed?” This, 100% of the time,relates directly to the problem. This is why I likePerformance Analysis so much. It is able tocompare just about anything—workload,resource consumption, performance metrics orconsumers, within any time frame, and compareit against any other time frame or against abaseline. You can quickly tell the differencebetween what was experienced and what isconsidered normal. Think of the power whensomeone comes and shows concern thatprocessing seemed a bit slow between the hours of 10pm and 3am and you are able to quicklycompare that time period against past workloads—slicing and dicing across the instance, programs,users, machines, etc.So instead of querying V tables, searching through logs, or trying to recreate the problem andanalyze TRACE files, DBAs can quickly look at the time frame for the complaint, graphically seewhere resource consumption is out of balance, or begin comparing across normal processingperiods to quickly extract thedifferences.Rest assured the comparison is muchmore than a simple diff of SQLstatements or explain plans. When thecomparison is done, not only is thedifference between the selected entitiesdisplayed, but detailed activity forindividual components is textually andgraphically shown—quickly pointing tothe resources most consumed and ofgreatest concern for the workload inquestion. I have not seen such a cleanand quick method for getting to rootcauses and identifying real tuningopportunities.Page 4 of 7
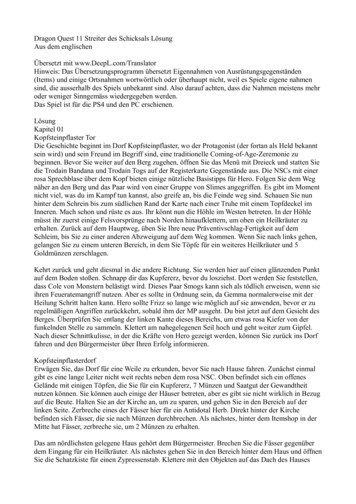
Product Review: Quest Software’s Foglight Performance Analysis for OracleAlertsEvery database monitoring solution should havealerts that are triggered when something goeswrong. Performance Analysis is no differentexcept the alerts are triggered by real baselinedeviations or performance advisories. This is muchdifferent than tools that only alert you to athreshold. Thresholds are static and typically donot relate well to how a database is actuallyperforming. Alerts from Performance Analysis, onthe other hand, relate directly to the workload onthe database and let you know when resourceconsumption is out of balance—quite different andvery powerful to getting what I call real alerts,instead of fake alerts.Alerts are categorized for services (database,application, hosts, etc.) and severity. A briefexplanation of the alert is given, as well as important items such as change tracking events (changesin tables, indexes, execution plans, etc.) or instance components (shared pool structure, wait events,configuration, etc.) that need attention. Drilling in deeper to the alert shows detailed informationabout what was happening in the database, a description of the problem and an action plan thatincludes the key metrics, the rationale as to why the alert was raised, recommended actions, andlinks to additional information and other products to aid in problem resolution, such as Quest SQLOptimizer or Space Manager—everything you need to understand the alert and solve it quickly.Plus a few niceties to manage alerts like acknowledging the alert so other Performance Analysisusers know someone is aware of the alert and attaching statuses and notes for future reference—making this a growing knowledge base for when other DBAs must work on the same problem in thefuture. Or if you’re confident in the plan of action or want to forward the alert to a differentnotification system, you can script actions for alerts using the rules engine.Working with RACOracle real application clusters (RAC) provides a database solution where a single database isshared across a cluster of servers—providing databases with scalability and high availabilityfeatures. With RAC we are now asking our DBAs to monitor and tune multiple instances (nodes)simultaneously and with regard to each node in a RAC environment. In Performance Analysis,RAC nodes are exposed as single logical entities—making it very easy to see how each node affectsthe cluster. When looking at a cluster, you can easily see each node’s workload and how itcontributes to the entire workload of the cluster—validating if the cluster is out of balance.Page 5 of 7
Product Review: Quest Software’s Foglight Performance Analysis for OracleYou can then drill down intoeach node to see howindividual SQL statements,programs, users, etc. areperforming on it. And in myopinion, the best thing here isthat you can also do acomparison of activitybetween nodes and see if thereare any drastic differences innode resource consumption. Injust a few clicks, you cangraphically see whereworkloads differ across thenodes along with variousmetrics to see where changeshappened that caused thedifference in workload.Performance Analysis in a RAC environment is really not much different than for a single instance.The only real difference is the extra layer of nodes under a cluster. The interrogation, analysis, andalerts all behave the same: zero in on a workload, determine if the workload has changed, and thendrill down or alert on that deviation from the norm.What about Oracle’s Enterprise Manager (OEM)Many performance tools, including Oracle’s Enterprise Manager and Diagnostic Pack (OEM/Diag),rely on Oracle’s standard API (X and V views) and built-in instrumentation. Because of this,OEM/Diag is highly coupled with the database, performs statistical collection inside (whileconnected to) the database, and has packages, procedures, and code on the database server that arerequired for much of the statistical collection and massaging of performance data. Under theseconditions OEM/Diag can become just as much a performance problem as the one we’re trying tosolve. And since OEM/Diag relies on performance data that is in the database itself, that data maybe inaccessible if the database is overloaded or down. So when you’re having a problem, you can’tget to the data to troubleshoot the problem—sort of a “catch-22” and arguably a fatal flaw inOracle’s architecture. To help alleviate the potential performance impact, OEM/Diag limits theworkload collection mechanism to such a low frequency that the quality of the statistics becomesquestionable. Couple this with the fact that OEM/Diag has limited buffer/storage space and willoften age out statistical information, and a DBA will end up missing statistical data and get no realsense of any trends that are emerging within the database.Performance Analysis vs. SpotlightIn addition to Performance Analysis, Quest also offers Spotlight. What’s the difference and why aretwo tools needed? The primary difference is that Performance Analysis focuses on the databaseworkload while Spotlight focuses on the database infrastructure. In other words, the two tools targetdifferent layers of the database hierarchy. That hierarchy starts with the database infrastructure,which services sessions, which create workload. Spotlight focuses on the database infrastructure,Page 6 of 7
Product Review: Quest Software’s Foglight Performance Analysis for Oraclewhich has traditionally been the target of database monitoring. Performance Analysis extends thattraditional approach by capturing and analyzing workload.Most people would probably agree that infrastructure monitoring is essential for any database—wesimply wouldn’t put a database into production without this minimum level of monitoring. But whatabout workload monitoring? I think this additional level of monitoring is needed for mission-criticaldatabases where outages or slowdowns can have a serious impact on the organization. Transactionintensive databases are also candidates since once you’ve tuned the obviously bad SQL, you need amore comprehensive view of activity like Performance Analysis provides to troubleshoot problemsand maintain performance, especially as users and data volumes grow. And you could easily arguethat the tool should be deployed on all databases as a standard and because it makes DBAs moreproductive.ConclusionResource consumption isn’t bad; resource consumption only causes a problem when it is abovenormal and reaches the limits of the system. Performance Analysis provides more than sufficiententry points to investigate the workload for databases. With the aid of comparing workloads, anyDBA can easily pinpoint current or potential problems in an Oracle database and quickly generate aviable action plan to remedy the issues.It is worth noting that Performance Analysis has been around since 1999 and is a very mature andfeature-rich product. There was in no way enough time to touch on and review all the features ofthis product. For example, IntelliProfile, ChangeTracker, reporting, configuration, and the datawarehouse are all worth noting and exploring in further detail.Page 7 of 7
links to additional information and other products to aid in problem resolution, such as Quest SQL Optimizer or Space Manager—everything you need to understand the alert and solve it quickly. Plus a few niceties to manage alerts l