Transcription
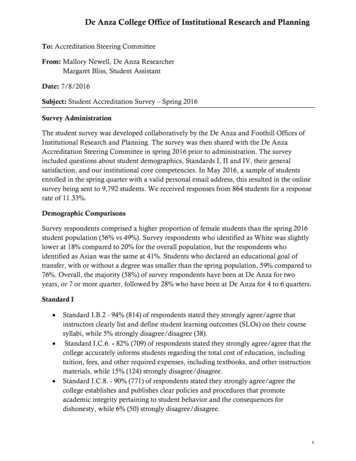
De Anza College Office of Institutional Research and PlanningTo: Accreditation Steering CommitteeFrom: Mallory Newell, De Anza ResearcherMargaret Bliss, Student AssistantDate: 7/8/2016Subject: Student Accreditation Survey – Spring 2016Survey AdministrationThe student survey was developed collaboratively by the De Anza and Foothill Offices ofInstitutional Research and Planning. The survey was then shared with the De AnzaAccreditation Steering Committee in spring 2016 prior to administration. The surveyincluded questions about student demographics, Standards I, II and IV, their generalsatisfaction, and our institutional core competencies. In May 2016, a sample of studentsenrolled in the spring quarter with a valid personal email address, this resulted in the onlinesurvey being sent to 9,792 students. We received responses from 864 students for a responserate of 11.33%.Demographic ComparisonsSurvey respondents comprised a higher proportion of female students than the spring 2016student population (56% vs 49%). Survey respondents who identified as White was slightlylower at 18% compared to 20% for the overall population, but the respondents whoidentified as Asian was the same at 41%. Students who declared an educational goal oftransfer, with or without a degree was smaller than the spring population, 59% compared to76%. Overall, the majority (58%) of survey respondents have been at De Anza for twoyears, or 7 or more quarter, followed by 28% who have been at De Anza for 4 to 6 quarters.Standard I Standard I.B.2 - 94% (814) of respondents stated they strongly agree/agree thatinstructors clearly list and define student learning outcomes (SLOs) on their coursesyllabi, while 5% strongly disagree/disagree (38).Standard I.C.6. - 82% (709) of respondents stated they strongly agree/agree that thecollege accurately informs students regarding the total cost of education, includingtuition, fees, and other required expenses, including textbooks, and other instructionmaterials, while 15% (124) strongly disagree/disagree.Standard I.C.8. - 90% (771) of respondents stated they strongly agree/agree thecollege establishes and publishes clear policies and procedures that promoteacademic integrity pertaining to student behavior and the consequences fordishonesty, while 6% (50) strongly disagree/disagree.1
Standard I.C.9. - 83% (717) of respondents stated they strongly agree/agreeinstructors present data and information fairly and objectively, while 14% (117)strongly disagree/disagree.Standard II Standard II.A.6. - 73% (626) of respondents stated they strongly agree/agree thecollege schedules courses in a manner that allows students to complete certificate anddegree requirements within a realistic period of time, while 22% (183) stronglydisagree/disagree.Standard II.B.1. - 93% (797) of respondents stated they strongly agree/agree thecollege supports learning by having services such as the library collections, tutoring,counseling learning centers, and computer labs available for student use, while 4%(33) strongly disagree/disagree.Standard II.C.3. - 84% (725) of respondents stated they strongly agree/agree thecollege assures equitable access to all of its students by providing appropriate,comprehensive, and reliable services to students who attend courses face-to-face oronline, while 9% (73) strongly disagree/disagree.Standard II.C.5. - 67% (568) of respondents stated they strongly agree/agree thecollege provides sufficient counseling and/or academic advising to support students,while 26% (225 students) strongly disagree/disagree.Standard II.C.5. - 70% (595) of respondents stated they strongly agree/agreecounseling and advising programs orient students ensuring they understandrequirements related to their programs of study and other relevant academicrequirements, including graduation and transfer policies, while 21% (180 students)strongly disagree/disagree.Standard II.B.1. - 90% (771) of respondents stated they strongly agree/agree thecollege assures buildings and walkways are constructed to ensure access and safety,while 6% (52) strongly disagree/disagree.Standard IV Standard IV.A.2. - 73% (635) of respondents stated they strongly agree/agree thecollege makes it known that students are welcome to participate in decision-makingprocesses and considers student views in matters where students have a direct andreasonable interest, while 15% (126) strongly disagree/disagree.2
Institutional Core CompetenciesStudents were asked how much their experience at De Anza has contributed to theirknowledge, skills and personal development in the following areas:Communication and Expression 56% (485) of respondents stated their experience at this college contributed to theirability to express themselves creatively very much/quite a bit, while 39% (337) statedsome/very little.72% (617) of respondents stated their experience at this college contributed to theirability to write clearly and effectively very much/quite a bit, while 25% (208) statedsome/very little.72% (620) of respondents stated their experience at this college contributed to theirability to speak clearly and effectively very much/quite a bit, while 24% (202) statedsome/very little.Information Literacy 65% (557) of respondents stated their experience at this college contributed to theirability to use computing and information technology very much/quite a bit, while27% (238) some/very little.Physical/Mental Wellness and Personal Responsibility 71% (606) of respondents stated their experience at this college contributed to theirability to work effectively with others very much/quite a bit, while 28% (236) statedsome/very little.53% (457) of respondents stated their experience at this college contributed to theirability to recognize what is necessary to stay healthy very much/quite a bit, while41% (447) stated some/very little.Civic Capacity for Global, Cultural, Social and Environmental Justice 75% (646) of respondents stated their experience at this college contributed to theirunderstanding of people from other racial and ethnic backgrounds very much/quite abit, while 20% (177) stated some/very little45% (385) of respondents stated their experience at this college contributed to theirability to participate in the democratic process some/very little, while 41% (353)reported some/very little.58% (489) of respondents stated they their experience at this college contributed totheir ability to understand the significance of both environmental sustainability andsocial justice, while 35% (295) stated some/very little.3
50% (427) of respondents stated their experience at this college contributed to theirability to contribute to the welfare of their community very much/quite a bit, while41% (347) stated some/very little.Critical Thinking 68% (586) of respondents stated their experience at this college contributed to theirability to empathize with other people’s point of view very much/quite a bit, while28% (233) reported some/very little.72% (618) of respondents stated their experience at this college contributed to theirability to interpret ideas or issues thoughtfully and logically very much/quite a bit,while 25% (218) reported some/very little.66% (565) of respondents stated their experience at this college contributed to theirability to solve numerical problems very much/quite a bit, while 26% (225) statedsome/very little.78% (661) of respondents stated their experience at this college contributed to theirability to think critically and analytically, while 21% (177) stated some/very little.General Satisfaction 92% (765) of respondents strongly agree/agree their relationships with other studentsat this college are generally friendly and supportive, while 4% (34) disagree/stronglydisagree.91% (742) of respondents strongly agree/agree their interactions with faculty at thiscollege are generally helpful, encouraging and supportive, while 8% (66)disagree/strongly disagree.80% (657) of respondents strongly agree/agree their interactions with student supportservices (such as admission and records, financial aid, counseling, tutoring, studentactivities, library) are generally helpful, friendly and supportive, while 14% (114 )disagree/strongly disagree.93% (800) of respondents reported they would recommend this college to others.46% (398) of respondents evaluated their entire educational experience at this collegeas “excellent”, 40% (342) responded “good”, 12% (106) responded “fair” and 2%(18) responded “poor”.4
Accreditation SurveyWhat is your primary educational goal ?ResponseValueFrequencyPercent5.00182.09Transfer with degreeTransfer without degreeDegree onlyCertificate onlyJob advancement/JobtrainingBasic skills developmentPersonal enrichmentCredit for high school l Valid44224366261140311860How many quarters have you completed at De Anza?ResponseValue FrequencyThis is my first quarter2-3 quarters4-6 quarters7 or more quarters1.002.003.004.00Total ValidWhat is your age?Response18 and younger19 – 2425 – 2930 – 3435 – 3940 – 4950 and overTotal 3810.4928.4457.69GraphMean: GraphMean: 2.082.6767.029.295.693.024.997.32Accreditation SurveyGraphMean: 2.845
What is your gender?ResponseMaleFemaleOtherPrefer not to respondValue1.002.003.004.00Total ValidFrequencyPercent857100.0036348464To which ethnic group do you MOST identify?ResponseValue FrequencyAfrican American/BlackAsianFilipino/Pacific IslanderLatino/aNative AmericanWhiteOtherPrefer not to respond1.002.003.004.005.006.007.008.00Total l Valid1.002.003.004.005.00Mean: 3.88100.00Instructors clearly list and define student learning outcomes (SLOs) on their course syllabi. (1.B.2.)ResponseValue FrequencyPercentGraphStrongly AgreeAgreeDisagreeStrongly DisagreeDont Know/Doesnt ApplyMean: editation SurveyMean: 1.636
The college accurately informs students regarding the total cost of education, including tuition, fees, andother required expenses, including textbooks, and other instructional materials. (I.C.6.)ResponseValue FrequencyPercentGraphStrongly AgreeAgreeDisagreeStrongly DisagreeDont Know/Doesnt Apply1.002.003.004.005.00Total he college establishes and publishes clear policies and procedures that promote academic integritypertaining to student behavior and the consequences for dishonesty. (I.C.8.)ResponseValue FrequencyPercentGraphStrongly AgreeAgreeDisagreeStrongly DisagreeDont Know/Doesnt Apply1.002.003.004.005.00Total structors present data and information fairly and objectively. (I.C.9.)ResponseValue FrequencyPercentStrongly AgreeAgreeDisagreeStrongly DisagreeDont Know/Doesnt ApplyTotal 772.932.69854100.00Accreditation SurveyGraphMean: 1.93Mean: 1.72Mean: 1.947
The college schedules courses in a manner that allows students to complete certificate and degreerequirements within a realistic period of time. (II.A.6.)ResponseValue FrequencyPercentGraphStrongly AgreeAgreeDisagreeStrongly DisagreeDont Know/Doesnt Apply1.002.003.004.005.00Total The college supports learning by having services such as the library collections, tutoring, counselinglearning centers, and computer labs available for student use. (II.B.1.)ResponseValue FrequencyPercentGraphStrongly AgreeAgreeDisagreeStrongly DisagreeDont Know/Doesnt Apply1.002.003.004.005.00Total e college assures equitable access to all of its students by providing appropriate, comprehensive, andreliable services to students who attend courses face-to-face or online. (II.C.3.)ResponseValue FrequencyPercentGraphStrongly AgreeAgreeDisagreeStrongly DisagreeDont Know/Doesnt ApplyTotal 51.877.02855100.00Accreditation SurveyMean: 2.18Mean: 1.59Mean: 1.938
The college provides sufficient counseling and/or academic advising to support students. (II.C.5.)ResponseValue FrequencyPercentGraphStrongly AgreeAgreeDisagreeStrongly DisagreeDont Know/Doesnt Apply1.002.003.004.005.00Total 0Counseling and advising programs orient students ensuring they understand requirements related to theirprograms of study and other relevant academic requirements, including graduation and transfer policies.(II.C.5.)ResponseValue FrequencyPercentGraphStrongly AgreeAgreeDisagreeStrongly DisagreeDont Know/Doesnt Apply1.002.003.004.005.00Total The college assures buildings and walkways are constructed to ensure access and safety. (II.B.1.)ResponseValue FrequencyPercentGraphStrongly AgreeAgreeDisagreeStrongly DisagreeDont Know/Doesnt ApplyTotal 11.883.76852100.00Accreditation SurveyMean: 2.28Mean: 2.26Mean: 1.739
The college makes it known that students are welcome to participate in decision-making processes andconsiders student views in matters where students have a direct and reasonable interest. (IV.A.2.)ResponseValue FrequencyPercentGraphStrongly AgreeAgreeDisagreeStrongly DisagreeDont Know/Doesnt preting ideas or issues thoughtfully and logicallyResponseValue FrequencyPercentTotal ValidExpressing myself creativelyResponseVery MuchQuite a BitSomeVery LittleDont Know/Doesnt ApplyValue1.002.003.004.005.00Total ValidVery MuchQuite a BitSomeVery LittleDont Know/Doesnt ApplyTotal 57GraphGraphMean: 2.23Mean: 2.37Mean: 2.01100.00Accreditation Survey10
Recognizing what is necessary to stay healthyResponseValue FrequencyVery MuchQuite a BitSomeVery LittleDont Know/Doesnt Apply1.002.003.004.005.00Total Valid856Participating in the democratic processResponseValueVery MuchQuite a BitSomeVery LittleDont Know/Doesnt Apply249207211135541.002.003.004.005.00Total 2114.14Understanding the significance of both environmental sustainability and social justiceResponseValue FrequencyPercentVery MuchQuite a BitSomeVery LittleDont Know/Doesnt ApplyTotal Valid1.002.003.004.005.00GraphMean: 0Accreditation SurveyGraphGraphMean: 2.86Mean: 2.4111
Empathizing with other people’s point of viewResponseValue FrequencyVery MuchQuite a BitSomeVery LittleDont Know/Doesnt Apply1.002.003.004.005.00Total ValidWriting clearly and effectivelyResponseVery MuchQuite a BitSomeVery LittleDont Know/Doesnt Apply858Value1.002.003.004.005.00Total ValidSpeaking clearly and effectivelyResponseVery MuchQuite a BitSomeVery LittleDont Know/Doesnt ApplyTotal ercent854100.003193001574335GraphMean: 2.1637.3535.1318.385.044.10Accreditation SurveyGraphGraphMean: 2.04Mean: 2.0312
Solving numerical problemsResponseVery MuchQuite a BitSomeVery LittleDont Know/Doesnt ApplyValue1.002.003.004.005.00Total ValidFrequencyPercent857100.002842801497569Using computing and information technologyResponseValue FrequencyVery MuchQuite a BitSomeVery LittleDont Know/Doesnt Apply1.002.003.004.005.00Total ValidThinking critically and analyticallyResponseVery MuchQuite a BitSomeVery LittleDont Know/Doesnt ApplyTotal raphMean: aphMean: 2.2642.8934.6715.635.051.76Accreditation SurveyGraphMean: 1.8813
Contributing to the welfare of your communityResponseValue FrequencyVery MuchQuite a BitSomeVery LittleDont Know/Doesnt Apply1.002.003.004.005.00Total ValidWorking effectively with othersResponseVery MuchQuite a BitSomeVery LittleDont Know/Doesnt al .10Understanding people of other racial and ethnic backgroundsResponseValue FrequencyPercentVery MuchQuite a BitSomeVery LittleDont Know/Doesnt ApplyTotal Valid1.002.003.004.005.00GraphMean: ccreditation SurveyGraphGraphMean: 2.06Mean: 1.9314
My relationships with other students at this college are generally friendly and supportive.ResponseValue FrequencyPercentStrongly AgreeAgreeDisagreeStrongly DisagreeDont Know/Doesnt Apply1.002.003.004.005.00Total phMy interactions with faculty at this college are generally helpful, encouraging and supportive.ResponseValue FrequencyPercentGraphStrongly AgreeAgreeDisagreeStrongly DisagreeDont Know/Doesnt Apply1.002.003.004.005.00Total Valid33240843231440.4949.765.242.801.71820100.00My interactions with student support services (such as admissions and records, financial aid, counseling,tutoring, student activities, library) are generally helpful, friendly and supportive.ResponseValue FrequencyPercentGraphStrongly AgreeAgreeDisagreeStrongly DisagreeDont Know/Doesnt ApplyTotal 65.866.11819100.00Accreditation SurveyMean: 1.71Mean: 1.75Mean: 2.0315
Would you recommend this college to others?ResponseValue FrequencyYesNo1.002.00Total Valid79756853Percent93.436.57100.00How would you evaluate your entire educational experience at this college?ResponseValue FrequencyPercentExcellentGoodFairPoorTotal Valid1.002.003.004.00GraphMean: tation SurveyGraphMean: 1.7016
The student survey was developed collaboratively by the De Anza and Foothill Offices of Institutional Research and Planning. The survey was then shared with the De Anza . tutoring, counseling learning centers, and computer labs available f
