Transcription
Meeting of the U. T. System Board of Regents - Tuition and Fee Proposals (Substitute Item 1, Meeting of the Board)SUBSTITUTE AGENDA ITEMMEETING OF THE BOARDMAY 14, 20141.U. T. System: Discussion and appropriate action regarding tuition and feeproposalsRECOMMENDATIONThe U. T. System Board of Regents will be asked to take appropriate action regarding theproposed tuition and fee plans for each institution. As required by law, institutions will alsopropose an additional guaranteed tuition and fee plan to be offered beginning Fall 2014.Chancellor Cigarroa will introduce the discussion with comments on the deliberative processused to review the institutions' proposals. Executive Vice Chancellor Reyes and Executive ViceChancellor Greenberg will outline the institutions' proposals and recommendations.The summary of proposed tuition and fee plans are for the following periods of time:a.Academic institutions: one year for traditional rate plans and a guaranteed rate plan forfour years; andb.Health institutions: one year tuition and fee proposals, except U. T. Health ScienceCenter - Houston's dental school and biomedical sciences program, and U. T. HealthScience Center - San Antonio's dental school for two years.Tuition and fee proposals are set forth on the following pages, and will be presented by theinstitutional presidents and student government presidents.U. T. Arlington, Pages 333 - 334 President Karbhari Student Government President, Varun MallipaddiU. T. Austin, Pages 335 - 336 President Powers Senate of College Councils President, Andrew ClarkU. T. Brownsville, Pages 337 - 338 President García Student Government President, Stephanie MendezU. T. Dallas, Pages 339 - 340 President Daniel Student Government Vice President, Russell Charles HanniganU. T. El Paso, Pages 341 - 342 President Natalicio Student Government President, Paulina Lopez331
Meeting of the U. T. System Board of Regents - Tuition and Fee Proposals (Substitute Item 1, Meeting of the Board)U. T. Pan American, Pages 343 - 344 President NelsenU. T. Permian Basin, Pages 345 - 346 President Watts Student Government President, Oscar VazquezU. T. San Antonio, Pages 347 - 348 President Romo Student Government President, Zack DunnU. T. Tyler, Pages 349 - 350 President Mabry Student Government President, Michael SuarezU. T. Southwestern Medical Center, Page 351 President Podolsky Student Government President, Bradford CaseyU. T. Medical Branch - Galveston, Page 352 President Callender Student Government President, Alex ArnoldU. T. Health Science Center - Houston, Pages 353 - 354 President Colasurdo Student Government President, Margie N. SuttonU. T. Health Science Center - San Antonio, Pages 355 - 356 President Henrich Student Government President, Nathanael Elvin PhillipsU. T. M. D. Anderson Cancer Center, Page 357 President DePinho Student Government President, Meagan DenosU. T. Health Science Center - Tyler, Page 358332
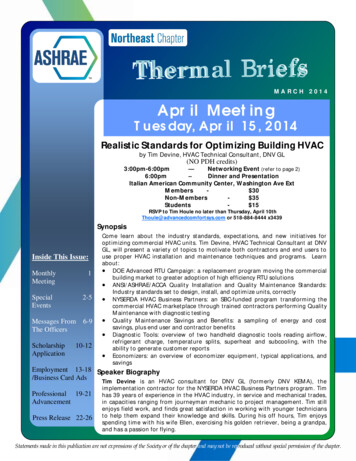
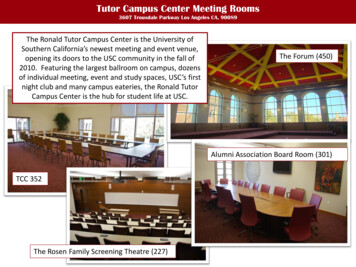
Meeting of the U. T. System Board of Regents - Tuition and Fee Proposals (Substitute Item 1, Meeting of the Board)FALL 2014 –SPRING 2016Summary of Proposed Tuition and Fee Plan: U. T. ARLINGTONSummary of Proposed Traditional Rate RESIDENTGRADUATENON-RESIDENTGRADUATEFall 2013 TotalAcademic CostBaselineProposed Fall2014 TotalAcademic CostRequestedPercentageIncrease overFall 2013RequestAmountIncrease overFall 2013 4,646 4,7812.9% 135 9,956 10,3443.9% 388 4,259 4,4083.5% 149 7,445 7,8845.9% 439Total Academic Cost represents the total of statutory tuition, Board-authorized designated tuition, mandatory fees, and course fees for the average undergraduatestudent enrolled in 15 semester credit hours (SCH). For graduate students, the total represents the sum of tuition and mandatory fees for the average studentenrolled in nine SCH (Unless otherwise noted).Projected New Net Revenue Per Estimated Student FTEFY 2015, Projected New Net Revenue Per Estimated Student FTEBaseline (Net RevenueTuition Proposal FY 2015from FY 2014 TotalEnrollmentProjected Net RevenueAcademic Cost Rates)EstimatedEstimatedActual RevenueIncrease for Year 1Student% DistributionRevenueFTEResident Undergraduate 70,731,924 3,943,0102.9%20,82478%Non-ResidentUndergraduate 2,105,926 119,7223.9%6202%Resident Graduate 14,221,791 650,4733.5%4,18715%Non-Resident Graduate 4,874,199 277,0975.9%1,4355%TOTAL 91,933,840 4,990,30227,066100.0%U. T. Arlington (UTA) has increased efforts, especially over the past five years, to provide increasing levels of financial support.Compared to similar public institutions nationally, average net price for UTA students is significantly lower. Additionally, about 55% offull-time students received need-based grant aid in 2012 - 2013 resulting in an average net academic cost of about 2,300 for thosestudents.UTA has recently implemented several student success initiatives that have positively impacted persistence and time to degree. Sincethe University College opened in 2010, first-year persistence rates have improved by ten points - from 61% to 71%. Six-year graduationrates for recent cohorts have been around 40%, and UTA intends to improve them by 10 percentage points over the next five years.New tuition revenue will further student success by providing investments in improving the student advising experience, implementing afixed one-year to two-year schedule to improve course availability and time to degree, and enhancements in technology to supportelectronic advising with centralized records and software upgrades for classroom scheduling efficiency. Mandated first-year experiencecourses for all incoming freshmen and upgrades to the Career Development Center can also help increase student engagement, degreecompletion, and success after graduation.UTA plans to continue online delivery of courses and onsite delivery at corporate and organizational sites.333
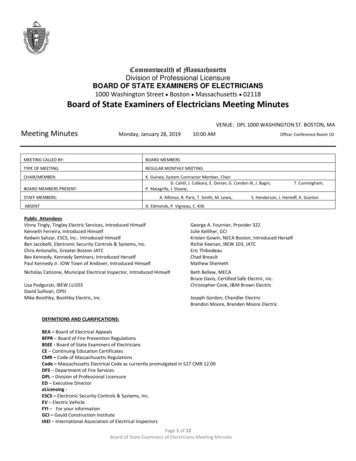
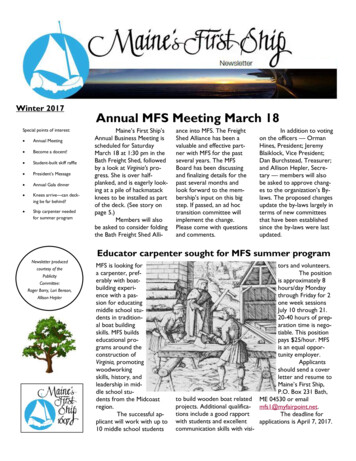
Meeting of the U. T. System Board of Regents - Tuition and Fee Proposals (Substitute Item 1, Meeting of the Board)FALL 2014 –SPRING 2016Summary of Proposed Tuition and Fee Plan: U. T. ARLINGTONSummary of Proposed Guaranteed Rate PlanFall ADUATENON-RESIDENTGRADUATEProposed FallRequested2014 TotalPercentageAcademicIncrease overCostFall creaseover Fall2013TraditionalPlanProposedFall tPercentageAmountIncrease over Increase overFall 2014Fall 2014GuaranteedGuaranteedPlanPlan 4,646 5,0188.0% 372 5,2194.0% 201 9,956 10,7528.0% 796 11,1824.0% 430NANANANANANANANANANANANANANATotal Academic Cost represents the total of statutory tuition, Board-authorized designated tuition, mandatory fees, and course fees for the average undergraduatestudent enrolled in 15 SCH. For graduate students, the total represents the sum of tuition and mandatory fees for the average student enrolled in nine SCH (Unlessotherwise noted).U. T. Arlington (UTA) requests an 8.0% increase for Fall 2014 guaranteed tuition plans over and above the Fall 2013 total averageacademic cost under the traditional rate plan.U. T. Arlington requests a 4.0% increase for Fall 2015 guaranteed tuition plans over and above the Fall 2014 total average academiccost for students enrolled in guaranteed tuition plans only.Rebates will be offered as follows: 1,000 if the student completes a minimum of 30 credit hours towards their degree, maintaining a minimum 2.5 GPA at UTA 1,000 if the student completes a minimum of 60 credit hours towards their degree, maintaining a minimum 2.5 GPA at UTA 1,000 if the student completes a minimum of 90 credit hours towards their degree, maintaining a minimum 2.5 GPA at UTAIf the student chooses the guaranteed tuition plan and graduates in four years, he or she will realize 8.5% savings.UTA estimates that between 3,300 and 4,400 students may opt-in to the plan each year. A guaranteed rate plan for graduate studentswill not be offered at this time.The guaranteed rate plan will be advertised to all incoming students as part of the recruitment package. Advisors and counsellors in highschools and community colleges will be equipped with information about the program. Transfer students may declare intent to transfer tolock-in a four-year rate.Students enrolling in the Bound for Success collaboration for high school juniors will also be able to lock-in rates, provided that theybegin full-time study at UTA within two years.334
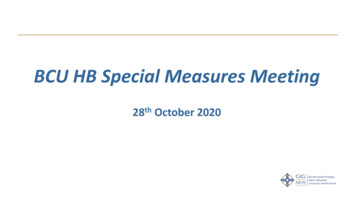
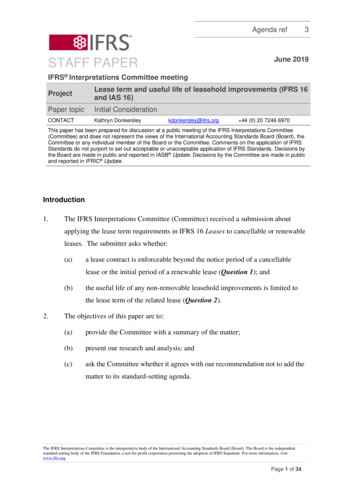
Meeting of the U. T. System Board of Regents - Tuition and Fee Proposals (Substitute Item 1, Meeting of the Board)FALL 2014 –SPRING 2016Summary of Proposed Tuition and Fee Plan: U. T. AUSTINSummary of Proposed Traditional Rate PlanFall 2013 TotalAcademic ed Fall2014 TotalAcademicCostRequestAmountIncrease overFall 2013RequestedPercentageIncrease overFall 2013 4,899 5,0032.13% 104 16,921 17,3612.6% 440 4,442 4,4420.0% 0 8,558 8,5580.0% 0Total Academic Cost represents the total of statutory tuition, Board-authorized designated tuition, mandatory fees, and course fees for the average undergraduatestudent enrolled in 15 semester credit hours (SCH). For graduate students, the total represents the sum of tuition and mandatory fees for the average studentenrolled in nine SCH (Unless otherwise noted).Projected New Net Revenue Per Estimated Student FTEFY 2015, Projected New Net Revenue Per Estimated Student FTEBaseline (Net RevenueTuition Proposal FY 2015from FY 2014 TotalProjected Net RevenueAcademic Cost Rates)Resident UndergraduateNon-ResidentUndergraduateResident GraduateNon-Resident GraduateTOTALEnrollmentActual RevenueEstimatedRevenueIncrease for Year 1EstimatedStudentFTE% Distribution 361.5M 6.0M2.13%39,09468.4% 68.9M 141.2M 39.1M 610.7M 1.7M 0.0M 0.0M %100.0%U. T. Austin considers affordability to be one of the most significant factors in expanding accessibility for students. While theU. T. Austin tuition “list price” has increased some over the past decade, average net tuition has remained relatively low. In 2012 2013, average net tuition was 44% of the list price of tuition for undergraduate students. Students with parental incomes of less than 60,000 paid almost no tuition ( 164) in 2012 - 2013.Compared among the top-tier fifteen major public universities, tuition and fees for resident undergraduate students at U. T. Austin aresome of the lowest – at least 5,000 less, on average, than other comparable institutions for 2013 - 2014. Additionally, among the samegroup of institutions, state appropriations also rank among the lowest. While U. T. Austin admits a much higher percentage ofapplicants than peer institutions (due to the Top 10% Law), U. T. Austin has increased first year persistence rates to almost 94% andcontinues to be committed to achieving a higher four-year graduation rate.335
Meeting of the U. T. System Board of Regents - Tuition and Fee Proposals (Substitute Item 1, Meeting of the Board)FALL 2014 –SPRING 2016Summary of Proposed Tuition and Fee Plan: U. T. AUSTINSummary of Proposed Guaranteed Rate RESIDENTGRADUATENON-RESIDENTGRADUATEFall edFall entageIncreaseover Fall2013TraditionalPlanRequestAmountIncreaseover Fall2013TraditionalPlanProposedFall tageIncreaseover Fall2014GuaranteedPlanRequestAmountIncreaseover Fall2014GuaranteedPlan 4,899 5,2918.0% 392 5,5034.0% 212 16,921 18,2758.0% 1,354 19,0064.0% 731NANANANANANANANANANANANANANATotal Academic Cost represents the total of statutory tuition, Board-authorized designated tuition, mandatory fees, and course fees for the averageundergraduate student enrolled in 15 SCH. For graduate students, the total represents the sum of tuition and mandatory fees for the average studentenrolled in nine SCH (Unless otherwise noted).U. T. Austin requests an 8.0% increase for Fall 2014 guaranteed tuition plans over and above the Fall 2013 total average academiccost under traditional rate plans.U. T. Austin requests a 4.0% increase for Fall 2015 guaranteed tuition plans over and above the Fall 2014 total average academic costfor students enrolled in guaranteed tuition plans only.For both the 2014 and 2015 cohorts, students who opt for the guaranteed tuition plan and graduate in four years will be eligible for atotal of 3,500 in rebates. Students on the traditional rate plan who graduate in four years are eligible for a 1,000 rebate. The rebateswill be paid upon graduation. A student who opts for the guaranteed tuition plan and graduates in four years will save cumulatively 196compared to a student who opts for the traditional tuition plan. The rebate of 3,500 is expected to incent students to graduate in fouryears, which is consistent with the institutional priority of increasing the four-year graduation rate among incoming freshmen.The eligibility requirements for the tuition rebates will be similar to those that are in place for existing rebate programs.U. T. Austin anticipates that between 2,000 and 3,000 students will opt-in to the plan in the first year.A working group has been formed to discuss and implement a guaranteed pricing plan. The group is responsible for logistical planningand for developing a communications strategy to communicate opportunities to enroll in the plan and potential benefits to the student.336
Meeting of the U. T. System Board of Regents - Tuition and Fee Proposals (Substitute Item 1, Meeting of the Board)FALL 2014 –SPRING 2016Summary of Proposed Tuition and Fee Plan: U. T. BROWNSVILLESummary of Proposed Traditional Rate RESIDENTGRADUATENON-RESIDENTGRADUATEFall 2013TotalAcademicCostBaselineProposed Fall2014 TotalAcademicCostRequestedPercentageIncrease overFall 2013RequestAmountIncrease overFall 2013 3,018.05 3,108.593.0% 90.54 8,476.55 8,815.554.0% 339.00 2,231.71 2,309.823.5% 78.11 5,417.71 5,688.595.0% 270.88Total Academic Cost represents the total of statutory tuition, Board-authorized designated tuition, mandatory fees, and course fees for the average undergraduatestudent enrolled in 15 semester credit hours (SCH). For graduate students, the total represents the sum of tuition and mandatory fees for the average studentenrolled in nine SCH (Unless otherwise noted).Projected Net Revenue Per Estimated Student FTEFY 2015, Projected Net Revenue Per Estimated Student FTEBaseline (Net RevenueTuition Proposal FY 2015from FY 2014 TotalProjected Net Revenue basedAcademic Cost Rates)on Year 1 Requested uateResident GraduateNon-Resident GraduateTOTALEnrollmentActual RevenueEstimatedRevenueIncrease for Year 1EstimatedStudentFTE% Distribution 30,594,805 1,024,1823.0%5,16385.8% 2,441,339 3,334,177 488,251 36,858,572 106,139 128,285 26,110 0%U. T. Brownsville (UTB) has historically maintained the lowest tuition rates for public four-year institutions in the State of Texas. 71% ofcurrent students receive financial aid and the average net academic cost for those receiving need-based grant aid is about 305 - oneof the lowest in the U. T. System. Even with proposed increases, UTB estimates that affordability and net price will remain almost thesame.Four-year graduation rates doubled between the Fall 2000 and Fall 2007 cohorts, and six-year rates increased almost 10 points in thesame time frame. New, more stringent admissions criteria are expected to further improve both rates.UTB recently created the Student Success Task Force to analyze and scale up best practices. As a result, UTB focused on practicesdesigned to impact financial support, faculty engagement, academic support, advising, and tutoring/mentoring to increase studentsuccess. The Link 2 Success program has improved retention rates by 6% for full-time freshmen within one year. SupplementalInstruction has improved success rates in various course sections by more than 20%. UTB has increased the number of bachelor’sdegrees conferred by 64% over the past 11 years.UTB has been commended by SACS for online support of students by offering 12 applications with more than 10,000 active users. BySpring 2013, UTB has 256 fully online and hybrid course sections with enrollment of 5,463.337
Meeting of the U. T. System Board of Regents - Tuition and Fee Proposals (Substitute Item 1, Meeting of the Board)FALL 2014 –SPRING 2016Summary of Proposed Tuition and Fee Plan: U. T. BROWNSVILLESummary of Proposed Guaranteed Rate RESIDENTGRADUATENON-RESIDENTGRADUATEFall edFall entageIncreaseover Fall2013TraditionalPlanRequestAmountIncreaseover Fall2013TraditionalPlanProposedFall tageIncreaseover Fall2014GuaranteedPlanRequestAmountIncreaseover NANANANANANANANANANANANANANATotal Academic Cost represents the total of statutory tuition, Board-authorized designated tuition, mandatory fees, and course fees for the average undergraduatestudent enrolled in 15 SCH. For graduate students, the total represents the sum of tuition and mandatory fees for the average student enrolled in nine SCH(Unless otherwise noted).Guaranteed Rate Plans for U. T. Rio Grande Valley will be approved at a later date. Since UTB will nothave an entering class beyond Fall 2014, they will not have a guaranteed rate plan.338
Meeting of the U. T. System Board of Regents - Tuition and Fee Proposals (Substitute Item 1, Meeting of the Board)FALL 2014 –SPRING 2016Summary of Proposed Tuition and Fee Plan: U. T. DALLASSummary of Proposed Rate Plan (Mandatory Guaranteed Tuition TERESIDENTGRADUATENON-RESIDENTGRADUATEFall 2013TotalAcademicCostBaselineProposed Fall2014 TotalAcademicCostRequestedPercentageIncrease overFall 2013RequestAmountIncrease overFall 2013 6,142 6,272.822.13% 130.82 15,429 15,911.933.13% 482.93 6,138 6,330.123.13% 192.12 10,972 11,315.423.13% 343.42Total Academic Cost represents the total of statutory tuition, Board-authorized designated tuition, mandatory fees, and course fees for the average undergraduatestudent enrolled in 15 semester credit hours (SCH). For graduate students, the total represents the sum of tuition and mandatory fees for the average studentenrolled in nine SCH (Unless otherwise noted).Projected New Net Revenue Per Estimated Student FTEFY 2015, Projected New Net Revenue Per Estimated Student FTEBaseline (Net RevenueTuition Proposal FY 2015 Projectedfrom FY 2014 TotalEnrollmentNet RevenueAcademic Cost Rates)EstimatedEstimatedTAC RequestedActual RevenueStudent% eNon-ResidentUndergraduateResident GraduateNon-Resident GraduateTOTAL 122,040,583 623,6450.51%10,66957.22% 22,385,079 241,1351.08%7153.84% 29,510,138 108,658,992 282,594,792 164,719 1,552,276 0%100.0%U. T. Dallas (UTD) is the fastest growing academic institution in the U. T. System having increased enrollment by 4,065 students in thelast three years. In 2012 - 2013, UTD has about 47% of students receiving need-based grant aid with an average academic cost of 3,454. UTD indicates that more than half of UTD freshmen pay 0 for required tuition and fees.UTD has increased first year retention rates from 78% in 2005 to 89% in 2013. UTD ranks second compared to its peers with agraduation rate of about 48% for the 2009 cohort. Degree production increased about 17% between 2011 and 2013.In addition
U. T. Arlington (UTA) requests an 8.0% increase for Fall 2014 guaranteed tuition plans over and above the Fall 2013 total average academic cost under the traditional rate plan. U. T. Arlington requests a 4.0% increase for Fall 2015 guaranteed tuition