Transcription
WHITE PAPERPerformance Testing ofSQL Server on KaminarioK2 StorageSeptember 2016TABLE OF CONTENTS2Executive Summary3Introduction to Kaminario K25Performance Tests for SQL Server14Summary15Appendix: Test System Configuration17About Kaminario
WHITE PAPERExecutive SummaryDatabases such as SQL Server form the circulatory system of most organizations, delivering both sustaining transaction-based customer revenue and internal business information that drives insights and innovations. Because of their key rolein IT infrastructure, much can be gained by virtualizing and consolidating these database servers, including reducingcosts, improving resilience and simplifying management.The high latencies and complexity of hybrid and hard drive storage arrays can make it very difficult to get goodperformance from these business-critical SQL Server databases. With real-world workloads from virtual database servers,I/O processes that might otherwise have been relatively sequential become an unpredictable blend of random I/O. Thiscan spike the read/write activity of hard disk heads, increase latency and drive down database responsiveness. This I/Orandomization is not specific to SQL Server and can occur with all virtualization and database platforms.The usual method of addressing these issues is to over-allocate storage capacity, greatly inflating both purchase andoperating costs. A better alternative is to eliminate rotating disks and move to All-Flash Arrays. With most All-FlashArrays, this approach can succeed technically, but be too costly to be practical with large database servers.To address this, Kaminario’s K2 array combines a very low price per GB with consistently low latency and high IOPS andthroughput, making databases on All Flash Arrays economical. K2 provides the reliability, availability and scalabilityneeded to virtualize and cluster mission-critical SQL Server database servers.This report covers a set of performance tests that quantify the benefits of Kaminario’s K2 All-Flash Array storage forMicrosoft SQL Server, running as virtualized servers on VMware’s vSphere 5.5. The test results show the K2’s ability tosupport a range of workloads and environments with no degradation in performance or efficiency: Online Transaction Processing (OLTP) Queries – Tests simulating transaction queries showed K2 delivering anaverage of 125,000 IOPS with peaks of 135,000 IOPS, throughput averaged at 1,400 MB/s and peaked at over 2,500MB/s while latency remained below 0.5 ms. TPC-C Transactions – Throughput during the HammerDB TPC-C-based transaction tests ranged from 800 MB/sto peaks over 1200 MB/s while latency was consistently under 0.8 ms. The average transaction rate was 2.3 milliontransactions per minute, peaking at around 2,570,000 transactions per minute. IOPS averaged at 44,000 and peakedat over 51,000 IOPS. Online Analytical Processing (OLAP) – K2 supported insertions at an average rate of 7.6 million rows in 10 seconds,with throughput of 780 MB/s and 43,000 IOPS, while latency was under 0.8 ms and often as low as 0.6-0.7 ms. Mixed OLTP and OLAP Workloads – To demonstrate its ability to support the blended I/O stream of concurrentdatabase workloads, OLTP and OLAP workloads were run simultaneously. K2 ran both workloads, with IOPS andthroughput equal to the sum of the results of the individual tests.2
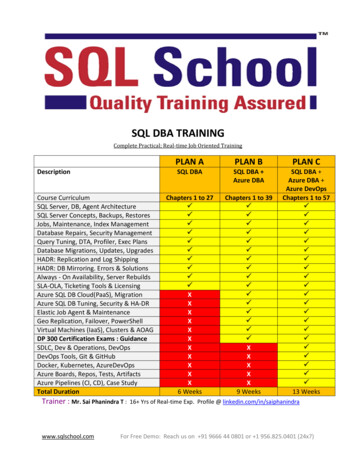
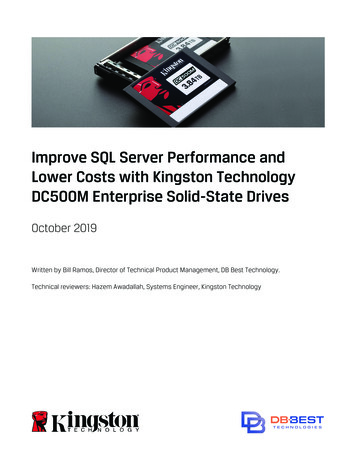
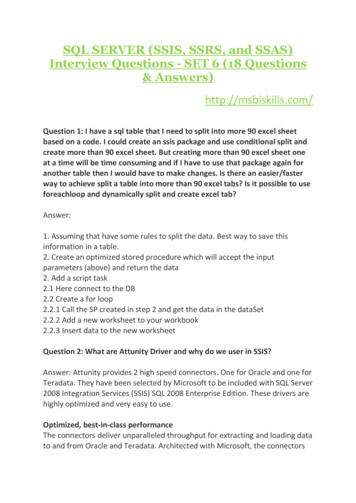
WHITE PAPER Data Reduction via K2 Compression – K2’s native compression provided a savings of two-thirds in capacity that wasonly matched by SQL Server’s Page compression, achieving that with no decrease in throughput and no extra loadon the host server CPUs. RDM vs. VMFS Performance – Tests comparing the performance and the system behavior for these two VMware diskaccess options found that they were equivalent for both OLAP and OLTP workloads. Scale-Out Testing – When host server and K2 array resources were scaled out by a factor of two, OLTP and OLAPtesting showed that the throughput increased by 1.7 times and the amount of IOPS doubled.These performance tests quantified the ability of Kaminario’s K2 All-Flash Arrays to support virtualized SQL Serverdatabase servers under real-world workloads that would overwhelm other legacy and hybrid storage arrays.Introduction to Kaminario K2Founded by storage experts, Kaminario is releasing its fifth-generation product with a design that is years ahead of otherstorage vendors. The new K2 enterprise-class All-Flash Array continues to leverage Kaminario’s Scalable Performanceand Resilience Architecture (SPEAR ) technologies. This ensures both data availability and a consistent level of highthroughput, IOPS and low latencies needed to support the demanding blend of storage I/O generated by businesscritical systems like virtualized SQL Server databases.Figure 1: K2 Architecture Diagram3
WHITE PAPERK2 has the only flash array architecture that lets you scale up, scale out or both. You can scale performance or capacitywithout impacting latency, with zero hot spots and no system tuning required. Each K-Block includes two K-Nodes(storage controllers), up to three shelves of 24 SSDs (scale-up), and either Fibre Channel or iSCSI host connectivity.K-Blocks can be added (scale-out) as shown in Figure 1 on the previous page.Key attributes of Kaminario’s new fifth-generation K2 All-Flash Array are: Low Deployment and Operating Costs – K2’s CAPEX and OPEX costs can be two-thirds of legacy or hybrid storagearrays. Optional Capacity-on-Demand pricing directly matches your investment to storage requirements. No Single Point of Failure – A shared-nothing architecture and automated recovery ensure the array can keeprunning at peak performance even with hardware failures of two concurrent failures per SSD shelf and three SSDfailures overall per shelf. Consistent High Performance – Intelligent hardware and software ensure the array delivers low latency even underpeak workloads. Non-Disruptive Everything – Software or hardware upgrades and expansion of the array are performed with nodowntime and require no manual tuning. Simple Deployment and Management – No disk groups to plan, configure or manage; everything is managed via asimple browser-based GUI. VMware integration simplifies management of K2 arrays as part of your virtualized serverinfrastructure, with a vCenter plugin and support for the VMware VAAI hardware offload/acceleration API. High-Efficiency RAID – K2’s dual-protected K-RAID is highly efficient with 87.5% of the physical capacity availablefor data storage and consistent high performance even during rebuilds. Effective Data Reduction – Global selective inline deduplication, native inline compression and thin provisioning providesavings of up to 70-90% without impacting host servers. Native Data Reduction – K2’s native inline compression provides the ability to save more than two-thirds of databasecapacity, matching the best-case SQL Server compression without any extra overhead on the host servers.More information on the features and cost effectiveness of the fifth generation of Kaminario’s K2 All-Flash Arrays canbe found on the Kaminario website.4
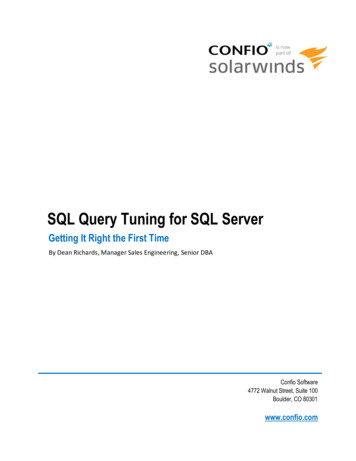
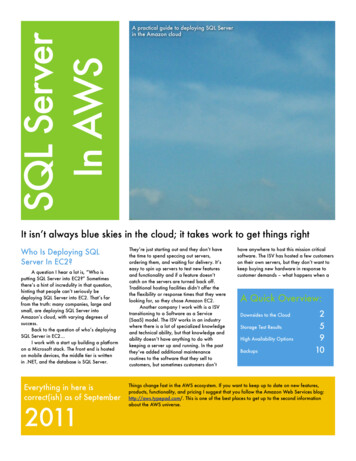
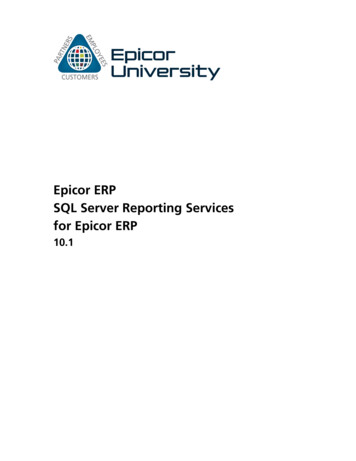
WHITE PAPERPerformance Tests for SQL ServerTo quantify the ability of Kaminario’s K2 array to support VMware-based SQL Server database servers, a set of performancetests were run on identically configured server and storage hardware. Details of the hardware and software configurationsused in the tests can be found in the appendix at the end of this report. Test results were captured by saving timedscreenshot images of the K2 GUI using the Monitor and Analysis sections of the Performance tab, to show IOPS, latencyand throughput over the test period. In most tests, the K2 array was not the limiting factor in SQL Server performance, withthroughput being limited by the server hardware as well as by the database and virtualization software.OLTP Query PerformanceChallenge: Online Transaction Processing (OLTP) is the bread and butter of most businesses. Transactions can begenerated either internally, such as form orders entered or processed by sales and fulfillment staff, or externally, suchas customers placing orders on a website or from external exchanges like an airline reservation system. OLTP typicallyinvolves a large number of small random reads and a smaller number of writes from numerous users across a broadportion of the database’s tables.The initial OLTP test process simulated the rapid and random I/O due to SELECT reads of multiple primary keys. This mixof database reads is typical of transaction-oriented applications found in banking, airlines, logistics and other industries.The OLTP test queries were executed on a 100 Million row table from multiple sources to simulate a large group of usersworking concurrently in a shared database, which was stored in a VMFS virtual disk.Figure 2: K2 GUI during OLTP Query TestingResults: The test process performed 100% random read IOPS consisting of 70% 8KB and 30% 64KB blocks. The averageof measured IOPS during the test was around 125,000 with intermittent peaks of over 135,000. The throughput duringthe test was around 1,400 MB/s with peaks of over 2,500 MB/s. Latency remained consistent at under 0.5 ms throughoutthe test. Figure 2 on the previous page shows these results in the K2 GUI during the OLTP query test.5
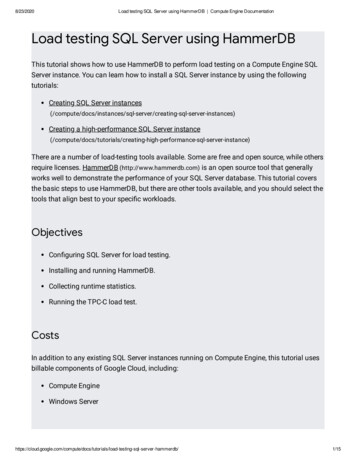
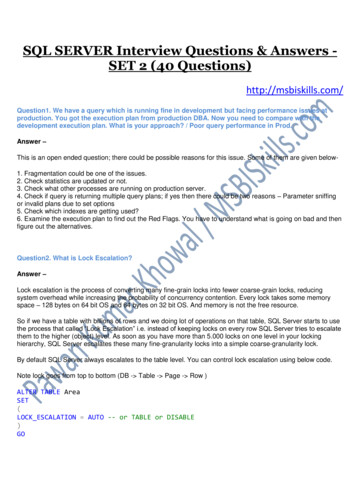
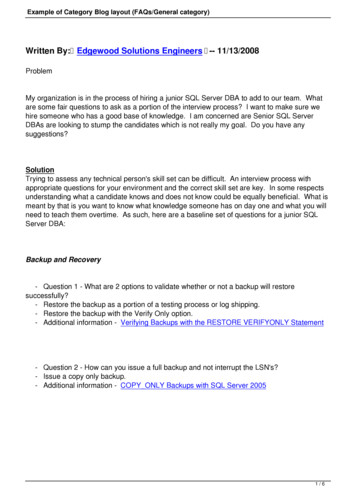
WHITE PAPEROLTP Transaction PerformanceChallenge: As part of the testing, we also simulated an OLTP workload that included complete transactions with a mix ofreads and writes. For this test, an open source database load testing and benchmarking tool called HammerDB was used.HammerDB works with a variety of databases including SQL Server and includes complete, built-in workloads basedon industry-standard OLTP benchmarks such as TPC-C, defined by the Transaction Processing Council in 1992. Moreinformation on HammerDB can be found at hammerora.sourceforge.net.TPC-C includes a mix of five different types of concurrent transactions including entering/delivering orders, recordingpayments, checking order status and monitoring stock levels, all run against nine types of database tables with awide range of record sizes and row counts. It is designed to simulate a set of concurrent users in a wholesale supplierbusiness and typically places more stress on the host server CPU and memory systems than on the supportingstorage infrastructure.Figure 3: HammerDB Console during OLTP Transaction TestingThe TPC-C workload from HammerDB was configured to represent 100 warehouses and 100 users performing 10,000transactions each. This test created a typical OLTP workload consisting mostly of small I/O blocks of 8 KB or less, with amix of 40% write and 60% read.6
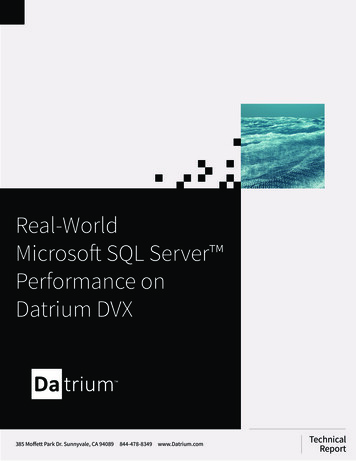
WHITE PAPERResults: During the OLTP transaction test, the average transaction rate measured by HammerDB was around 2,300,000transactions per minute (tpm) while the peak transaction rate was 2,572,500 tpm, as shown in Figure 3 on the previouspage. During the test, the average throughput of the K2 array was 350-370 MB/s, with write throughput at 140-150 MB/s.Average IOPS were about 43,000 and peaking at 51,500 IOPS, while latency remained well below 0.9 s as shown inFigure 4 below.Figure 4: K2 GUI during OLTP Transaction Testing with HammerDBOLTP PerformanceChallenge: Online Analytic Processing (or OLAP) queries are often plagued by long query and reporting times.Individual queries can run for an hour or longer and are often limited by the performance of the storage system holdingthe database. Consolidation of virtualized database servers onto shared hardware can exacerbate these delays due tocontention between periodic OLAP queries and production database activity. OLAP mainly involves large reads acrossmultiple database tables, but in anything other than the very simplest of queries, it also requires extensive write activityto create temporary tables for joins and to save the reported results.To demonstrate how K2’s low latency and high throughput can address this potential problem, this test simulated a datawarehouse running an ETL (extract-transform-load) process, specifically the transform and load portions. The test scriptspopulated a single FACT table using the SQL Server bulk operation, inserting rows into a single destination table frommultiple sources where both the database tables and the source files were stored on a VMFS disk. Array traffic consistedof 70% reads and 30% writes.7
WHITE PAPERResults: During the OLAP test, an average of 760,000 rows per second were inserted, with a throughput of 600-780 MB/sand average IOPS of around 2,000. Even under this heavy load, the K2’s latency averaged between 0.6-0.7 ms duringmost of the test period with peaks remaining under 0.8 ms.Figure 5: K2 GUI during OLAP TestingMixed OLTP/OLAP WorkloadsChallenge: Database servers generate a blended mix of I/O traffic that is particularly challenging for most storagesystems. To demonstrate the K2’s ability to easily support blended I/O that is typical of concurrent database workloads,the OLTP and OLAP workloads described above were run simultaneously.Figure 6: K2 GUI during Mixed OLTP/OLAP WorkloadsResults: K2 ran the concurrent OLTP and OLAP workloads with IOPS and throughput equal to the sum of the results ofthe prior individual tests. No degradation or congestion were seen during this mixed workload test. Throughput duringthe tests was between 1,700 MB/s to over 3,000 MB/s and IOPS ranged from 100,000 to over 140,000, while latencyremained under 0.7 ms.8
WHITE PAPERRDM vs. VMFS Performance ComparisonChallenge: VMware vSphere offers two options for managing virtual machine disk accesses to an All-Flash Array likeK2 – VMware Virtual Machine File System (VMFS) and virtual Raw Device Mapping (RDM).The selected disk accessmethod can be a factor in optimizing application performance on VMware-based database servers.VMFS is a distributed file system allowing concurrent access from multiple virtual hosts, optimized for large files likedatabases. RDM is a mapping file in a VMFS volume that acts as a proxy for a raw physical device and provides theadvantages of direct access to physical storage with the manageability of VMFS. Although VMFS is the preferred choicefor many enterprise applications including database servers, the raw disk access provided by RDM is needed in somecases such as disks shared between clusters of virtual machines. The relative performance of VMFS and RDM is largelydependent on a combination of the supporting storage system and the type of disk access being performed, such asrandom vs. sequential or read vs. write. Kaminario’s K2 array supports both of these VMware disk access methods.To compare the relative performance of VMFS and RDM on K2, the same OLAP and OLTP Query tests described in theprevious sections were run on the same database, using the same server and storage configuration. One test run wasperformed using all VMFS disks while a second run was done with all disks configured as RDM.Results: For both workloads, there was no significant difference in average array throughput, IOPS or latency betweenthe two disk access methods, as measured by the K2 GUI. Detailed results are shown in Table 1 below.Table 1: Comparison of RDM and VMFS PerformanceType of Workload/DiskThroughput (MB/s)IOPSLatency (ms)OLAP on RDM7732,776 0.68OLAP on VMFS7682,976 0.65OLTP Query on RDM1,584148,584 0.44OLTP Query on VMFS1,606143,092 0.46K2 Native Compression vs. SQL Server CompressionChallenge: K2’s native global data compression can reduce the need for storage capacity for SQL Server VirtualMachine Disks used to store database files. By offloading compression processing from the host CPU to the storagearray, Kaminario’s K2’s native compression delivers the same best-case capacity savings. Customers can also benefitfrom better performance for some workloads (such as DML queries). If the workload requires compression in SQL Server,having both SQL Server and K2 compression will provide the best optimal performance.To demonstrate the K2 compression effect on storage savings, CPU and queries’ elapsed time, two types of testswere executed: OLAP data load test (with 70% reads and 30% writes) Running a large report against multiple tables9
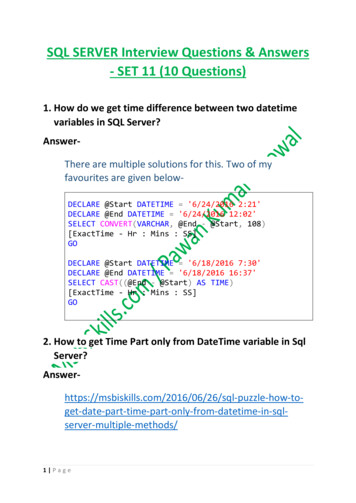
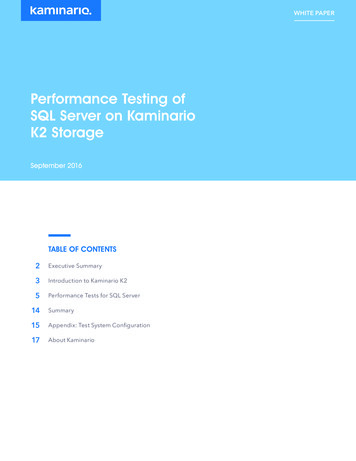
WHITE PAPEROLAP Data Load Compression TestingThe OLAP data load test demonstrated the effect of the different compression methods on capacity requirements andCPU load. All of the tests were performed on a K2 volume group without data deduplication and using VMware VMFSvirtual disks. The test measured three different metrics for each compression method: Elapsed time of loading a constant dataset into a database table using SQL Server bulk operation SQL Server host CPU utilization during the operation Physical capacity usage of the table after loading the datasetA sequence of six tests was performed with the same database content and SQL Server virtual machine. The first threewere run with no compression done by the K2 array, while the subsequent three tests were run with the K2’s nativecompression along with either SQL Server’s row or page compression in the last two tests.Results: The series of tests showed that using K2’s native compression delivers the same capacity savings as the mosteffective compression option provided by SQL Server, but without any increase in host CPU overhead. Combining K2’snative compression with SQL Server’s page compression did yield a further 10% reduction in capacity, but doubled thelength of processing due to the overhead of the SQL Server page compression. The results for all of the tests are shownin Table 2 below and Figure 7 on the next page.Table 2: SQL Server and K2 Native Compression Methods in OLAP Load TestCompression MethodK2CompressionRowCompressionPageCompressionDB File Size(GB)159.2 Compression% / RatioNoneAverage HostCPU Load %Elapsed Time(Minutes)62%25127.480% / 1.25:166%2850.932% / 3.15:169%5050.932% / 3.15:162%2548.830% / 3.25:164%2835.322% / 4.5:167%5010
WHITE PAPERNo Compression159.2 GBSQL ServerRow Compression127.4 GBSQL ServerPage Compression50.9 GB32%80%100%K2 NativeCompression50.9 GB32%K2 SQL ServerRow Compression48.8 GBK2 SQL ServerPage Compression35.3 GB30%22%Figure 7: Comparison of OLAP Load Test Compression Method ResultsLarge Report Compression TestingThe large report test ran a report execution joining multiple tables and performing clustered index scan operations. Thistype of activity is common for large SQL Server implementations typical in data warehouses and business intelligencesystems. The large report test showed the effect of the K2 native compression on the elapsed time of the report creation.The same set of six different configurations as in the OLAP data load test was used. The best performance (elapsed time)was achieved using both K2 and SQL Server page compression. The full results are shown in Table 3 below.Table 3: : SQL Server and K2 Compression Performance in Large Report TestCompression MethodK2 CompressionRow CompressionPage CompressionElapsed Time (seconds)5.03 3.99 2.205.03 4.19 1.9411
WHITE PAPERThese tests show how the K2 flexibly delivers best-case compression results and/or best-case performance resultsfor any workload type. Users can select the best way to configure their environment and leverage the K2 benefitsthat are most suited to their needs. For environments experiencing long data load times and high CPU utilization, it isrecommended to use only the K2 compression, while environments that require faster report generation would benefitfrom applying both K2 compression and SQL Server page compression.Consistent Low Latency Under LoadChallenge: To ensure that storage performance does not decrease as workloads vary and scale up, K2 arrays provideconsistent low latency even under significant workloads. To demonstrate this, latencies were measured via the K2 GUI atdifferent workload levels. Specifically, OLTP query, OLTP transaction and OLAP workloads described at the beginni
HammerDB works with a variety of databases including SQL Server and includes complete, built-in workloads based on industry-standard OLTP benchmarks such as TPC-C, defined by the Transaction Processing Council in 1992. More information on Ham