Transcription
Real-WorldMicrosoft SQL Server Performance onDatrium DVX385 Moffett Park Dr. Sunnyvale, CA 94089844-478-8349www.Datrium.comTechnicalReport
HighlightsIntroduction:MicrosoftSQL ServerPerformanceon DatriumDVXA single VM running Microsoft SQL Server 2014 TPC-C databaseachieved over 2 Million SQL Server transactions per minute (TPM) withHammerDB. The SQL Server TPC-C benchmark read average latencywas 0.9 milliseconds and the flash read hit rate was 100%. The averageapplication write latency was slightly north of 2 milliseconds.The purpose of this technical note is to demonstrate the real-worldproduction performance of a virtualized Microsoft SQL Server on aDatrium DVX platform.IT organizations virtualizing Microsoft SQL Server with Datrium DVX findthat the solution is fast, efficient, and most importantly, predictable.With Datrium DVX, enterprises can scale application performanceindependently from storage capacity due to an innovative OpenConverged approach. Furthermore, with Datrium, IT admins can chooseto use existing x86 servers, deploy new x86 servers, or deploy a DatriumDVX Rackscale platform to build an elastic private cloud infrastructurefor literally any application workload.This document assumes that the reader has some familiarity withMicrosoft SQL Server administration, HammerDB, and the Datrium DVXplatform. This is document is not intended to portrait a Datrium DVXreference architecture.Datrium DVXConfigurationsFor this Microsoft SQL Server benchmark, a DVX CN2000 server was usedas the Datrium DVX compute node. In this document, a Datrium DVXcompute node uses the VMware ESXi hypervisor.The server configuration chosen for this benchmark performance test isa Datrium DVX Compute Node. Additionally, the Datrium DVX computenode was configured with 2TB of usable Flash to service all active data forthe Microsoft SQL Server databases. Figuring out what features should beenabled in an environment with 1000s of VMs and applying settings ona per-VM or per-some-group-of-objects basis is simply too cumbersomefor the IT admin and unnecessary. Datrium DVX was designed from theground up to support all data services turned ON all the time.Important: The benchmark presented in this document uses in-linechecksumming, compression, deduplication, and distributed ErasureCoding to fully protect the system and databases against failures.
Datrium DVX System Informationtable 1Virtual MachinesA virtual machine (VM) was configured for the Microsoft SQL Serverperformance testing on the Datrium DVX compute node. The Windows2012 virtual machine had the following vDisks created to separateOperating System and Microsoft SQL files: Operating System disk for:-vDisk 0 - Windows 2012 R2 Data CenterMultiple data disks for:-vDisk 1 - database-vDisk 2 - database log-vDisk 3 - TempDB-vDisk 4 - TempDB logAll vDisks for the Microsoft SQL Server VM were Thin Provisioned, andthere is no tuning required for the ESXi datastore in use. In fact, vDiskThin Provisioning is a Datrium best practice. The Datrium DVX storage ispresented as an NFS mount to the ESXi server and is natively optimizedfor performance. For a deeper dive into Datrium DVX architecture andhow the system is natively optimized for application performance, reviewthe Datrium DVX Architecture technical whitepaper.Virtual Machine System Informationtable 2
Datrium recommends the reading of the “Best Practices for DeployingSQL Server Using vSphere” section in the VMware’s Microsoft SQL ServerBest Practices Guide for additional best practices and guidelines on:1 ] Host Configuration2 ] CPU Configuration3 ] Memory Configuration4 ] Network ConfigurationThe Microsoft SQL Server VM – in this test – was not setup for HA at the VMor application layer. For recommendations and guidelines on HA and DR,review Datrium’s Microsoft SQL Server HA and DR with Datrium DVX whitepaper.HammerDBHammerDB is a free database load testing and benchmarking tool fordatabases. For this test, we have chosen the TPC-C schema to build aroughly 500 GB database (to start) of 5,000 warehouses and used morethan 500 concurrent users to drive the database transactions with nothink-time enabled.TPC-C simulates online transaction processing (OLTP) workloads that aretypically identified by a database receiving both requests for data andmultiple changes to the data from user transactions. The HammerDBworkload simulated roughly a 70:30 split of read/write transactions at8KB block size in most of the test runs.Multiple test runs were executed as we tuned the SQL Server applicationparameters to get the maximum SQL Server transactions per minute(TPM). We chose to perform our tests with a Microsoft SQL Server VM thathas 12 vCPU and 256 GB RAM.Microsoft SQL Server 2014The Microsoft SQL Server 2014 database was built and populated usingHammerDB. At the start of the test run, the initial size of the TPC-C(OLTP) database was 500 GB, and the Microsoft SQL Server data disksare later extended as the Microsoft SQL Server database grew during theperformance tests.Review the “SQL Server and In-Guest Best Practices” section in theVMware’s Microsoft SQL Server Best Practices Guide for additionalrecommendations on optimization at the SQL Server and Windows Serverside.
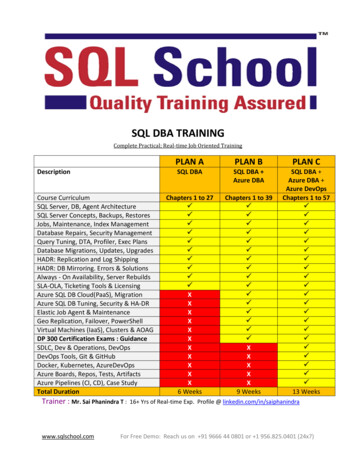
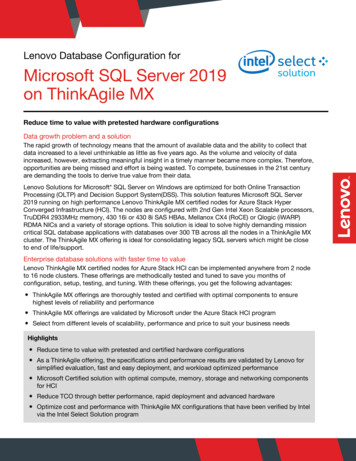
For Datrium’s best practices for VMware and applications on DatriumDVX, existing Datrium customers can access the current Datrium DVXHandbook.ArchitectureHigh Level OverviewFigure 1 shows a high-level overview of the Microsoft SQL Server 2014setup on a Datrium DVX.Microsoft SQL Server on Datrium DVXfigure 1Windows 2012 SMB File Share Clients were used as a target for MicrosoftSQL Server native backups. Additionally, during the tests Datrium DVXsnapshots were used to protect the Microsoft SQL Server, allowing us toperform tests as normal Datrium DVX operations and to able to revert theenvironment to a known good state, if necessary.
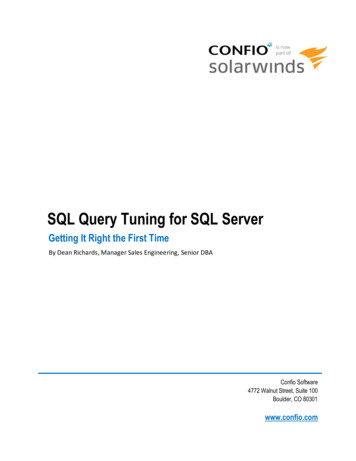
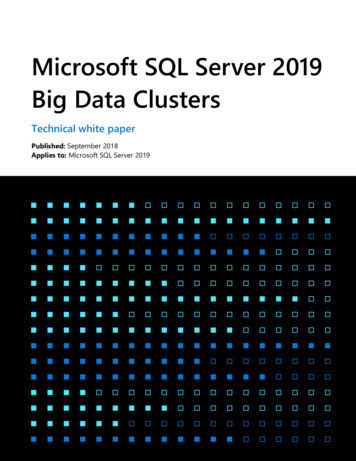
The platform used for this benchmark uses a single compute node and asingle data node. While the minimum DVX configuration is one computenode and one data node, and that is what is being tested in this benchmark,DVX Split Provisioning (see figure 2) allows scalability up to 128 computenodes and 10 data nodes in a single system. The system-wide performanceand capacity is up to 200 gigabytes per second (GB/s) of read bandwidthand 18 million IOPS, 10 GB/s write throughput, and 1.7 petabytes (PB) ofeffective capacity.Datrium DVX Scale-Out Matrixfigure 2SQL TestsAs part of this performance benchmark exercise the following tests wereperformed:1 ] HammerDB SQL Server TPC-C benchmark with Datrium DVX2 ] HammerDB SQL Server TPC-C benchmark with Datrium DVX duringSteady-StateDuring the tests, VM level performance metrics in the Datrium DVX wasutilized to monitor and tune parameters at the application layer. As withany performance testing, it is not recommended to tweak all availableparameters simultaneously. It is best to tune one parameter at a time andmonitor if performance is improved before making additional changes.Review Microsoft’s recommendation and guidelines for the “max degreeof parallelism” configuration option for more information on MicrosoftSQL Server tuning.
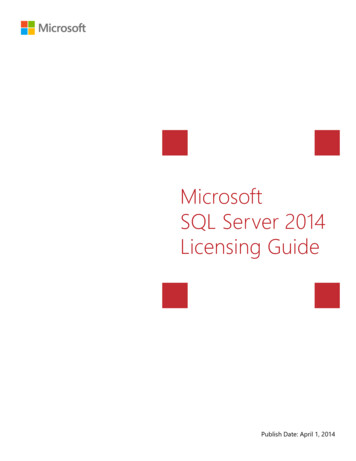
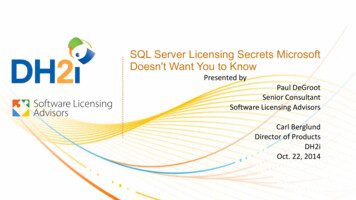
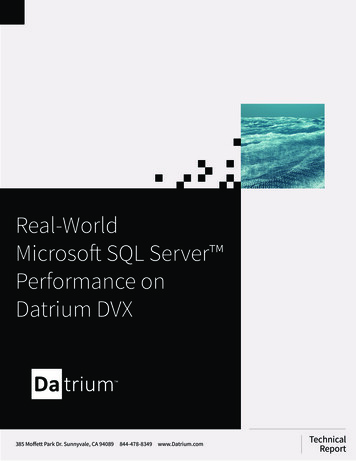
MonitoringSQL Server TPC-C benchmark performanceFigure 3 demonstrates the HammerDB SQL Server performancenumbers achieved with Datrium DVX in Fast Mode. Fast mode is theregular operation mode for a Datrium DVX compute node, whereas amaximum of 20% host CPU utilization is allocated to the storage IOand data services. In this benchmark test run (Figure 3), the MicrosoftSQL Server 2014 TPC-C database achieved over 2 Million SQL Servertransactions per minute (TPM) with HammerDB TPC-C workloads.Datrium DVX also provides the ability to enable Insane Mode allowingcompute nodes to utilize up to 40% of host CPU to improve storage IOoperations. This benchmark is not using Insane Mode.HammerDB SQL Server TPC-C Benchmarkfigure 3The SQL Server TPC-C benchmark average read latency was 0.8milliseconds and the flash read hit rate was 100%. The average writelatency was slightly above 2 milliseconds (see figure 4).Datrium DVX DAVG Latencyfigure 4
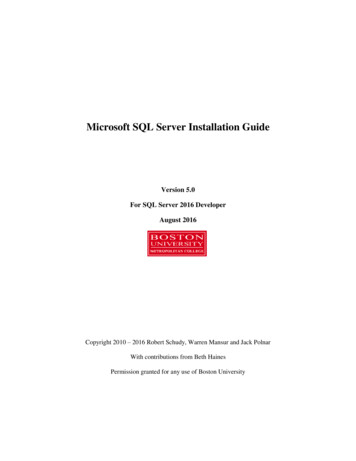
SQL Server TPC-C benchmark performance in Steady-StateIn this document, we define Steady-State when space reclamation andsnapshots are enabled and in use to protect VMs and applications.Generally, during Steady-State, space reclamation processes would kick inwhen the data node cluster reaches 75% capacity utilization.A Datrium DVX protection group was created during the test to protectthe Microsoft SQL Server VM with multiple native DVX snapshots beingcreated during the performance benchmark. The objective of this test is todetermine if application performance is affected during Steady-State.Figure 5 shows real-time statistics captured while space reclamation(manually started) and snapshots were in used to protect the MicrosoftSQL Server VM. In this test run (see figure 5), the HammerDB transactioncounter achieved north of 1.8 million TPM and the Microsoft SQL Server VMperformance is not much affected during Steady-State.HammerDB SQL Server TPC-C benchmark during Steady-Statefigure 5Figure 6 shows the DAVG latency during DVX Steady-State. The SQL ServerTPC-C benchmark average read latency was 0.9 milliseconds and the flashread hit rate was 100%. The average write latency was slightly above 2milliseconds.Datrium DVX DAVG Latency during Steady-Statefigure 6
ConclusionThe results demonstrate that Datrium DVX can host Microsoft SQLServer 2014 databases with sub-millisecond latencies for read operations. A single Microsoft SQL Server VM - with 12 vCPU and 256 GBof RAM – can achieve 2 Million TPM before reaching 100% VM vCPUutilization.During Steady-State, the HammerDB counters demonstrated that theMicrosoft SQL Server VM could nevertheless produce over 1.8 MillionTPM, showing that snapshot chaining and space reclamation processesdo not seriously affect application performance.With the Microsoft SQL Server VM in this configuration, it is possibleto keep the transactions consistently above 1.7 Million TPM but thatmeans the Microsoft SQL Server VM busy is always at 100% vCPU utilization (Figure 7).SQL Server VM CPU and Memory Performancefigure 7While the minimum DVX configuration is one compute node and onedata node, and that is what is being tested in this benchmark, DVX SplitProvisioning allows scalability up to 128 compute nodes and 10 datanodes in a single system. The overall system-wide performance andcapacity is up to 200 gigabytes per second (GB/s) of read bandwidthand 18 million IOPS, 10 GB/s write throughput, and 1.7 petabytes (PB)of effective capacity. It is important to note that during the HammerDBTPC-C benchmark performance tests, the average read latencies wassub-milliseconds with more than 1.8 Million TPM - even during DatriumDVX Steady-State.Important: This benchmark exercise was not designed to drive maximum IOPs or maximum HammerDB TPC-C TPM consistently and it is not a reference architecture paper.In production environments, VMs consistently running at 100% vCPU utilization wouldtrigger alarms at the host and VM levels.About theAuthorDominic Cheah is a Technical Marketing Engineer on the Solutions andAlliances group at Datrium, Inc. In his role, Dominic focuses onbusiness-critical applications, DevOps, databases, and data protection.
1 ] HammerDB SQL Server TPC-C benchmark with Datrium DVX 2 ] HammerDB SQL Server TPC-C benchmark with Datrium DVX during Steady-State During the tests, VM level performance metrics in the Datrium DVX was utilized to monitor and tune parameters at the application layer. As with any performa