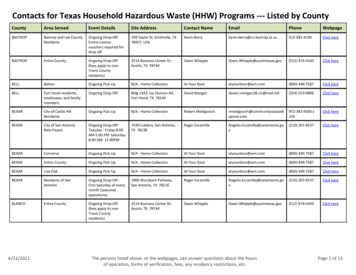
Transcription
CENTER FOR MICROECONOMIC DATAW W W . N E W Y O RKF ED. ORG/ MI CROE CONO M ICSQ U AR T E R L YR E P O R TO NHOUSEHOLDDEBT AND CREDIT20 20 :Q3 (RELEASED NOVEMBER 2020)FEDERAL RESERVE BANK of NEW YORKR E S E A R C H A N D S TAT I S T I C S G R O U PANALYSIS BASED ON NEW YORK FED CONSUMER CREDIT PANEL/EQUIFAX DATA
Household Debt and Credit Developments in 2020Q31Aggregate household debt balances increased by 87 billion in the third quarter of 2020, a 0.6% rise from 2020Q2, and nowstand at 14.35 trillion. The increase offsets the decline seen in the second quarter of 2020. Balances are 1.68 trillion higher, innominal terms, than the 2008Q3 peak of 12.68 trillion and 28.7% above the 2013Q2 trough.BalancesMortgage balances shown on consumer credit reports on September 30 stood at 9.86 trillion, an 85 billion increase from2020Q2. Balances on home equity lines of credit (HELOC) saw a 13 billion decline, the 15th consecutive decrease since 2016Q4,bringing the outstanding balance to 362 billion. Credit card balances declined slightly in the third quarter, by 10 billion, on the heelsof the 76 billion decline in 2020Q2, the steepest decline in card balances seen in the history of the report, reflecting continuedweakness in consumer spending as well as active paydowns by cardholders. Auto loan balances increased by 17 billion in the thirdquarter. Student loan balances increased by 9 billion. In total, non-housing balances increased by 15 billion, following the 86billion decline seen during the second quarter.OriginationsNew extensions of credit were robust in 2020Q3, with an expansion of newly originated mortgages and auto loans. Mortgageoriginations, which we measure as appearances of new mortgage balances on consumer credit reports and which include refinances,were at 1.05 trillion, the second highest volume in the history of the series, second only to the historic refinance boom in 2003Q3.Auto loan originations reached a record high for the series, with 168 billion in newly originated auto loans, which includes both loansand leases. In contrast, both HELOC and credit cards saw declines in aggregate credit limits. Aggregate credit limits on credit cardsdeclined by 31 billion, continuing the decline of 53 billion from 2020Q2. Aggregate credit limits on HELOC accounts declined by 16 billion.Median mortgage origination credit scores increased again in the third quarter, to 786, reflecting an increase in refinances.The median credit score on newly originated auto also increased, from 707 to 712.Delinquency & Public RecordsAggregate delinquency rates have dropped markedly in the second and third quarter, reflecting an uptake in forbearances(provided by both the CARES Act and voluntarily offered by lenders), which protect borrowers’ credit records from the reporting ofskipped or deferred payments. Note that accounts in forbearance might be categorized as delinquent on the lender’s book, but typicallyas current on the credit reports. As of September 30, 3.4% of outstanding debt was in some stage of delinquency, a 0.2 percentagepoint decrease from the second quarter, and 1.4 percentage points lower than the rate observed in the fourth quarter of 2019 and beforethe Covid pandemic hit the United States. Of the 485 billion of debt that is delinquent, 363 billion is seriously delinquent (at least90 days late or “severely derogatory”, which includes some debts that have been removed from lenders books but upon which theycontinue to attempt collection).The uptake in forbearances continues to be visible in the delinquency transition rates for mortgages. The share of mortgagesthat transitioned to early delinquency remained at a very low 0.5%, as the option to enter forbearance remained. Meanwhile, 47% ofloans in early delinquency transitioned to current. There were only 16,000 new foreclosure starts; given that homeowners withfederally backed mortgages are currently protected from foreclosure through a moratorium in the CARES Act.Delinquency rates by product flattened after sharp declines in the second quarter, and new transitions into early delinquencydeclined across the board, continuing to reflect the various borrower assistance programs available. The share of student loans thattransitioned to delinquency continue to fall after a sharp drop in the second quarter, as the majority of outstanding federal studentloans are covered by CARES Act administrative forbearances. With federally-backed mortgages also eligible for forbearances, theshare of mortgages that transitioned into delinquency fell to 2.5% (annualized) in the third quarter, down nearly a whole percentagepoint since the fourth quarter of 2019. Auto loans and credit cards also showed continued declines in their delinquency transitionrates, reflecting the impact of government stimulus programs and bank-offered forbearance options for troubled borrowers.About 132,000 consumers had a bankruptcy notation added to their credit reports in 2020Q3, a large decline from theprevious quarter and a new historical low. The share of consumers with a collection also declined sharply.Housing Debt There was 1.05 trillion in newly originated mortgage debt in 2020Q3.1This report is based on the New York Fed Consumer Credit Panel, which is constructed from a nationally representative random sample drawn from Equifax creditreport data. For details on the data set and the measures reported here, see the data dictionary available at the end of this report. Please contact Joelle Scally withquestions at joelle.scally@ny.frb.org.
About 0.6% of current mortgage balances became delinquent in 2020Q3, continuing the trend of very low delinquency transitionsdue to borrowers enrolling in forbearance programs.About 16,000 individuals had a new foreclosure notation added to their credit reports between July 1 and September 30, by far thelowest level we have seen since the beginning of our series in 1999.Student Loans Outstanding student loan debt stood at 1.55 trillion in the third quarter a 9 billion increase from the second quarter. About 6.5% of aggregate student debt was 90 days delinquent or in default in 2020Q3.2 The lower level of student debtdelinquency reflects a Department of Education decision to report current status on loans eligible for CARES Act forbearances.Account Closings, Credit Inquiries and Collection Accounts The number of credit inquiries within the past six months – an indicator of consumer credit demand – was at 122 million, a smalldecline from the previous quarter. Account openings declined by 8 million accounts to 195 million following a larger drop in the second quarter.2As explained in a 2012 report, delinquency rates for student loans are likely to understate effective delinquency rates because about half of these loans are currently indeferment, in grace periods or in forbearance and therefore temporarily not in the repayment cycle. This implies that among loans in the repayment cycle delinquencyrates are roughly twice as high.
November 2020FEDERAL RESERVE BANK OF NEW YORKRESEARCH AND STATISTICS MICROECONOMIC STUDIESTable of ContentsNATIONAL CHARTSTotal Debt Balance and its Composition.3Number of Accounts by Loan Type.4Total Number of New and Closed Accounts and Inquiries.5Mortgage Originations by Credit Score.6Credit Score at Origination: Mortgages.7Auto Loan Originations by Credit Score.8Credit Score at Origination: Auto Loans.9Credit Limit and Balance for Credit Cards and HE Revolving .10Total Balance by Delinquency Status.11Percent of Balance 90 Days Delinquent by Loan Type.12Flow into Early Delinquency (30 ) by Loan Type.13Flow into Serious Delinquency (90 ) by Loan Type.14Quarterly Transition Rates for Current Mortgage Accounts .15Quarterly Transition Rates for 30-60 Day Late Mortgage Accounts .16Number of Consumers with New Foreclosures and Bankruptcies .17Third Party Collections.18SELECT CHARTS BY AGETotal Debt Balance By Age.20Debt Share by Product Type and Age (2020Q3).21Auto Loan Originations by Age.22Mortgage Originations by Age.23Quarterly Transition into Serious Delinquency (90 ) by Age.24Quarterly Transition into Serious Delinquency (90 ) for Mortgages by Age.25Quarterly Transition into Serious Delinquency (90 ) for Auto Loans by Age.26Quarterly Transition into Serious Delinquency (90 ) for Credit Cards by Age.27Quarterly Transition into Serious Delinquency (90 ) for Student Loans by Age.28New Foreclosures by Age.29New Bankruptcies by Age.30CHARTS BY SELECT STATETotal Debt Balance Per Capita by State.32Composition of Debt Balance per Capita* by State (2020Q3) .33Delinquency Status of Debt Balance per Capita* by State (2020Q3) .34Percent of Balance 90 Days Late by State.35Percent of Mortgage Debt 90 Days Late by State .36Quarterly Transition Rates into 30 Days Late by State.37Quarterly Transition Rates into 90 Days Late by State .38Percent of Consumers with New Foreclosures by State .39Percent of Consumers with New Bankruptcies by State .40
Page Left Blank Intentionally1
NATIONAL CHARTS2
Total Debt Balance and its CompositionTrillions of Dollars15MortgageHE RevolvingAuto LoanCredit CardStudent LoanOther2020Q3 Total: 14.35 Trillion2020Q2 Total: 14.27 Trillion(3%)(11%)(6%)12(9%)(3%)96(69%)30Source: New York Fed Consumer Credit Panel/Equifax3
Number of Accounts by Loan TypeMillionsMillions250500Credit Card200400150Auto Loan(Left Axis)100300200Mortgage(Left Axis)50100HE Revolving(Left Axis)00Source: New York Fed Consumer Credit Panel/Equifax4
Total Number of New and Closed Accounts andInquiriesMillionsMillions400400Number of Accounts Closed within 12 Months350350300300250250200200150150100Number of Inquiries within 6 Months100Number of Accounts Opened within 12 Months505000Source: New York Fed Consumer Credit Panel/Equifax5
Mortgage Originations by Credit Score*Billions of Dollars1,200Billions of Dollars1,200 620620-659660-7191,000720-759760 1,00080080060060040040020020000Source: New York Fed Consumer Credit Panel/Equifax* Credit Score is Equifax Riskscore 3.06
Credit Score at Origination: Mortgages*Score800Score80050th percentile75075025th percentile70070010th percentile650650600600550550500500Source: New York Fed Consumer Credit Panel/Equifax* Credit Score is Equifax Riskscore 3.0; mortgages include first-liens only.7
Auto Loan Originations by Credit Score*Billions of DollarsBillions of Dollars200 620620-659660-719720-759760 2001601601201208080404000Source: New York Fed Consumer Credit Panel/Equifax* Credit Score is Equifax Riskscore 3.08
Score800Credit Score at Origination: Auto Loans*750Score80075050th percentile70070065025th percentile60065060010th percentile550550500500Source: New York Fed Consumer Credit Panel/Equifax* Credit Score is Equifax Riskscore 3.09
Credit Limit and Balance for Credit Cards and HERevolvingTrillions of DollarsTrillions of Dollars44HELOC BalanceCC BalanceCC LimitHELOC Limit33221100Source: New York Fed Consumer Credit Panel/Equifax10
Total Balance by Delinquency StatusPercent14Percent14Severely Derogatory120 days late90 days late60 days late30 days lateZero121210108866442200Source: New York Fed Consumer Credit Panel/Equifax11
Percent15Percent of Balance 90 Days Delinquentby Loan TypePercent15Credit CardStudent Loan1010Auto Loan5Mortgage5HE Revolving00Source: New York Fed Consumer Credit Panel/Equifax12
Transition into Delinquency (30 ) by Loan TypePercent of Balance16Percent of Balance16141412Student Loan10108Auto LoanCredit Card6412MortgageHE Revolving8642200Source: New York Fed Consumer Credit Panel/EquifaxNote: 4 Quarter Moving SumStudent loan data are not reported prior to 2004 due to uneven reporting13
Transition into Serious Delinquency (90 )by Loan TypePercent of BalancePercent of Balance1212Student Loan10810866MortgageCredit Card424Auto Loan2HE Revolving0Source: New York Fed Consumer Credit Panel/Equifax0Note: 4 Quarter Moving SumStudent loan data are not reported prior to 2004 due to uneven reporting14
Quarterly Transition Rates for Current MortgagePercentPercentAccounts3.53.53.03.0To 30-60 days late2.52.52.02.01.51.51.0To 90 days late1.00.50.50.00.0Source: New York Fed Consumer Credit Panel/Equifax15
Quarterly Transition Rates for 30-60 Day LateMortgage AccountsPercent70Percent7060506050To 90 days late404030302020To Current101000Source: New York Fed Consumer Credit Panel/Equifax16
Number of Consumers with New ource: New York Fed Consumer Credit Panel/Equifax17
Third Party CollectionsPercentDollars16151,600Percent of consumerswith collection(Left Axis)1,500141,400131,300121,200111,10010Average collection amountper person with collection(Right Axis)1,000990088007700Source: New York Fed Consumer Credit Panel/Equifax18
SELECT CHARTS BY AGE19
Total Debt Balance by AgeTrillions of Dollars1518-2930-3940-4950-5960-69Trillions of Dollars1570 121299663300Source: New York Fed Consumer Credit Panel/EquifaxNote: Age is defined as the current year minus the birthyear of theborrower. Age groups are re-defined each year. Balances may not add upto totals due to a small number of individuals with unknown birthyears.20
Debt Share by Product Type and Age (2020 Q3)Auto LoansCredit CardMortgageHELOCStudent LoansOther100%80%60%40%20%0%18-2930-39Source: New York Fed Consumer Credit Panel/Equifax40-4950-5960-6970 Note: Age is defined as the current year minus the birthyear of theborrower. Age groups are re-defined each year. Balances may not add upto totals due to a small number of individuals with unknown birthyears.21
Auto Loan Originations by AgeBillions of Dollars20018-2930-3940-4950-5918060-69Billions of Dollars18070 160160140140120120100100808060604040202000Source: New York Fed Consumer Credit Panel/EquifaxNote: Age is defined as the current year minus the birthyear of theborrower. Age groups are re-defined each year. Balances may not add upto totals due to a small number of individuals with unknown birthyears.22
Mortgage Originations by AgeBillions of Dollars1,20018-2930-3940-4950-591,00060-69Billions of Dollars1,20070 1,0008008006006004004002002000Source: New York Fed Consumer Credit Panel/Equifax0Note: Age is defined as the current year minus the birthyear of theborrower. Age groups are re-defined each year. Balances may not add upto totals due to a small number of individuals with unknown birthyears.23
Transition into Serious Delinquency (90 )Percent of BalancePercent of 0 60-693221100Source: New York Fed Consumer Credit Panel/EquifaxNote: 4 Quarter Moving Sum.Age is defined as the current year minus the birthyear of the borrower.Age groups are re-defined each year.24
Transition into Serious Delinquency (90 ) forPercent of BalanceMortgages by AgePercent of Balance1212101018-2930-3940-498864660-69470 250-590Source: New York Fed Consumer Credit Panel/Equifax20Note: 4 Quarter Moving Sum.Age is defined as the current year minus the birthyear of the borrower.Age groups are re-defined each year.25
Transition into Serious Delinquency (90 ) forPercent of BalanceAuto Loans by AgePercent of Balance6546518-2930-3943350-5940-492260-691170 0Source: New York Fed Consumer Credit Panel/Equifax0Note: 4 Quarter Moving Sum.Age is defined as the current year minus the birthyear of the borrower.Age groups are re-defined each year.26
Transition into Serious Delinquency (90 ) forPercent of BalanceCredit Cards by AgePercent of Balance15121518-2940-491250-599930-396670 60-693300Source: New York Fed Consumer Credit Panel/EquifaxNote: 4 Quarter Moving Sum.Age is defined as the current year minus the birthyear of the borrower.Age groups are re-defined each year.27
Transition into Serious Delinquency (90 ) forPercent of BalanceStudent Loans by AgePercent of Balance151540-49121230-39918-29950 663300Source: New York Fed Consumer Credit Panel/EquifaxNote: 4 Quarter Moving Sum.Age is defined as the current year minus the birthyear of the borrower.Age groups are re-defined each year28
Thousands600New Foreclosures By Age18-2930-3940-4950-5960-6970 Thousands6005005004004003003002002001001000Source: New York Fed Consumer Credit Panel/Equifax0Note: 4 Quarter Moving Sum.Age is defined as the current year minus the birthyear of the borrower.Age groups are re-defined each year. Balances may not add up to totalsdue to a small number of individuals with unknown birthyears.29
Thousands1,000New Bankruptcies By Age18-2930-3940-4950-5960-69Thousands1,00070 9008008007006006005004004003002002001000Source: New York Fed Consumer Credit Panel/Equifax0Note: 4 Quarter Moving Sum.Age is defined as the current year minus the birthyear of the borrower.Age groups are re-defined each year. Balances may not add up to totalsdue to a small number of individuals with unknown birthyears.30
CHARTS BY SELECT STATE31
Total Debt Balance per Capita* by StateThousands of DollarsThousands of Dollars100100National 040TXPA2020Note: *Based on the population with a credit reportSource: New York Fed Consumer Credit Panel/Equifax32
Composition of Debt Balance per Capita*by State (2020 Q3)Thousands of DollarsThousands of Dollars80MortgageHE RevolvingAuto LoanCredit CardStudent LoanOther6040200AZCAFLILMINJNVNYOHPATXUSNote: * Based on the population with a credit reportSource: New York Fed Consumer Credit Panel/Equifax33
Delinquency Status of Debt Balance per Capita*byState(2020Q3)Thousands of DollarsThousands of Dollars8080Current30-day late60-day late90-day late120-day lateSeve
1 This report is based on the New York Fed Consumer Credit Panel, which is constructed from a nationally representative random sample drawn from Equifax credit report data. For details on the data set and the measures reported here, see the data diction