Transcription
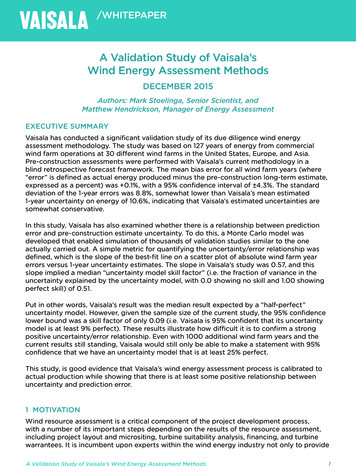
/WHITEPAPERA Validation Study of Vaisala’sWind Energy Assessment MethodsDECEMBER 2015Authors: Mark Stoelinga, Senior Scientist, andMatthew Hendrickson, Manager of Energy AssessmentEXECUTIVE SUMMARYVaisala has conducted a significant validation study of its due diligence wind energyassessment methodology. The study was based on 127 years of energy from commercialwind farm operations at 30 different wind farms in the United States, Europe, and Asia.Pre-construction assessments were performed with Vaisala’s current methodology in ablind retrospective forecast framework. The mean bias error for all wind farm years (where“error” is defined as actual energy produced minus the pre-construction long-term estimate,expressed as a percent) was 0.1%, with a 95% confidence interval of 4.3%. The standarddeviation of the 1-year errors was 8.8%, somewhat lower than Vaisala’s mean estimated1-year uncertainty on energy of 10.6%, indicating that Vaisala’s estimated uncertainties aresomewhat conservative.In this study, Vaisala has also examined whether there is a relationship between predictionerror and pre-construction estimate uncertainty. To do this, a Monte Carlo model wasdeveloped that enabled simulation of thousands of validation studies similar to the oneactually carried out. A simple metric for quantifying the uncertainty/error relationship wasdefined, which is the slope of the best-fit line on a scatter plot of absolute wind farm yearerrors versus 1-year uncertainty estimates. The slope in Vaisala’s study was 0.57, and thisslope implied a median “uncertainty model skill factor” (i.e. the fraction of variance in theuncertainty explained by the uncertainty model, with 0.0 showing no skill and 1.00 showingperfect skill) of 0.51.Put in other words, Vaisala’s result was the median result expected by a “half-perfect”uncertainty model. However, given the sample size of the current study, the 95% confidencelower bound was a skill factor of only 0.09 (i.e. Vaisala is 95% confident that its uncertaintymodel is at least 9% perfect). These results illustrate how difficult it is to confirm a strongpositive uncertainty/error relationship. Even with 1000 additional wind farm years and thecurrent results still standing, Vaisala would still only be able to make a statement with 95%confidence that we have an uncertainty model that is at least 25% perfect.This study, is good evidence that Vaisala’s wind energy assessment process is calibrated toactual production while showing that there is at least some positive relationship betweenuncertainty and prediction error.1 MOTIVATIONWind resource assessment is a critical component of the project development process,with a number of its important steps depending on the results of the resource assessment,including project layout and micrositing, turbine suitability analysis, financing, and turbinewarrantees. It is incumbent upon experts within the wind energy industry not only to provideA Validation Study of Vaisala’s Wind Energy Assessment Methods1
/WHITEPAPERthe most accurate resource assessments possible, but to demonstrate that accuracy withvalidation studies that compare pre-construction wind energy assessments to operationalwind farms. Answering the simple question, “What did the wind farm generate compared towhat was predicted?” is very important.Furthermore, as the industry has matured, experts have increasingly been relied upon toestimate not only the expected mean energy production of a wind farm, but to accuratelyestimate the uncertainty surrounding that mean estimate. This shift has come as the industryhas matured and investors are gaining confidence that the mean estimate is calibrated toactual generation. There is general industry acceptance that taking steps to reduce theuncertainty of a project’s energy estimate, such as installing more meteorological mastsat higher heights or using more sophisticated modeling techniques for long-term energyestimation at turbine locations, is advantageous. However, we are not aware of any studiesthat have shown, either empirically or theoretically, that reduced uncertainty estimatestranslates into lower error of estimation.Several important validation studies have emerged from the wind resource assessmentindustry in recent years [1-3], which have shown three key results, the first two of which areencouraging and the third of which is not:1. There has been a positive trend, from mean overestimation of production by as much as10% during the 2000’s, to mean correct estimation of energy production at the presenttime. In other words, the industry is now perceived to be calibrated with respect to P50,whereas it was not before.2. There has been a confirmation that, averaged over many wind farms, 1-year errors inpre-construction energy assessment are close to what is expected from the averageestimates (across all wind farms) of uncertainty, although possibly slightly conservative.3. There has been a weak, or in some cases lack, of apparent relationship between preconstruction estimates of 1-year uncertainty for individual wind farms and observed1-year errors of energy production. In other words, the industry is demonstrating a lackof ability to distinguish low uncertainty projects from high uncertainty projects.In response to the motivations described above, Vaisala has undertaken a major validationstudy of our wind energy assessment approach, including both the P50 energy estimatesand the associated 1-year uncertainty estimates. Additionally, Vaisala has taken the step ofanalyzing the statistical significance of our results, by developing a Monte Carlo simulatorthat produces thousands of instances of the same validation study configuration, usingthe known statistical behavior of wind farms in the actual study. The Monte Carlo simulatorprovides an important determination of the confidence interval on the mean of our validationhistogram, on the standard deviation of that histogram, and on the relationship between ourpre-construction uncertainties and yearly errors of our long-term estimates. It also providesa view into how many wind farm years (WFYs) would be needed in the validation study toreduce these confidence intervals to any desired level.The study described herein provides several benefits, both internal and external to Vaisala. Internally, this study validates and informs the science that underpins Vaisala’smethodology, and provides a test bed for ongoing improvements to our methodology.Vaisala is continually innovating all components of its renewable energy assessmenttechniques, and it is important to track the effect of these improvements on aA Validation Study of Vaisala’s Wind Energy Assessment Methods2
/WHITEPAPERdiverse portfolio of projects, to ensure the stability and reliability of our system. Theinfrastructure Vaisala has built to conduct this study has been retained and streamlinedfor continual testing in the future. Externally, this validation study provides the industry with confirmatory support for theaccuracy of Vaisala’s methodology. This validation study also adds to the body of knowledge in the wind energy assessmentindustry as a whole, providing a new “data point” on the degree of calibration of windresource assessment techniques within the industry, as well as new information on theconfidence of validation study results.2 VAISALA’S WIND RESOURCE ASSESSMENT METHODOLOGYVaisala’s approach to wind resource assessment follows many of the standard best practicesfamiliar to the industry, but is also founded on some key innovative technologies: Numerical Weather Prediction (NWP, also known as mesoscale modeling), for bothspatial modeling and multi-decadal weather and climate simulation. Recent studiesindependent of Vaisala [4,5] have demonstrated the reduced error of NWP-basedmethods for wind resource assessment. Treatment of wind modeling, power modeling, wake modeling, and other losses in amulti-decadal hourly time series domain rather than a frequency domain; and Full propagation of uncertainties throughout the entire modeling process, including errordependencies.These newer techniques advance the scientific foundation of wind resource assessment, butat the same time, require diligence in validation to ensure the industry that our wind resourceassessment techniques are indeed providing accuracy, reliability, and value to the process.3 DATASET DETAILSThis validation study was enabled through partnerships developed between Vaisala and anumber of wind farm owner/operators, who provided pre- and post-construction data from adiverse set of wind farms specifically for the purposes of this study. The dataset gathered forthis study is summarized below, and in Figs. 1-2: The dataset included 30 wind farms, approximately located as shown in Fig. 1. A diverseset of geographies and climates are represented, primarily over the United States, butalso including a few wind farms in Europe and one in Southeast Asia. Nine of the sitesare in complex terrain, six are in rolling terrain, and 15 are in flat terrain. Installed capacity ranges from 20 to 300 MW (Fig. 2a), with an average of 126 MW. Hub heights are mostly 80 m, but with a few higher and lower hub heights as well (Fig2b). Nine different turbine manufacturers were represented. The commercial operation dates (CODs) of the wind farms ranged from 2007 to 2014,but a majority of the wind farms began commercial operations in 2010 or 2011 (Fig. 2c).This time period was by intent, as we sought wind farms that were new enough to havebenefitted from a relatively state-of-the-art pre-construction meteorological campaign,A Validation Study of Vaisala’s Wind Energy Assessment Methods3
/WHITEPAPERbut in existence long enough to provide several years of energy validation data. Thisdistribution of CODs yielded a total of 127 WFYs of commercial energy production,which were distributed among the wind farms as shown in Fig. 2d, for an average of 4.23WFYs per wind farm.Our wind farm partners provided the following data for the study: Pre-construction data, including met mast locations, raw measurement data,commissioning and calibration documents, turbine layout, turbine specifications (powercurve, thrust curve, etc.), and information on nearby turbines. Post-construction data, including monthly totals of metered energy, as well as monthlyestimates of percent system availability and of externally curtailed energy.1511732110500100200300Rated Capacity (MW)C10502006 2008 2010 2012 2014 2016Commercial Operation DateNumber of Wind Farms15A30Number of Wind FarmsNumber of Wind Farms15Number of Wind FarmsFigure 1. Map showing approximate regional distribution of wind farms included in the study. The number inside each markerspecifies the number of wind farms in the region indicated.15B201006080100120140Hub Height (m)160D105002468Number of WFYs AvailableFigure 2. Histograms of the characteristics of wind farms included in the study: (a) by rated capacity (MW); (b) by turbine hub height(m); (c) by commercial operation date; and (d) by number of WFYs of energy production data available to the study.A Validation Study of Vaisala’s Wind Energy Assessment Methods4
/WHITEPAPER4 PROCEDUREThe study was conducted as a blind retrospective forecast. We generated all “pre-constructionestimates” as part of the study, using Vaisala’s current methods, but with a view only intothe data available prior to wind farm commissioning. While this approach does not addressthe question of how a methodology has improved or regressed over time, it does give thecommunity a clearer picture into how Vaisala’s current methodology will perform in presentapplications, because all 30 wind energy assessments in the study were performed in the exactsame way. It also allowed Vaisala to build the study quickly by obtaining data and performing theassessments and analysis all at once, rather than waiting for the dataset to populate organicallyfrom commissioned wind energy assessments over time.The only exception to the blind restriction is that we generated a different pre-constructionestimate for each known configuration of external turbines that has occurred since commercialoperation of a wind farm began, and then to validate each WFY, we used the estimateappropriate to that time period. The reason for this approach is that we are not attemptingto validate our ability to predict future wind energy build-out surrounding a wind farm, so wechose to remove the uncertainty of unknown new external wakes from the validation. Vaisala’sassessment reports will typically call out the likelihood of new wind development in the vicinityto the extent it can be predicted, but it is not included quantitatively in the energy assessment,unless the impending build-out is clear and imminent.With the data in hand, Vaisala produced a wind energy assessment for each wind farm. Weperformed our standard due diligence wind energy assessment process, including quality controlof all data provided, long-term modeling, spatial modeling, wake modeling, loss calculations,and uncertainty modeling. The key final numbers for each wind farm assessment are thelong-term mean net annual energy production (the P50 AEP estimate) in gigawatt-hours; andthe uncertainty in percent for any one year of production. The 1-year uncertainty arises bothfrom uncertainties in the energy estimation technique, and from interannual variability in windresource and losses. Within this current work, it should be noted that we use the term error todescribe differences between observed generation and the P50 AEP estimate. While we dothis for convenience, the annual differences that arise from natural climate variability, as well asfrom losses such as system availability that are known to fluctuate annually, are expected andare not truly “errors” of estimation; whereas the bias that materializes over time after variabilityis averaged out, can be considered errors in the assessment methodology, the pre-constructionmeasurements, or possibly observed generation.With regard to the production data, at each wind farm, we gathered the monthly data intogroups of 12 consecutive months (not necessarily January through December), and aggregatedthe monthly production data into these “wind farm year” (WFY) values. Our due diligenceassessment reports can include qualitative guidance on future external curtailments, but theydo not often quantitatively include external curtailments or its variability in the future energyestimate, except where regionally consistent instability exists. Therefore, to provide a consistentvalidation dataset, we added the wind farm-reported estimates of external curtailment back intothe metered production numbers, to create a compatible comparison with the pre-constructionassessment estimates, assuming no curtailment. This step does add additional noise to thevalidation data that is dependent on the quality of the external curtailment estimates. However,our wind farm partners are all keenly interested in accurate curtailment estimates, and arepresumed to have developed reliable estimation techniques for their own purposes, so thisapproach is not seen as significantly detrimental to the study.A Validation Study of Vaisala’s Wind Energy Assessment Methods5
/WHITEPAPER5 RESULTS5.1 Wind Energy Error HistogramFirst, we present what has become a standard depiction of wind energy assessmentvalidation studies in the industry, which is the error histogram (Fig. 3). This histogram ispopulated by calculating the difference of each WFY energy value from the pre-constructionP50 estimate for that wind farm and expressing it as a percent of the P50. These valuesare referred to as the 1-year errors. Each histogram bin covers 2% in width, and the counts(y-axis) add up to the full set of 127 WFYs. The statistical properties of the mean andstandard deviation of the 1-year energy errors are also calculated, and are annotated in thefigure. The mean of all the 1-year errors, referred to hereafter as the mean bias error, is veryclose to 0%, meaning that on average, the assessment method provides a well calibratedP50 estimate of energy. A unique aspect of this study is that we have used Monte Carlosimulations (described in section 6) to calculate the 95% confidence interval on this mean,shown at the top of the figure. While this particular validation study showed near-perfectcalibration, we can only say with 95% confidence that the mean error is within 4.3% of zero.Number of Wind Farm Years20PredictedActual95% Confidence Intervalfor Mean 4.3%Mean 0.1%1595% Confidence Intervalfor Std. Deviation 1.9%10Std. Deviation 8.8%Std. Deviation 10.6%50-30-20-1001020WFY Energy Error (Actual Minus Predicted, %)30Figure 3. Histogram of WFY energy errors (1-year actual minus long-term predicted, %). Vertical lines show means ofactual (blue, x 0.1%) and predicted (orange, x 0.0%) distributions. Bell curves depict actual and expected normaldistributions, centered on actual and predicted means, and using standard deviations from actual data (blue) and from meanpredicted uncertainty (orange), respectively. The 95% confidence intervals on the mean and standard deviation of the actualdistribution, which are 4.3% and 1.9%, respectively, are indicated by the labeled intervals.The histogram shape follows that of a normal distribution, though not perfectly so.Deviations from a perfect normal distribution are expected, due to both the limited samplesize, and to other effects such as nonlinearity of the power curve and upper limits of certainlosses like availability. However, the distribution passes simple tests of normality and isassumed to be so for the purpose of this study. Two normal distributions are depictedas bell curves in the figure. The orange curve represents what one would expect for thehistogram shape from Vaisala’s predictions, assuming perfect calibration of the mean biaserror (i.e. centered on zero) and a standard deviation equal to the mean 1-year uncertaintyA Validation Study of Vaisala’s Wind Energy Assessment Methods6
/WHITEPAPERon energy for all 30 wind farms (10.6%). The blue curve represents what was obtained fromactual data, centered on the mean 1-year bias error ( 0.1%) and with a standard deviationof the actual 1-year errors (8.8%). It can be seen that the two curves are similar, though theactual distribution (8.8%) is narrower than the expected uncertainty (10.6%), meaning thaton average, Vaisala’s predictions are slightly more accurate than the uncertainty predictionsgive credit for, at least for this sample of wind farms. The Monte Carlo simulations (section6) yield a 95% confidence interval on the standard deviation of 1-year errors of 1.9%, sothe difference between the standard deviation obtained in this study and the averageuncertainty estimate of 1.8% (10.6% minus 8.8%) is not quite large enough to be significantlydifferent at the 95% confidence level. Therefore, while this result motivates continued testingof Vaisala’s uncertainty model, additional data should be collected before an across-theboard reduction in uncertainty to bring the mean uncertainty into “calibration” is effected.5.2 Adjustment for Annually Varying Windiness and System AvailabilityAs mentioned above, the 1-year uncertainty of the pre-construction energy estimatesincludes both the uncertainty in the long-term energy estimate for a particular wind farm,as well as the predicted interannual fluctuations in windiness, system availability, and otherlosses. The most straightforward analysis of the data is to simply calculate 1-year errorsand show the results, with an understanding that both of these sources of uncertainty areincluded. However, it is also of interest to factor out annually varying contributions to theerror, to the extent possible, to get a clearer view into the error of the long-term estimateitself, and we have done so in this study.For the system availability adjustment, we used wind farm-reported monthly systemavailability percentages, and adjusted our WFY energy predictions accordingly. Forwindiness, Vaisala’s time series approach to wind energy assessment is well suited to providethe necessary information, because we were able to simply extend our NWP-based energyassessment time series past the COD up to the present time, and use that time series toprovide a wind-adjusted energy estimate for each operational WFY. We also recalculated ouruncertainty estimates excluding interannual variability of windiness, system availability, andboth effects simultaneously.The results of this analysis are shown in Table 1. Each effect accounted for separately movesthe mean bias error downward (toward underperformance) by about 1%, and the combinedeffect by about 2%. This suggests that the particular WFYs used in the study may have beenslightly windier than the long-term mean, and system availability may have been slightlyhigher than assumed in our reports on average. However, it should be noted that boththe estimate of windiness of a period and the estimate of availability, as presented by thesponsors, come with their own uncertainty. In any event, the decreases in mean bias error forthese effects, either separately or combined, fall well within the 95% confidence interval onthe mean bias error of 4.3%.Figure 4 shows a scatter plot of the root mean-squared 1-year error versus the adjusted mean1-year uncertainty for each of the experiments. Although the points lie slightly below the one-toone line due to the previously noted lower than estimated standard deviation of 1-year errors, thepoints line up nearly parallel to the one-to-one line, meaning that error spread and uncertaintydecrease roughly proportionally to each other as availability and/or windiness are removedfrom the analysis. This result indicates that the uncertainty model properly captures the annuallyvarying portion of the overall 1-year uncertainty.A Validation Study of Vaisala’s Wind Energy Assessment Methods7
/WHITEPAPERExperimentMean Bias Error(Actual Minus Predicted)No Adjustment 0.1%Adjustment for SystemAvailability-1.2%Adjustment for Windiness-0.9%Adjustment for BothAvailability and Windiness-2.2%Table 1. Mean bias error of energy estimates (actual minus predicted), for four different experimentsRMS of All 1-Year Energy Errors (%)12No AdjustmentAvailability AdjustmentWindiness AdjustmentBoth Adjustments111098765445678910Mean Predicted 1-Year Uncertainty (%)1112Figure 4. Plot of root mean-squared WFY energy errors from actual data (y-axis) versus mean predicted1-year uncertainty (x-axis), for the four experiments shown in the legend in the upper left corner.A Validation Study of Vaisala’s Wind Energy Assessment Methods8
/WHITEPAPER5.3 Relationship of Pre-Construction Uncertainty Estimates to 1-Year ErrorsRecently, there has been concern within the industry about the apparent lack of a relationshipbetween errors in generation at operating wind farms and the pre-construction uncertaintyestimates. Since estimates of uncertainty are the primary way by which risk is quantified by theinvestment committee for a planned project, this lack of an uncertainty/error relationship callsinto question the industry’s skill at characterizing risk. In response to this concern, several newor updated presentations and reports on wind energy validation studies have also examinedthis relationship to test whether uncertainty estimates exhibit a relationship to observed error,and the results have been mixed.The typical way by which this relationship is assessed is to construct a scatter plot of 1-yearerrors in production on the y-axis, against the pre-construction 1-year energy uncertainty onthe x-axis. This has been done for the present study (Fig. 5). If the correct relationship exists,then the 1-year errors should spread out more in the vertical direction on the plot the fartherto the right one looks. One way the correctness of the spread can be assessed is to shadean envelope bounded by the lines for which production error is equal to plus or minus theuncertainty, and at any point along the x-axis, approximately 68% of the data points shouldlie within that envelope. There are several difficulties with this approach. First, for typicalvalidation studies, the sample size is small enough such that it is difficult to visually determinethe relative density of points inside and outside the envelope as one moves laterally along thex-axis. Second, there are usually more WFYs with mid-range values of uncertainty than withvery small or very large values, so visually comparing the behavior of low, medium, and highuncertainty projects is difficult. One can compare errors to uncertainty within several bins ofuncertainty, but this yields multiple numbers rather than a single metric, and the expectedstatistical behavior of the result is not readily apparent.One approach that has been used for similar purposes in the realm of probabilistic weatherforecasting is to depict a similar scatter plot, except showing absolute error (always positive,rather than positive or negative), as is shown here in Fig. 6; and then fitting a line to thedata. This plot will subsequently be referred to as an uncertainty validation plot. Althoughthe scatter plot has a very low correlation (r 0.22), the increased spread of the errors withincreased uncertainty should yield a positive slope to the fitted line. In fact, it can be showneither through derivation or with a large Monte Carlo simulation (as will be seen later) that theslope of this fitted line is expected to be 2 π, or 0.80, for a “perfect uncertainty model” in avery large validation study.In contrast, for an uncertainty model with zero skill, the spread of the errors will not changeas one goes from low to high uncertainty, and the expected slope of the fitted line will bezero. Thus, the slope of the fitted line is a useful metric for establishing the strength of theuncertainty/error relationship, because it is a single metric, and has known values for botha “perfect uncertainty model” and a “zero skill uncertainty model.” In the present study, thefitted line in the validation plot yielded a slope of 0.57, which is positive, but less than perfect.A key question is this: Even if we knew hypothetically that we had a perfect uncertainty model,what might we expect the possible values of this slope to be in any single validation study of alimited sample size, such as the present one with 127 WFYs? To address this question, we turnto Monte Carlo simulations of validations studies.A Validation Study of Vaisala’s Wind Energy Assessment Methods9
/WHITEPAPER35302520WFY Energy Errors (%)Figure 5. Scatter plot of WFYenergy errors (y-axis) versuspredicted 1-year uncertaintyof energy estimates (x-axis).Light-blue shaded region isbounded by the lines alongwhich energy errors equaluncertainty, or in other words,the one-standard-deviationbounds of the expecteddistribution of energy errors.68% of the data points areexpected to lie within theshaded region.151050-5-10-15-20-25-30-35681012Predicted 1-Year Uncertainty (%)1416141635WFY Absoulte Eergy Errors (%)Figure 6. Scatter plot ofWFY absolute energy errors(y-axis) versus predicted1-year uncertainty (x-axis).Dark blue line is the bestfit line to the data points,with slope and correlationindicated in inset.43025Best-fit line: slope 0.57 r 0.22201510504681012Predicted 1-Year Uncertainty (%)A Validation Study of Vaisala’s Wind Energy Assessment Methods10
/WHITEPAPER6 MONTE CARLO SIMULATIONS6.1 Motivation and Model DescriptionValidation studies such as Vaisala’s have been produced with varying sizes of datasets. Thisfact begs the question, how do the results depend on the size of the dataset? We havepresented three key results in the foregoing section, namely, that our mean bias error isclose to zero, that the standard deviation of our 1-year errors is close to the mean estimateduncertainty, and that we show a positive relationship between our uncertainty estimates andthe 1-year errors at individual wind farms. But considering the sample size, how robust arethese results? What is the likelihood that we obtained a “lucky draw,” or “unlucky draw”?To address this question, we examine statistical significance and confidence intervals onour results using a Monte Carlo simulator that can quickly generate thousands of wind farmenergy predictions and errors that match the known statistical behavior of the wind farmsin our actual study. Here we describe the model assumptions and present results of thesimulations.The following parameters are set for the model. The values that pertain to simulatingVaisala’s actual validation study are shown in parentheses, although these can be varied tosimulate the assumed size or behavior of any validation study.1. Number of wind farms (30) and WFYs (127).2. Mean and standard deviation of WFYs per wind farm (4.23 2.0)3. True mean bias error in the validation study (assumed 0.0%)4. True average uncertainty of WFY energy errors (9.68%)5. Standard deviation of true uncertainty for WFYs (1.82%)6. Uncertainty model skill factor (varying levels tested, from 0.00 to 1.00)7. Fraction of contribution to total uncertainty contributed by “fixed” as opposed to“annually varying” errors for a wind farm (0.33)8. Assumed maximum correlation of errors among nearby wind farms (0.48)9. Inter-farm distance of drop-off to half-amplitude correlation (1000 km).The meaning and function of these parameters become clear as the procedure is describedfor one iteration of the Monte Carlo model. We first randomly select from a normaldistribution the number of production years for each wind farm, using the specified averageand standard deviation of number of WFYs per wind farm. The numbers are tweaked toalways force the desired number of wind farms and WFYs. For each wind farm, we thenrandomly assign an uncertainty for the 1-year prediction, using the assumed true mean(0.0%) and true stan
expressed as a percent) was 0.1%, with a 95% confidence interval of 4.3%. The standard deviation of the 1-year errors was 8.8%, somewhat lower than Vaisala's mean estimated 1-year uncertainty on energy of 10.6%, indicating that Vaisala's estimated uncertainties are somewhat conservative.


![Humidity101 HumidityTheory.pptx [Read-Only] - Vaisala](/img/46/humidity101-humiditytheorytermsdefinitions.jpg)