Transcription
Washburn UniversityEnrollment ReportFall 2020Strategic Analysis & ReportingOctober 11, 2020
1The Fall 2020 Enrollment Report provides information about headcount and student credit hourenrollment for Washburn University (Washburn) and Washburn University Institute of Technology(Washburn Tech), based on each campus’s 20th day census snapshot. Appendix A (pp. 19) provides fallheadcount enrollment for the six public four-year Kansas institutions, the community colleges, andtechnical schools.Tables 1, 5, 6, 9, 11, and 12, as well as Appendix A, and Graphs 1 and 2 (pp. 7-8, 12-14, 17, 19-20, 28)either provide headcount and credit hour comparisons between Fall 2018 and Fall 2019 or describe thecharacteristics of Fall 2019 students. Tables 2, 3, 4, 7, 8, and 10 (pp. 9-11, 15-16, 19) provide longitudinaltrends documenting headcount and credit hour changes.Supplementary Tables 1, 2, 5-7 (pp. 21-22, 25-27) provide snapshot data between 2010 and 2020, whileTables 3 and 4 (pp. 23-24) provide data between 2010 and 2020, documenting headcount and credit hourchanges for each of the types of students – defined in the main body below -- who enroll at Washburnand their demographic and academic characteristics as of the 20th day snapshot. Supplementary Table 8(pp. 29) documents how the number of credit hours at each college or school – in lower and upper divisioncourses as well as graduate courses – have changed between 2010 and 2020.Executive Summary Overall Washburn headcount enrollment decreased 405 students to 5,880 in Fall 2020 from theFall 2018 semester’s 6,285, or 6.4%. Credit hours decreased 4,734, or 6.9%, going from 68,659 inFall 2019 to 63,926 in Fall 2020. FTE decreased from 4,710 to 4,394, or 6.7%. See Table 1. When excluding high school students, overall headcount enrollment decreased 420 students fromFall 2019, or 7.8%. Credit hours decreased 4,834, a 7.4% drop. See Figures 1 and 2. Overall degree-seeking undergraduate headcount enrollment decreased in Fall 2020 to 4,205from the Fall 2019 semester enrollment of 4,567, a 7.9% decrease. Credit hours decreased 4,722,a 7.8% decline. See Table 1 and Supplementary Table 8.oFirst-time freshmen headcount decreased to 660 students from the Fall 2019 semester’s788 headcount, a 16.2% decrease. Credit hours decreased 16.1% for first-time freshmen.Direct from high school first-time freshmen headcount decreased to 609 students fromthe Fall 2019 headcount of 732, a 16.8% decrease. Credit hours decreased 16.6%. See“Direct from High School” in Supplementary Table 1.oOther first-time freshmen headcount decreased by 5 students, an 8.9% decrease, andcredit hours decreased by 8.7%. See “Other first-time freshmen” in Supplementary Table1 and also Table 1.oTransfer student headcount decreased 10.0%, falling from 516 students in Fall 2019 to464 students in Fall 2020. Credit hours decreased 10.5%. See Supplementary Table 2.oReturning undergraduate student headcount decreased by 45 students from Fall 2019 toFall 2020, a decrease of 21.1%. See Supplementary Table 3.Fall 2020 Enrollment ReportStrategic Analysis & ReportingWashburn University
2o The Fall 2020 continuing undergraduate headcount population decreased 140 studentsfrom Fall 2019, a decline of 4.6%. Credit hours decreased 5.0%. See Supplementary Table4.Overall, non-law degree-seeking graduate student headcount enrollment decreased 3.1%,declining from 510 students to 494. Credit hours decreased 3.4%. See Supplementary Table 5.oThe incoming graduate student count increased by 11 students and increased by 54.5credit hours, year over year.oThe continuing and transferring graduate student population decreased 8.0%, or 27students, and credit hours decreased 7.9%.Overall, law student headcount enrollment increased by 14 students from Fall 2019 to Fall 2020.Law students enrolled in 121 more credit hours in Fall 2020 as compared to Fall 2019. SeeSupplementary Table 5.oThe first-time law student population increased by 6 students and 103 Fall SCH.oThe continuing and transferring law student population increased by 8 students, and theFall 2020 students generated 18 more credit hours than in Fall 2019, a 0.5% increase.The non-degree-seeking student population and the credit hours they generated decreased in Fall2020 compared to Fall 2019. See Supplementary Table 7.oThe high school population increased by 15 students between Fall 2019 and Fall 2020, a1.8% increase in enrollment. High school credit hours decreased 1.5% between Fall 2019and Fall 2020.oThe non-degree-seeking undergraduate student population decreased 68.7% betweenFall 2019 and Fall 2020, falling from 83 students to 26. These students generated 73.0%fewer credit hours in Fall 2020 compared to Fall 2019, a decline of 413 credit hours.oThe non-degree-seeking graduate student population increased by 6 students, from 5students in Fall 2019 to 11 in Fall 2020. These students generated 18 more hours in Fall2020, increasing from 27 credit hours in Fall 2019 to 45 in Fall 2020. The 65 and over auditor population was discontinued during Fall 2020. See Table 1 for Fall 2019information. Washburn Tech’s total headcount enrollment decreased 362 students between Fall 2019 and Fall2020, a 24.6% decrease. Washburn Tech’s credit hour production decreased 4,502 credit hours,a 24.4% decrease. See Tables 11 and 12. Headcount enrollment at the six four-year public universities combined decreased 3.6% betweenFall 2019 and Fall 2020, whereas community colleges declined 14.1%, and technical collegesdecreased 9.4%. See Appendix A.Fall 2020 Enrollment ReportStrategic Analysis & ReportingWashburn University
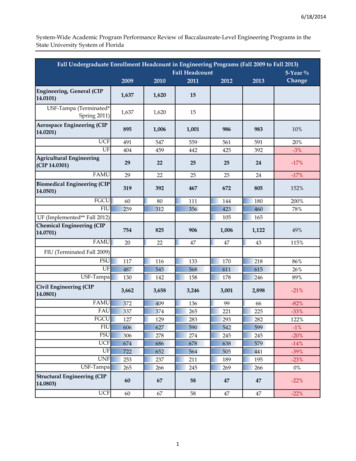
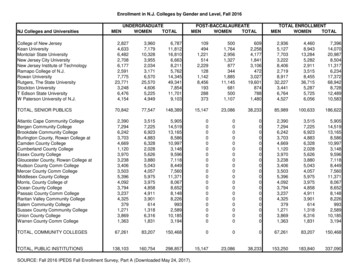
3Ten Year TrendsThis section provides ten-year trends (2011-2020) for headcount populations and credit hour generation.Washburn University’s Overall Headcount and Credit HoursFigures 1 and 2 document changes in Washburn’s enrollment for the past ten years (2011-2020) for totalheadcount and credit hour enrollment when including and excluding high school students.Figure 1: Fall Enrollment Headcount, 015Total Headcount20162017201820192020Total Headcount Excluding HS StudentsFigure 2: Fall Enrollment Credit Hours, 1201220132014Total SCHFall 2020 Enrollment ReportStrategic Analysis & ReportingWashburn University201520162017Total SCH Excluding HS SCH2018201963,92660,0782020
4Undergraduate LevelWashburn’s undergraduate level is composed of first-time freshmen, incoming transfer students,returning undergraduates (i.e., students who were enrolled, stopped out for a semester – excludingsummer -- or more, and re-enrolled), and continuing undergraduates. All first-time freshmen, newtransfer students, and returning students immediately become continuing undergraduates uponsuccessful registration in the next semester. This section provides ten years of headcount trendinformation. For more information about each population’s demographic and academic characteristics,please refer to Supplementary Tables 1-4 (pp. 21-24).First-time FreshmenFirst-time freshmen are composed of students who matriculate to Washburn directly out of high schooland students who take a year or more off of their formal education between high school graduation andtheir postsecondary matriculation to Washburn (other first-time freshmen).Supplementary Table 1 shows how these groups have changed since 2010. First-time freshmen whomatriculate directly out of high school have decreased 10.1% since 2010.The other type of first-time freshmen – who averaged 22.76 years of age in Fall 2020 – has declined 78.1%since 2010. See Supplementary Table 1 for the demographic and academic characteristics of thesestudents.Undergraduate Transfer StudentsThere have been dramatic year-over-year variations in the number of transfer students coming toWashburn. Overall, since 2010, the incoming transfer student population has decreased 28.2%, or 182students. Supplementary Table 2 shows how undergraduate transfer students have changed since 2010.Returning StudentsSupplementary Table 3 shows how returning undergraduate students have changed since 2010.Overall, these students have declined 57.0% since 2010.Continuing Undergraduate StudentsThe size of any current continuing undergraduate student population is dependent on two factors: (1) thesize of the previous semesters’ incoming classes (i.e., first-time freshmen and transfers) as well as the sizeof the returning and continuing student populations and (2) those classes’ return rates. SupplementaryTable 4 shows how the continuing undergraduate population has changed since 2010.Overall, the size of the continuing student population has declined 21.6%, or 802 students, since Fall 2010.Graduate LevelGraduate students are composed of first-time graduate students and continuing (or new transfer)graduate students. Supplementary Table 5 shows how these populations have changed since 2010.The number of first-time graduate students has increased since 2010. Since then, the first-time graduatestudent population has increased by 101 students, and credit hour production has increased by 860 credithours.Fall 2020 Enrollment ReportStrategic Analysis & ReportingWashburn University
5The continuing and transferring-in graduate headcount has decreased by 43 students since Fall 2010, an12.1% decrease.Law SchoolWashburn Law School is composed of first-time law students, new transfer law students, and continuinglaw students. Supplementary Table 6 shows how these populations have changed since 2010.First-time law students have declined 35.3% since Fall 2010; however, the headcount has been between84 and 90 each fall semester since 2016.Continuing and transferring law students have decreased 28.5% since 2010; however, these numbers havevaried only slightly (i.e., between 216 and 223) since Fall 2016.Non-Degree-Seeking StudentsNon-degree-seeking students include high school students enrolled for Washburn credit as well asundergraduate and graduate students who are enrolled in credit hours but who are not pursuing a degree.Supplementary Table 7 shows how these populations have changed since 2010.High school students have grown dramatically since 2010 when 488 high school students were enrolled.In Fall 2020, Washburn enrolled over one and a half times that number: 833 students. Since high schoolstudents began enrolling in higher numbers in Fall 2010, Washburn’s high school population has grown70.7%, from 488 students to 833 as of Fall 2020.The graduate non-degree headcount has declined slightly in the last ten years. In Fall 2010, 15 studentswere enrolled, and in Fall 2020, 1 students were enrolled. The peak was 24 students in Fall 2012.Credit Hours by College/SchoolSupplementary Table 8 tracks credit hours generated by each college/school at Washburn since 2010.Overall, Washburn’s credit hours have decreased 10.1% since 2015. When excluding credit hoursproduced by high school students, Washburn’s credit hours have decreased 15.4%.Since Fall 2010, the following colleges/schools have increased credit hours production: School of Nursing (25.8%)VPAA/Other (51.8%)The following colleges/schools have decreased credit hours production: College of Arts & Sciences (-25.8%)School of Applied Studies (-13.0%)School of Business (-17.2%)School of Law (-34.7%)Credit hour production decreased at the following course levels: Lower Division courses (-18.9%)o When excluding high school students, there is negative growth (-11.8%)Upper Division courses (-8.6%)Graduate and Law (-18.2%)Fall 2020 Enrollment ReportStrategic Analysis & ReportingWashburn University
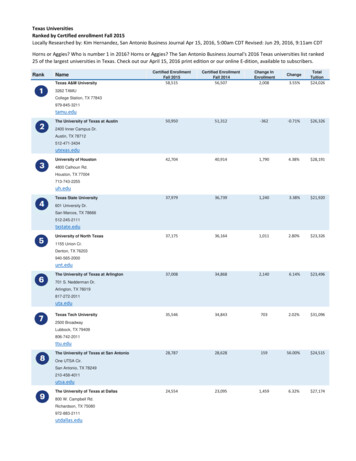
6Table 1Washburn UniversityEnrollment SummaryFall 2020Total HeadcountTotal Student Credit HoursChangePercentNFall 2020Fall l FTE4,3944,710-316-6.7%Headcount by Student ClassificationFirst-time freshmen direct high schoolFirst-time freshmen otherSubtotal first-time freshmenOther freshmenSubtotal all freshmenSophomoresJuniorsSeniorsPostbaccalaureate undergraduatesSubtotal undergraduatesMaster'sDoctorateSubtotal graduateLawSubtotal degree-seekingHigh schoolOther non-degree seekingSubtotal non-degree seekingTotal .8%-68.7%-4.7%-6.4%Headcount by GenderMaleFemaleTotal adcount by Resident/NonresidentKansas residentNonresidentTotal hnicity Demographics1WhiteNon-WhiteUnknown/UnreportedTotal 10.1%-8.9%7.4%-6.4%Headcount by Full-time/Part-timeFull-timePart-timeTotal 31-613-100.0%-100.0%65 & Over Tuition-free Audit ProgramHeadcountStudent Credit Hours00231613Average AgeUndergraduateGraduateLawNon-degree seeking23.235.026.717.123.235.026.417.8Average Credit HoursUndergraduateGraduateLawNon-degree seeking12.37.213.84.712.47.214.05.0[1] Student ethnicity/race is self-reported. In Fall 2020, 78% of Washburn students provided information on their ethnicity/race; 22% of studentswho have reported race/ethnicity data reported non-caucasian race/ethnicity.Source: Enrollment census file, September 11, 2020 and September 13, 2020.Fall 2020 Enrollment ReportStrategic Analysis & ReportingWashburn University
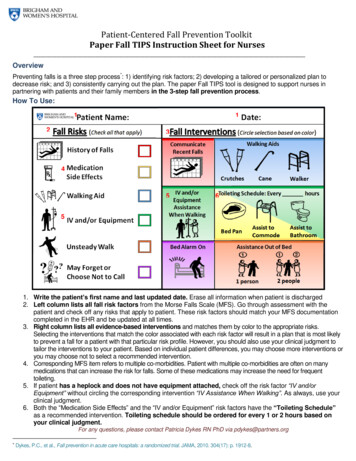
7Graph 1Washburn UniversityHeadcount EnrollmentFall 2020Graph 1.1Enrollment by Student ClassificationDirect from High SchoolLaw3165.4%Full-timeSource: Enrollment census files.Fall 2020 Enrollment ReportStrategic Analysis & ReportingWashburn UniversityPart-timeFall 2020Fall 2019Fall 2018TotalFall 2020Fall 2019Fall 2018Fall 2017Fall 2016Fall 2015Fall 2014Seniors1,37923.5%Juniors85814.6%Fall 2013Postbac Fall 2012Graduate5008.5%Other FTFGraph 1.3Enrollment by Full-time/Part-time StatusFall 2011Sophomores79813.6%Fall 2017Fall 2016Fall 2015Fall 2014Fall 2013First-timeFreshmen66011.2%Fall 2011High School83314.2%Other Freshmen3475.9%9008007006005004003002001000Fall 2012Other Nondegree260.4%Graph 1.2Enrollment of First-time Freshmen
8Table 2Headcount Enrollment and Student Credit HoursFall 2011 to Fall 192020Full-time PercentHeadcount .1%Part-time PercentHeadcount 5.2%Total PercentHeadcount .4%Student PercentCredit Hours 5%63,926-6.9%Note: Full-time status is based on enrollment of 12 or more hours for undergraduate and 9 or more for graduate and law.Source: Enrollment census files.Fall 2020 Enrollment ReportStrategic Analysis & ReportingWashburn University
9Table 3Headcount by Student Classification and Full-time/Part-time StatusFall 2016 to Fall 2020Full-timePart-timeTotalFall ateSubtotal undergraduateGraduateLawNon-degree seekingTotalPercent 2.8%74.8%8.4%4.5%12.3%100.0%Fall ateSubtotal undergraduateGraduateLawNon-degree seekingTotalPercent .6%23.5%2.8%71.5%8.5%5.4%14.6%100.0%Fall ateSubtotal undergraduateGraduateLawNon-degree seekingTotalPercent Full-time/Part-timeFall ateSubtotal undergraduateGraduateLawNon-degree seekingTotalPercent Full-time/Part-timeFall ateSubtotal undergraduateGraduateLawNon-degree seekingTotalPercent Full-time/Part-time[1] Full-time status is based on enrollment of 12 or more hours for undergraduate and 9 or more for graduate and law.Fall 2020 Enrollment ReportStrategic Analysis & ReportingWashburn University
10Table 4Undergraduate Enrollment by Student TypeFall 2016 to Fall 2020Fall 2016Student TypeFirst-time FreshmenTransfersSubtotal 2473,2014,967Percent ofTotal18.3%12.3%30.6%5.0%64.4%100.0%Fall 2017Percent 5.3%3,218100.0%4,926Fall 2018Percent 7.3%3,2104,767100.0%[1] Returning students are students who are re-enrolling at Washburn after stopping out for one or more terms.Source: Enrollment census files.Fall 2020 Enrollment ReportStrategic Analysis & ReportingWashburn UniversityFall 2019Percent 6.8%3,052100.0%4,571Fall 2020PercentHeadcount of Total660 15.7%464 11.0%1,124 26.7%4.0%1682,910 69.3%4,202 100.0%
11Table 5Student Credit Hours by College/School and DepartmentFall 2020College of Arts and SciencesArtBiologyChemistryCommunication StudiesComputer Information SciencesEducationEnglishHistoryInterdisciplinary StudiesKinesiologyLiberal StudiesMass MediaMathematicsModern LanguagesMusicPhilosophyPhysicsPolitical thropology TotalTheatreWomen's and Gender StudiesCollege of Arts and Sciences TotalSchool of BusinessAccountingBusinessEconomicsSchool of Business TotalSchool of NursingSchool of Applied StudiesAllied HealthClinical Laboratory ScienceTechnology AdministrationAllied Health TotalCriminal JusticeLegal StudiesMilitary and Strategic StudiesCriminal Justice & Legal Studies TotalHuman ServicesSocial WorkArmy ROTCSchool of Applied Studies TotalSchool of LawOther Programs[2]Washburn University TotalLowerDivisionUpperDivision2020Graduate &Law Total SCHPercentof Total2019Total 450742957
enrollment for Washburn University (Washburn) and Washburn University Institute of Technology (Washburn Tech), based on each campus’s 20th day census snapshot.Appendix A (pp. 9) provides1 fall headcount enrollment for the six public four-year Kansas ins