Transcription
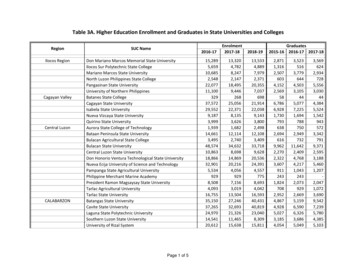
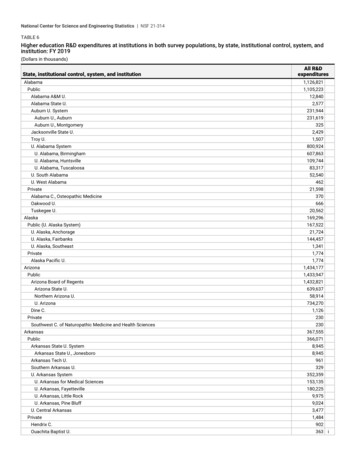
National Center for Science and Engineering Statistics NSF 21-314TABLE 6Higher education R&D expenditures at institutions in both survey populations, by state, institutional control, system, andinstitution: FY 2019(Dollars in thousands)State, institutional control, system, and institutionAll ama A&M U.12,840Alabama State U.2,577Auburn U. System231,944Auburn U., AuburnAuburn U., MontgomeryJacksonville State U.Troy U.U. Alabama System231,6193252,4291,507800,924U. Alabama, Birmingham607,863U. Alabama, Huntsville109,744U. Alabama, TuscaloosaU. South AlabamaU. West AlabamaPrivateAlabama C., Osteopathic Medicine83,31752,54046221,598370Oakwood U.666Tuskegee U.20,562AlaskaPublic (U. Alaska System)169,296167,522U. Alaska, Anchorage21,724U. Alaska, Fairbanks144,457U. Alaska, Southeast1,341PrivateAlaska Pacific U.1,7741,774Arizona1,434,177Public1,433,947Arizona Board of RegentsArizona State U.Northern Arizona U.U. ArizonaDine C.PrivateSouthwest C. of Naturopathic Medicine and Health kansas367,555Public366,071Arkansas State U. SystemArkansas State U., JonesboroArkansas Tech U.Southern Arkansas U.U. Arkansas System8,9458,945961329352,359U. Arkansas for Medical Sciences153,135U. Arkansas, Fayetteville180,225U. Arkansas, Little Rock9,975U. Arkansas, Pine Bluff9,024U. Central ArkansasPrivate3,4771,484Hendrix C.902Ouachita Baptist U.363 i
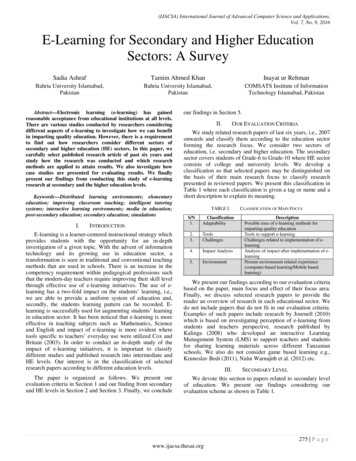
National Center for Science and Engineering Statistics NSF 21-314TABLE 6Higher education R&D expenditures at institutions in both survey populations, by state, institutional control, system, andinstitution: FY 2019(Dollars in thousands)State, institutional control, system, and institutionPhilander Smith C.All 752California State U. SystemCalifornia Polytechnic State U., San Luis Obispo374,99530,923California State Polytechnic U., Pomona6,099California State U., Bakersfield7,591California State U., Channel Islands1,572California State U., Chico3,232California State U., Dominguez Hills1,957California State U., East Bay8,640California State U., Fresno8,599California State U., Fullerton7,173California State U., Long Beach18,664California State U., Los Angeles12,476California State U., Maritime AcademyCalifornia State U., Monterey Bay2,9596,444California State U., Northridge21,095California State U., Sacramento23,544California State U., San Bernardino16,062California State U., San Marcos10,595California State U., Stanislaus1,477Humboldt State U.15,076San Diego State U.92,964San Francisco State U.31,888San Jose State U.44,309Sonoma State U.Naval Postgraduate SchoolU. California System1,65667,3236,988,400U. California, Berkeley802,931U. California, Davis804,282U. California, Irvine448,967U. California, Los AngelesU. California, MercedU. California, Office of the PresidentU. California, Riverside1,306,37644,89067,702177,655U. California, San Diego1,353,763U. California, San Francisco1,595,098U. California, Santa Barbara243,778U. California, Santa Cruz142,958U. California, Hastings C. of LawPrivateAzusa Pacific U.Biola U.California Institute of TechnologyCalifornia Lutheran U.1,034 i3,076,9355,5981,155 i399,9311,143Chapman U.19,592Charles R. Drew U. of Medicine and Science13,739Dominican U. California828 iFielding Graduate U.852
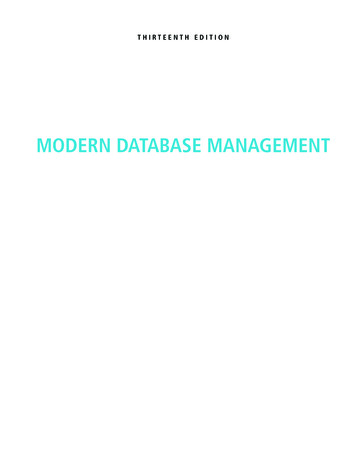
National Center for Science and Engineering Statistics NSF 21-314TABLE 6Higher education R&D expenditures at institutions in both survey populations, by state, institutional control, system, andinstitution: FY 2019(Dollars in thousands)State, institutional control, system, and institutionHigh Tech High Graduate School of Ed.International Technological U.La Sierra U.Life Chiropractic C.-WestLoma Linda U.All R&Dexpenditures2,223660 i1,58135024,408 iLoyola Marymount U.7,272Marshall B. Ketchum U.1,430 iMills C.1,643Occidental C.2,458Palo Alto U.Pepperdine U.Point Loma Nazarene U.Santa Clara U.Scripps Research InstituteSouthern California U. of Health SciencesStanford U.2902,1702652,319427,734150 i1,204,116The Claremont Colleges24,261Claremont Graduate U.8,715Claremont McKenna C.6,214Claremont School of Theology431Harvey Mudd C.3,353Keck Graduate Institute2,095 iPitzer C.Pomona C.4682,985Touro C. and U. SystemaTouro U.3,543U. of the Pacific3,078U. San Diego6,036U. San FranciscoU. Southern CaliforniaWestern U. of Health SciencesWestmont C.Whittier lic1,584,633Colorado Mesa U.372Colorado School of Mines70,397Colorado State U. System401,584Colorado State U., Fort CollinsColorado State U., PuebloFort Lewis C.Metropolitan State U. of DenverU. Colorado SystemU. Colorado BoulderU. Colorado Colorado SpringsU. Colorado Denver and Anschutz Medical CampusU. Northern ColoradoU.S. Air Force AcademyWestern State Colorado 542,7324,57143,94146039,490
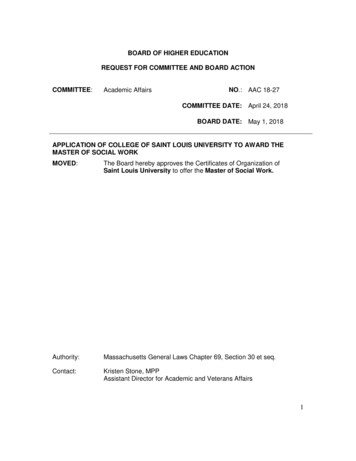
National Center for Science and Engineering Statistics NSF 21-314TABLE 6Higher education R&D expenditures at institutions in both survey populations, by state, institutional control, system, andinstitution: FY 2019(Dollars in thousands)State, institutional control, system, and institutionColorado C.Regis U.U. DenverConnecticutPublicConnecticut State U. SystemAll Central Connecticut State U.1,381Eastern Connecticut State U.1,659Southern Connecticut State U.4,627Western Connecticut State U.U. ConnecticutU.S. Coast Guard AcademyPrivate713285,7647081,096,073Connecticut C.1,894Fairfield U.1,279Quinnipiac U.Sacred Heart U.Trinity C., HartfordU. Bridgeport980 i5631,858642 iU. Hartford1,528U. New Haven5,062Wesleyan U.Yale re State U.23,017U. Delaware206,270District of Columbia664,872PublicNational Defense U.U. of the District of ColumbiaPrivate9,0314,2314,800655,841American U.71,053Catholic U. of America24,484Gallaudet U.5,382George Washington U.269,799Georgetown U.240,960Howard U.FloridaPublic (State U. Florida Board of Governors)44,1632,690,2002,270,424Florida A&M U.42,470Florida Atlantic U.51,085Florida Gulf Coast U.Florida International U.Florida Polytechnic U.Florida State U.New C. Florida5,907225,8642,006329,205962U. Central Florida225,085U. Florida928,639U. North Florida12,341
National Center for Science and Engineering Statistics NSF 21-314TABLE 6Higher education R&D expenditures at institutions in both survey populations, by state, institutional control, system, andinstitution: FY 2019(Dollars in thousands)State, institutional control, system, and institutionU. South Florida SystemU. South Florida, Saint PetersburgU. South Florida, Sarasota-ManateeU. South Florida, TampaU. West FloridaPrivateAll 776Barry U.295Bethune-Cookman U.735Eckerd C.435Embry-Riddle Aeronautical U.12,478Florida Institute of Technology17,876Jacksonville U.Keiser U.Nova Southeastern U.36545024,567Rollins C.626St. Thomas U., Miami Gardens268Stetson U.U. MiamiU. TampaGeorgiaPublic (U. System Georgia Board of Regents)Albany State U.Augusta U.Clayton State U.Fort Valley State U.Georgia C. and State U.Georgia Gwinnett C.Georgia Institute of TechnologyGeorgia Southern U.Georgia State U.Kennesaw State U.Middle Georgia State U.Savannah State U.U. ,536U. North Georgia2,068U. West Georgia508Valdosta State U.PrivateAgnes Scott C.Berry C.Clark Atlanta U.Emory U.Life U.Mercer U.Morehouse C.Morehouse School of MedicineSpelman C.HawaiiPublic (U. Hawaii System)U. Hawaii, 892,751302,252300,2726,864
National Center for Science and Engineering Statistics NSF 21-314TABLE 6Higher education R&D expenditures at institutions in both survey populations, by state, institutional control, system, andinstitution: FY 2019(Dollars in thousands)State, institutional control, system, and institutionU. Hawaii, ManoaU. Hawaii, Maui C.U. Hawaii, system officePrivateHawaii Pacific U.IdahoPublicAll 8,502Boise State U.39,824Idaho State U.14,972Lewis-Clark State C.U. IdahoPrivateNorthwest Nazarene Chicago State U.898Eastern Illinois U.700Governors State U.Illinois State U.Northeastern Illinois U.73527,0822,478Northern Illinois U.26,570Southern Illinois U. System59,817Southern Illinois U., CarbondaleSouthern Illinois U., EdwardsvilleU. Illinois SystemU. Illinois, ChicagoU. Illinois, SpringfieldU. Illinois, Urbana-ChampaignWestern Illinois ,3731,529,931Augustana C., Rock Island237Benedictine U.175Bradley U.1,357DePaul U.6,144Elmhurst C.Erikson InstituteIllinois C. of OptometryIllinois Institute of TechnologyLake Forest C.2242,27932634,334452 iLoyola U., Chicago39,223Midwestern U.10,343North Central C.350Northwestern U.857,069Rosalind Franklin U. of Medicine and Science16,126Rush U.96,267Toyota Technological Institute, ChicagoU. ChicagoWheaton C., 4,023
National Center for Science and Engineering Statistics NSF 21-314TABLE 6Higher education R&D expenditures at institutions in both survey populations, by state, institutional control, system, andinstitution: FY 2019(Dollars in thousands)State, institutional control, system, and institutionBall State U.Indiana State U.Indiana U.Indiana U., BloomingtonAll R&Dexpenditures12,1451,682738,219668,157Indiana U., Kokomo393Indiana U., Northwest509Indiana U., South Bend968Indiana U., SoutheastIndiana U.-Purdue U., IndianapolisPurdue U.Purdue U., Fort WaynePurdue U., NorthwestPurdue U., West LafayetteU. Southern 244,595Butler U.680DePauw U.308Earlham C.456Indiana Wesleyan U.706Manchester U.541Rose-Hulman Institute of Technology168Taylor U.225U. EvansvilleU. Notre DameValparaiso U.Wabash C.Iowa350240,078763320882,911Public (Iowa Board of Regents)870,455Iowa State U.358,474U. Iowa508,353U. Northern IowaPrivateCoe C.Cornell C.Des Moines U.Dordt C.Drake U.Grinnell C.Luther C.Palmer C. of ChiropracticPalmer C. of Chiropractic, DavenportKansasPublic (Kansas Board of Regents)Emporia State U.Fort Hays State U.Kansas State U.Pittsburg State U.3,62812,456699417 43218,6222,513U. Kansas352,643Wichita State U.128,795Kentucky611,489
National Center for Science and Engineering Statistics NSF 21-314TABLE 6Higher education R&D expenditures at institutions in both survey populations, by state, institutional control, system, andinstitution: FY 2019(Dollars in thousands)State, institutional control, system, and institutionPublic (Kentucky Council on Postsecondary Education)All R&Dexpenditures610,983Eastern Kentucky U.1,125Kentucky State U.8,433Morehead State U.2,028Murray State U.3,710Northern Kentucky U.2,363U. Kentucky410,581U. Louisville173,462Western Kentucky U.PrivateCentre C.LouisianaPublic (State of Louisiana Board of Regents)Louisiana State U. SystemLouisiana State U., Baton ana State U., Health Sciences Center, New Orleans40,914Louisiana State U., Health Sciences Center, Shreveport26,262Louisiana State U., ShreveportSouthern U. System57210,536Southern U. and A&M C., Agricultural Research and Extension Center5,448Southern U. and A&M C., Baton Rouge4,492Southern U., New OrleansU. Louisiana System596195,995Grambling State U.2,836Louisiana Tech U.26,143McNeese State U.370Nicholls State U.Northwestern State U. LouisianaSoutheastern Louisiana U.U. Louisiana, LafayetteU. Louisiana, MonroeU. New OrleansPrivateDillard U.Loyola U., New OrleansTulane U.Xavier U. LouisianaMainePublicMaine Maritime AcademyU. Maine SystemU. MaineU. Maine FarmingtonU. Southern 135266,65414,324Bates C.2,135Bowdoin C.2,991Colby C.1,852U. New EnglandMaryland7,3464,631,380
National Center for Science and Engineering Statistics NSF 21-314TABLE 6Higher education R&D expenditures at institutions in both survey populations, by state, institutional control, system, andinstitution: FY 2019(Dollars in thousands)State, institutional control, system, and institutionPublicMorgan State U.St. Mary's C. MarylandU. System MarylandBowie State U.Coppin State U.Salisbury U.Towson U.U. BaltimoreU. MarylandbU. Maryland Center for Environmental ScienceU. Maryland, Baltimore CountyU. Maryland, Eastern ShoreU.S. Naval AcademyUniformed Services U. of the Health SciencesPrivateGoucher C.Johns Hopkins U.cLoyola U., MarylandMaryland Institute C. of ArtMassachusettsPublicMassachusetts System of Public Higher EducationAll 871Bridgewater State U.331Framingham State U.1,540U. Massachusetts SystemU. Massachusetts, AmherstU. Massachusetts, BostonU. Massachusetts, central officeU. Massachusetts, DartmouthU. Massachusetts, LowellU. Massachusetts, Medical 281,5073,630,088Amherst C.6,325Babson C.1,845Bentley U.465Boston C.61,956Boston U.534,205Brandeis U.C. of the Holy CrossClark U.60,82547710,193Emerson C.1,145Franklin W. Olin C. of Engineering1,655Hampshire C.Harvard U.Hult International Business SchoolLasell C.Massachusetts Institute of TechnologyMCPHS U.Merrimack C.2251,239,736959 i1631,009,4666061,097
National Center for Science and Engineering Statistics NSF 21-314TABLE 6Higher education R&D expenditures at institutions in both survey populations, by state, institutional control, system, andinstitution: FY 2019(Dollars in thousands)State, institutional control, system, and institutionAll R&DexpendituresMGH Institute of Health Professions4,130Mount Holyoke C.2,979New England C. of OptometryNortheastern U.Simmons U.1,223183,998472Smith C.6,041Stonehill C.1,019Suffolk U.Tufts U.Wellesley C.Western New England U.Wheaton C., NortonWilliams C.Woods Hole Oceanographic InstitutionWorcester Polytechnic Michigan2,893,098Public2,815,910Central Michigan U.17,102Eastern Michigan U.7,175Ferris State U.Grand Valley State U.Lake Superior State U.Michigan State U.Michigan Technological U.Northern Michigan U.Oakland U.Saginaw Valley State U.U. MichiganU. Michigan, Ann ArborU. Michigan, DearbornU. Michigan, FlintWayne State U.Western Michigan U. and Homer Stryker M.D. School of 88Albion C.1,040Andrews U.1,126Calvin U.1,577Hope C.2,745Kalamazoo C.635 iKettering U.1,765Lawrence Technological U.1,352U. Detroit MercyVan Andel Research 303Minnesota State Colleges and Universities SystemMetropolitan State U.Minnesota State U., MankatoMinnesota State U., MoorheadSt. Cloud State U.7,506150 i3,3922093,275
National Center for Science and Engineering Statistics NSF 21-314TABLE 6Higher education R&D expenditures at institutions in both survey populations, by state, institutional control, system, andinstitution: FY 2019(Dollars in thousands)State, institutional control, system, and institutionWinona State U.U. MinnesotaU. Minnesota, CrookstonAll R&Dexpenditures4801,042,797282U. Minnesota, Duluth27,530U. Minnesota, Morris1,234U. Minnesota, RochesterU. Minnesota, Twin CitiesPrivateAugsburg U.6391,013,11214,212991C. of Saint Benedict1,126 iCarleton C.4,388Gustavus Adolphus C.Macalester C.Northwestern Health Sciences U.8081,808150 iSaint John's U., Collegeville1,191 iSaint Mary's U. Minnesota603St. Catherine U.St. Olaf C.U. of St. Thomas (MN)MississippiPublic (Mississippi State Institutions of Higher Learning)Alcorn State U.Delta State U.Jackson State U.Mississippi State U.Mississippi Valley State U.U. MississippiU. Southern MississippiPrivateMillsaps C.Tougaloo C.MissouriPublic (Missouri Department of Higher ,068Lincoln U., Jefferson City4,581Missouri State U.5,910Missouri Western State U.176Northwest Missouri State U.192Southeast Missouri State U.372Truman State U.285U. Central Missouri415U. Missouri System361,137Missouri U. of Science and TechnologyU. Missouri, ColumbiaU. Missouri, Kansas CityU. Missouri, Saint LouisPrivate41,939278,79326,70813,697954,246A. T. Still U.644Kansas City U. of Medicine and Biosciences245Logan U.Saint Louis U.16666,103
National Center for Science and Engineering Statistics NSF 21-314TABLE 6Higher education R&D expenditures at institutions in both survey populations, by state, institutional control, system, andinstitution: FY 2019(Dollars in thousands)State, institutional control, system, and institutionWashington U., Saint LouisMontanaPublic (Montana U. System)Montana State U.Montana State U., BillingsMontana State U., BozemanMontana State U., NorthernU. MontanaMontana Technological U.U. Montana, MissoulaPrivateSalish Kootenai C.All 8Public547,356U. Nebraska SystemU. Nebraska, central administrationU. Nebraska, Kearney547,35618,8602,919U. Nebraska, Lincoln316,820U. Nebraska, Medical Center194,455U. Nebraska, OmahaPrivateCreighton U.Doane U.NevadaPublic (Nevada System of Higher Education)C. Southern NevadaDesert Research InstituteNevada State C.U. Nevada, Las VegasU. Nevada, RenoPrivateRoseman U. of Health SciencesNew HampshirePublic (U. System of New Hampshire)Keene State C.Plymouth State U.U. New HampshirePrivateDartmouth C. and Dartmouth Hitchcock Medical CenterNew JerseyPublicC. New JerseyKean U.Montclair State U.New Jersey City U.New Jersey Institute of TechnologyRamapo C. New JerseyRowan U.Rutgers, the State U. of New JerseyRutgers, State U. New Jersey, 9170199,445152,1283,9163,916 ,1213,211
National Center for Science and Engineering Statistics NSF 21-314TABLE 6Higher education R&D expenditures at institutions in both survey populations, by state, institutional control, system, andinstitution: FY 2019(Dollars in thousands)State, institutional control, system, and institutionRutgers, State U. New Jersey, New BrunswickRutgers, State U. New Jersey, NewarkStockton U.William Paterson U.PrivateFairleigh Dickinson U.Monmouth U.Princeton U.Rider U.Seton Hall U.Stevens Institute of TechnologyNew MexicoPublic (New Mexico Higher Education Department)Eastern New Mexico U., PortalesNew Mexico Highlands U.New Mexico Institute of Mining and TechnologyNew Mexico State U.Northern New Mexico C.U. New MexicoAll 616101,457581239,696New York7,086,232Public1,612,606CUNY System170,607CUNY, Advanced Science Research Center8,310CUNY, Baruch C.2,387CUNY, Brooklyn C.7,064 iCUNY, C. Staten IslandCUNY, City C.CUNY, Graduate CenterCUNY, Graduate School of Public Health and Health Policy3,98652,7385,3999,521CUNY, Hunter C.37,478CUNY, John Jay C. of Criminal Justice12,295CUNY, Lehman C.4,690CUNY, Medgar Evers C.1,397CUNY, New York City C. of TechnologyCUNY, Queens C.CUNY, system officeCUNY, York C.SUNY SystemSUNY, Binghamton U.2,71118,3912,6191,6211,431,234104,297SUNY, Buffalo State2,124SUNY, C. Brockport1,390SUNY, C. CortlandSUNY, C. of Environmental Science and Forestry52729,137SUNY, C. of Optometry2,968SUNY, C. Plattsburgh1,729SUNY, DelhiSUNY, Downstate Medical CenterSUNY, Geneseo63436,0152,139SUNY, New Paltz494SUNY, Oneonta623
National Center for Science and Engineering Statistics NSF 21
Southwest C. of Naturopathic Medicine and Health Sciences 230 Arkansas 367,555 Public 366,071 . High Tech High Graduate School of Ed. 2,223 International Technological U. 660 i La Sierra U. 1,581 . Trinity C., Hartford 1,858 U. Bridgeport 642