Transcription
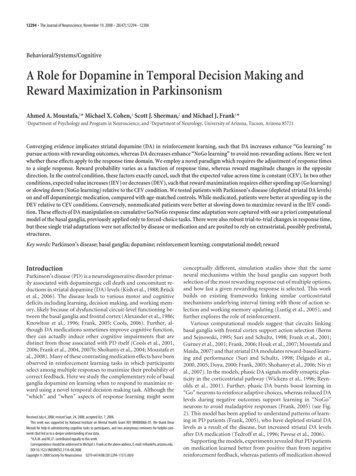
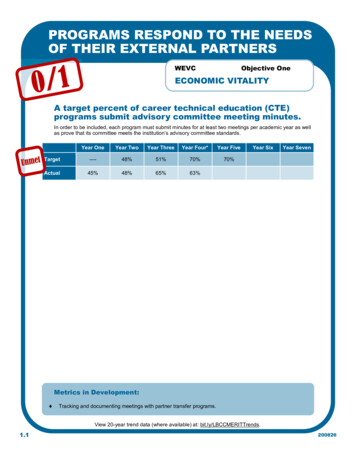
PROGRAMS RESPOND TO THE NEEDSOF THEIR EXTERNAL PARTNERSWEVCObjective OneECONOMIC VITALITYA target percent of career technical education (CTE)programs submit advisory committee meeting minutes.In order to be included, each program must submit minutes for at least two meetings per academic year as wellas prove that its committee meets the institution’s advisory committee standards.Year OneYear TwoYear ThreeYear Four*Year FiveTarget—-48%51%70%70%Actual45%48%65%63%Year SixYear SevenMetrics in Development: Tracking and documenting meetings with partner transfer programs.View 20-year trend data (where available) at: bit.ly/LBCCMERITTrends.1.1200826
STUDENTS ONBOARDSUCCESSFULLY INTO THE COLLEGEProgressionObjective TwoEDUCATIONAL ATTAINMENTA target percent of students report being satisfied withtheir experience in the New Student Center.The percent is based off the number of students who indicate “satisfied” or “very satisfied” when asked “Howsatisfied are you with your experience at the New Student Center?”.Year OneYear TwoYear ThreeYear Four*Year FiveTarget—-—-95%95%95%Actual—-92%92%92%Year SixYear SevenA target percent of students receive appropriate firstterm schedules.The percent is based off the number of students who make no schedule changes between the day of theirappointment at the New Student Center and seven days after the start of the term.Year OneYear TwoYear ThreeYear Four*Year FiveTarget—-32%33%33%33%Actual29%30%29%29%Year SixYear SevenMetrics in Development: Tracking that students stop making major changes after their third terms.View 20-year trend data (where available) at: bit.ly/LBCCMERITTrends.1.2200826
STUDENTS EXPERIENCE HIGHQUALITY COURSESLInCObjective ThreeEDUCATIONAL ATTAINMENTA target percent of courses report outcomes results.The percent is based off the number of courses with outcomes on file that report student achievement data overthe academic year (including those with errors).Year OneYear TwoYear ThreeYear Four*Year FiveTarget—-55%58%83%83%Actual52%55%80%77%Year SixYear SevenA target percent of students report being expected touse higher order thinking skills in their courses.The percent is based off the number of students who indicate “quite a bit” or “very much” when asked questions5b through 5f (those dealing with skills emphasized in coursework) during administrations of the CommunityCollege Survey of Student Engagement (CCSSE).Year OneYear TwoYear ThreeYear Four*Year Year SixYear SevenA target percent of students report interacting withdifference in their courses.The percent is based off the number of students who indicate “often” or “very often” when asked “how oftenhave you had serious conversations with students who differ from you?” during administrations of theCommunity College Survey of Student Engagement (CCSSE).Year OneYear TwoYear ThreeYear Four*Year Year SixYear SevenView 20-year trend data (where available) at: bit.ly/LBCCMERITTrends.1.3A200826
STUDENTS EXPERIENCE HIGHQUALITY COURSESLInCObjective ThreeEDUCATIONAL ATTAINMENTA target percent of courses utilize the campussupported Learning Management System (LMS).The percent is based off the number of credit courses with shells available to students in Moodle.Year OneYear TwoYear ThreeYear Four*Year 29%ForthcomingYear SixYear SevenMetrics in Development: Tracking student success data (grades of C or better) to ensure that underrepresented minority studentsperform at parity with the overall course success rate.View 20-year trend data (where available) at: bit.ly/LBCCMERITTrends.1.3B200826
THE ENTERING STUDENT BODYREPRESENTS TARGET POPULATIONSProgressionObjective FourEDUCATIONAL ATTAINMENTA target percent of the district’s 12th grade studentsenroll at LBCC.The percent is based off the number of 12th grade students from in-district high schools who enroll in at leastone credit class at LBCC during the next academic year.Year OneYear TwoYear ThreeYear Four*Year FiveTarget—-30%30%30%30%Actual30%30%29%29%Year SixYear SevenThe percent of incoming Hispanic/Latino studentsmatches the composition of the district.The incoming student percent is based off the number of students who apply and enroll at LBCC for the firsttime; the district composition percent is based off the American Community Survey (ACS) population estimatesfor those aged 19 and younger (tables B01001 and B01001I; five-year averages).Year OneYear TwoYear ThreeYear Four*Year FiveTarget—-14%14%14%14%Actual14%13%14%15%Year SixYear SevenA target percent of Adult Basic Skills (ABS) programparticipants transition to degree-seeking status.The percent is based off the number of students who register for a subsequent credit class within a year of theirfirst Adult Basic Skills (ABS) course.Year OneYear TwoYear ThreeYear Four*Year FiveTarget—-10%14%14%16%Actual7%11%8%13%Year SixYear SevenMetrics in Development: None!View 20-year trend data (where available) at: bit.ly/LBCCMERITTrends.1.4200826
STUDENTS RECEIVE AN AFFORDABLEEDUCATIONWEVCObjective FiveECONOMIC VITALITYAverage textbook price is less than the target.The average is weighted based on student enrollment (so that small expensive programs do notdisproportionally drive up the average that most students experience).Year OneYear TwoYear ThreeYear Four*Year FiveTarget—- 47.00 45.00 34.00ForthcomingActual 48.41 46.06 34.72ForthcomingYear SixYear SevenA target percent of incoming students apply for federalfinancial aid.The incoming student percent is based off the number of students who apply and enroll at LBCC for the firsttime; the percent applying for aid is based off the number of students who have submitted a FAFSA.Year OneYear TwoYear ThreeYear Four*Year FiveTarget—-77%77%77%77%Actual74%74%74%74%Year SixYear SevenMetrics in Development: Tracking claimed vs unclaimed scholarships. Offering education around financial literacy.View 20-year trend data (where available) at: bit.ly/LBCCMERITTrends.2.5200826
STUDENTS MAINTAIN OR INCREASETHEIR STARTING CREDIT LOADProgressionObjective SixEDUCATIONAL ATTAINMENTA target percent of incoming students maintain orincrease their starting credit load in their second term.The percent is based off the number of students who apply and enroll at LBCC for the first time in fall and areretained for credit in the next term.Year OneYear TwoYear ThreeYear Four*Year FiveTarget—-58%64%64%64%Actual55%61%60%52%Year SixYear SevenMetrics in Development: Documenting advising discussions for all students who decrease their credit load.View 20-year trend data (where available) at: bit.ly/LBCCMERITTrends.2.6200826
STUDENTS COMPLETE MATH ANDWRITING REQUIREMENTSLInCObjective SevenEDUCATIONAL ATTAINMENTA target percent of students will complete the collegegateway math level within their first 30 credits.The percent is based off the number of students who: apply and enroll at LBCC for the first time in fall do not have a prior math completion (either from College Now or transferred from another institution) pass MTH 105 or 111 with a C or better within their first 30 attempted credits (given one academic year).Year OneYear TwoYear ThreeYear Four*Year FiveTarget—-26%26%26%26%Actual23%24%25%23%Year SixYear SevenA target percent of students will complete the collegegateway writing level within their first 30 credits.The percent is based off the number of students who: apply and enroll at LBCC for the first time in fall do not have a prior writing completion (either from College Now or transferred from another institution) pass WR 121 with a C or better within their first 30 attempted credits (given one academic year).Year OneYear TwoYear ThreeYear Four*Year FiveTarget—-50%53%53%53%Actual47%50%50%41%Year SixYear SevenMetrics in Development: Tracking math and writing completion based on program requirements instead of overall college level.View 20-year trend data (where available) at: bit.ly/LBCCMERITTrends.2.7200826
STUDENTS ARE RETAINED FROMTERM TO TERMProgressionObjective EightEDUCATIONAL ATTAINMENTA target percent of incoming students are retained tothe next fall.The percent is based off the number of students who apply and enroll at LBCC for the first time in fall.Year OneYear TwoYear ThreeYear Four*Year FiveTarget—-49%50%51%55%Actual46%47%48%52%Year SixYear SevenA target percent of incoming Hispanic/Latino studentsare retained to the next fall.The percent is based off the number of students who apply and enroll at LBCC for the first time in fall.Year OneYear TwoYear ThreeYear Four*Year FiveTarget—-43%49%49%52%Actual40%46%45%49%Year SixYear SevenA target percent of former Adult Basic Skills (ABS)students are retained to the next year.The percent is based off the number of students who register for a subsequent credit class within a year of theirfirst Adult Basic Skills (ABS) course and are retained as of the same term the next year.Year OneYear TwoYear ThreeYear Four*Year FiveTarget—-45%51%51%53%Actual42%48%45%50%Year SixYear SevenMetrics in Development: Tracking student use of support services (such as the Learning Center and the library) , offices (such asadvising, financial aid, and CFAR), and tools (such as degree auditing, scheduler, and LMSs).View 20-year trend data (where available) at: bit.ly/LBCCMERITTrends.2.8200826
THE COMMUNITY IS PROVIDEDROBUST EVENTS AND PROGRAMSWEVCObjective NineCULTURAL RICHNESSA target percent of on-campus programming issomething other than a meeting or a class.This includes events and programs categorized as athletic events, clubs, conferences, lectures/presentations,non-profit events, performances, and workshops.Year OneYear TwoYear ThreeYear Four*Year FiveTarget—-—-16%25%36%Actual—-13%22%33%Year SixYear SevenMetrics in Development: Tracking internally sponsored events details (such as intended audience, headcount, and any outcomesassessment). Tracking externally sponsored events details (such as intended audience, headcount, and any outcomesassessment). Tracking student involvement in the community.View 20-year trend data (where available) at: bit.ly/LBCCMERITTrends.2.9200826
STUDENTS AND EMPLOYEES BOOSTINTERCULTURAL COMPETENCYLInCObjective TenCULTURAL RICHNESSThe overall pass rate for courses flagged as CulturalDiversity, Cultural Literary, or Difference, Power, andDiscrimination reaches a target percent.Passing requires a grade of C or better.Year OneYear TwoYear ThreeYear Four*Year FiveTarget—-91%91%91%91%Actual88%88%87%87%Year SixYear SevenMetrics in Development: Assessing cognitive gains of employees who participate in specialized trainings (such as LeadershipLBCC). Implementing a formal evaluation of employee’ individual cultural competency levels (potentially as part ofthe appraisal process).View 20-year trend data (where available) at: bit.ly/LBCCMERITTrends.2.10200826
STUDENTS GRADUATE OR TRANSFERTO A UNIVERSITYProgressionObjective ElevenEDUCATIONAL ATTAINMENTA target percent of incoming students graduate withinthree years.The percent is based off the number of students who apply and enroll at LBCC for the first time in fall.Year OneYear TwoYear ThreeYear Four*Year FiveTarget—-17%17%17%20%Actual14%14%15%17%Year SixYear SevenA target percent of incoming Hispanic/Latino studentsgraduate within three years.The percent is based off the number of students who apply and enroll at LBCC for the first time in fall.Year OneYear TwoYear ThreeYear Four*Year FiveTarget—-14%16%16%17%Actual11%13%12%14%Year SixYear SevenA target percent of former Adult Basic Skills (ABS)students graduate within three years.The percent is based off the number of students who register for a subsequent credit class within a year of theirfirst Adult Basic Skills (ABS) course and graduate within three years of that first credit course.3.11AYear OneYear TwoYear ThreeYear Four*Year FiveTarget—-7%15%15%15%Actual4%12%7%10%Year SixYear Seven200826
STUDENTS GRADUATE OR TRANSFERTO A UNIVERSITYProgressionObjective ElevenEDUCATIONAL ATTAINMENTA target percent of incoming Associate of Science (AS)students are enrolled in the Degree PartnershipProgram (DPP) by the start of their second year.The percent is based off the number of students who apply and enroll at LBCC for the first time in fall and doesnot include students who initially enroll as DPP.Year OneYear TwoYear ThreeYear Four*Year FiveTarget—-14%15%15%15%Actual11%12%10%9%Year SixYear SevenA target percent of incoming students transfer to afour-year institution within three years (withoutearning a degree first).The percent is based off the number of students who apply and enroll at LBCC for the first time in fall.Year OneYear TwoYear ThreeYear Four*Year FiveTarget—-22%22%22%22%Actual19%18%17%15%Year SixYear SevenMetrics in Development: None!View 20-year trend data (where available) at: bit.ly/LBCCMERITTrends.3.11B200826
GRADUATES MEET THE PROGRAMLEARNING OUTCOMESLInCObjective TwelveECONOMIC VITALITYMetrics in Development: Collect course learning outcomes assessment data at the individual student level in order to leveragealignments to calculate program learning outcomes for all graduates at all levels Outcomes are now collected at this level; however, not enough time has passed for any student tohave all their outcomes collected this way, so final alignment is not possible yet. Estimated date of first data: Summer 2022View 20-year trend data (where available) at: bit.ly/LBCCMERITTrends.3.12200826
GRADUATES ACHIEVE SUCCESSAFTER COLLEGEWEVCObjective ThirteenECONOMIC VITALITYA target percent of career and technical education(CTE) graduates are employed.Employed in this context means working at least 30 hours a week in any field for at least one quarter by sixmonths after graduation.Year OneYear TwoYear ThreeYear Four*Year FiveTarget—-63%67%68%68%Actual56%64%66%64%Year SixYear SevenA target percent of transfer graduates are enrolled at afour-year institution.Enrolled in this context means registering for credit in any major for at least one term or semester by six monthsafter graduation.Year OneYear TwoYear ThreeYear Four*Year FiveTarget—-58%58%58%62%Actual55%48%48%59%Year SixYear SevenMetrics in Development: Tracking graduates’ wages before and after graduation. Tracking graduates’ subsequent baccalaureate degree completion.View 20-year trend data (where available) at: bit.ly/LBCCMERITTrends.3.13200826
THE COMMUNITY IS PROVIDED NONDEGREE-BASED PROGRAMMINGWEVCObjective FourteenCULTURAL RICHNESSA target percent of adult community educationparticipants returned for another class.The percent is based off the number of individuals who registered for any adult community education (ACE)course and returned for a second course within a year.Year OneYear TwoYear ThreeYear Four*Year FiveTarget—-38%38%38%39%Actual35%32%34%36%Year SixYear SevenMetrics in Development: None!View 20-year trend data (where available) at: bit.ly/LBCCMERITTrends.3.14200826
The percent is based off the number of credit courses with shells available to students in Moodle. EDUCATIONAL ATTAINMENT LInC Objective Three STUDENTS EXPERIENCE HIGH-QUALITY COURSES A target percent of courses utilize the campus-supported Learning Management System (LMS