Transcription
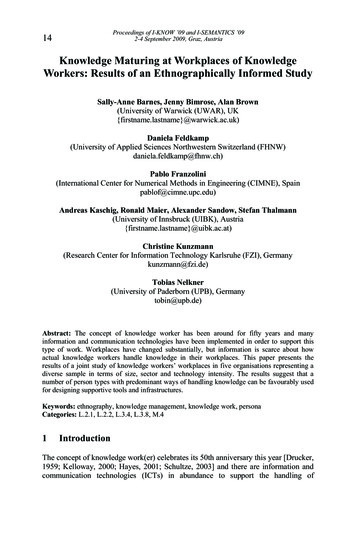
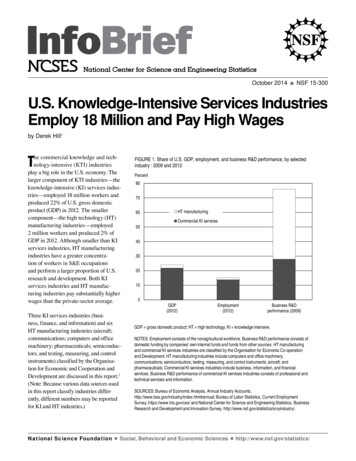
October 2014NSF 15-300U.S. Knowledge-Intensive Services IndustriesEmploy 18 Million and Pay High Wagesby Derek Hill1The commercial knowledge and technology-intensive (KTI) industriesplay a big role in the U.S. economy. Thelarger component of KTI industries—theknowledge-intensive (KI) services industries—employed 18 million workers andproduced 22% of U.S. gross domesticproduct (GDP) in 2012. The smallercomponent—the high technology (HT)manufacturing industries—employed2 million workers and produced 2% ofGDP in 2012. Although smaller than KIservices industries, HT manufacturingindustries have a greater concentration of workers in S&E occupationsand perform a larger proportion of U.S.research and development. Both KIservices industries and HT manufacturing industries pay substantially higherwages than the private-sector average.Three KI services industries (business, finance, and information) and sixHT manufacturing industries (aircraft;communications; computers and officemachinery; pharmaceuticals; semiconductors; and testing, measuring, and controlinstruments) classified by the Organisation for Economic and Cooperation andDevelopment are discussed in this report.2(Note: Because various data sources usedin this report classify industries differently, different numbers may be reportedfor KI and HT industries.)National Science FoundationgFIGURE 1. Share of U.S. GDP, employment, and business R&D performance, by selectedindustry : 2009 and 2012Percent8070HT manufacturing60Commercial KI ss R&Dperformance (2009)GDP gross domestic product; HT high technology; KI knowledge intensive.NOTES: Employment consists of the nonagricultural workforce. Business R&D performance consists ofdomestic funding by companies' own internal funds and funds from other sources. HT manufacturingand commercial KI services industries are classified by the Organisation for Economic Co-operationand Development. HT manufacturing industries include computers and office machinery;communications; semiconductors; testing, measuring, and control instruments; aircraft; andpharmaceuticals. Commercial KI services industries include business, information, and financialservices. Business R&D performance of commercial KI services industries consists of professional andtechnical services and information.SOURCES: Bureau of Economic Analysis, Annual Industry ual; Bureau of Labor Statistics, Current EmploymentSurvey, https://www.bls.gov/ces/ and National Center for Science and Engineering Statistics, BusinessResearch and Development and Innovation Survey, , Behavioral and Economic Sciencesghttp://www.nsf.gov/statistics/
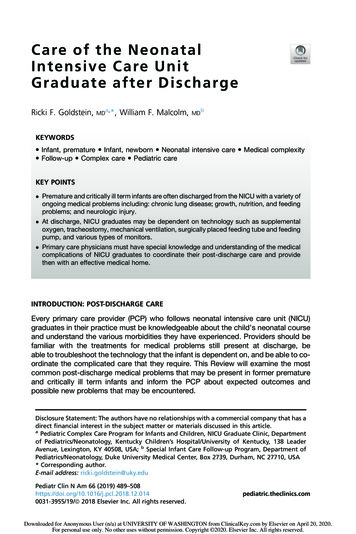
TABLE 1. Value-added output of selected U.S. industries and sectors: Selected years, 2000–12(Billions of current U.S. dollars)Industry or sectorAll sectors and industries20009,9526,4752,013834All private servicesCommercial KI servicesBusinessProfessional, scientific, andtechnical servicesManagement of companies and enterprisesFinanceInformationOther servicesEducationHealth care and social assistanceAll othersManufacturingHT manufacturingAircraftCommunicationsComputers and office machineryPharmaceuticalsSemiconductorsTesting, measuring, and control instrumentsOther manufacturingOther 847531231,5251,3182,026HT high technology; KI knowledge intensive.NOTES: Reporting categories follow the data source. Value-added output is the amount contributed by the industry to the value of a good or service. HTmanufacturing and KI services industries are classified by the Organisation for Economic Co-operation and Development. Data for HT manufacturingindustries are from IHS Global Insight; data for all other industries are from the Bureau of Economic Analysis.SOURCES: Bureau of Economic Analysis, GDP by Industry, http://www.bea.gov/industry/index.htm#annual, accessed 28 June 2013; IHS Global Insight,World Industry Service.KTI Industries in the U.S.EconomyIn 2012, KTI industries produced 3.8trillion in value-added output, nearlyone-fourth of the U.S. GDP (figure 1,table 1). The three KI services industries contributed the largest part byfar, producing 22% of the GDP. KTIindustries perform three-fourths of U.S.business R&D, an important source ofinnovation and economic growth.3 Thesix HT manufacturing industries aloneperformed nearly one-half of U.S. business R&D.2 InfoBriefgNSF 15-300KTI industries are major exporters. In2011, commercial KI services exportednearly one-half of the 587 billiontotal in U.S. cross-border exports forall services, and in 2012, HT manufacturing industries exported nearlyone-fourth of the 1,422 billion total inexports of nonpetroleum goods.4KTI industries tend to be leaders inproductivity growth. This is importantbecause productivity—the ratio ofproduction outputs to resource inputs—is a key source of economic growth andan indicator of development.5 In mostof the KI services industries for whichdata are available, labor productivityhas grown considerably faster than innonfarm business. Similarly, in severalHT manufacturing industries, laborproductivity has grown considerablyfaster than productivity in the manufacturing sector (figure 2).6Employment CharacteristicsEmploymentEmployment in KTI industries represented 15% of the U.S. workforce inOctober 2014
FIGURE 2. Labor productivity growth of selected U.S. HT manufacturing and KI services industries: 2000–11Average annual growth (%)20.0Selected HT manufacturing industries15.010.05.00.0-5.0All manufacturingAircraftCommunicationsComputers andoffice machineryPharmaceuticalsSemiconductors Testing, measuring,and controlinstruments20.0Selected KI services industries15.010.05.00.0All ankingBroadcasting(exceptInternet)Cable municationscarriersSOURCE: Bureau of Labor Statistics, Labor Productivity and Costs, September 2012, http://www.bls.gov/lpc/.2012 (figure 1). KI services employ farmore workers (18.4 million) than areemployed in the HT manufacturingindustries (1.8 million) (table 2). Employment in each of the three KI servicesindustries is much bigger than in HTmanufacturing industries as a whole.Business services has the largest workforce (9.9 million), with nearly one-halfemployed in four advanced-technologyOctober 2014industries: architectural and engineering,computer systems design, managementand technical consulting, and scientificR&D. Financial services has the nextlargest workforce (5.8 million), with over80% employed in the credit intermediation and insurance industries. Information services has the smallest labor force(2.7 million), with 0.9 million collectivelyemployed in four advanced technologyindustries: data processing, hosting, andrelated services; radio and televisionbroadcasting; software publishers; andwireless telecommunications carriers. Incontrast, the largest HT manufacturingindustry employer in 2012 was aircraft(0.5 million), followed by the semiconductors and the testing, measuring, andcontrol instruments industries, whichemploy about 0.4 million each.NSF 15-300gInfoBrief 3
TABLE 2. Employment of selected U.S. industries and sectors: Selected years, 2000–12(Thousands of persons)Industry or sectorTotal (nonfarm) businessesAll private industriesAll private servicesCommercial KI servicesBusinessProfessional, scientific, and technical servicesAccounting and bookkeepingAdvertising and related servicesArchitectural and engineering servicesComputer systems design servicesLegal servicesManagement and technical consulting servicesOther professional and business servicesScientific R&D servicesSpecialized design servicesManagement of companies and enterprisesFinanceCredit intermediationSecurities, commodity contracts, investmentsInsurance carriersAll othersInformationData processing, hosting, and related servicesMotion picture and sound recordingPublishing (except Internet)Software publishersRadio and television broadcastingCable and other subscription programmingWired telecommunications carriersWireless telecommunications carriersAll othersOther servicesEducationHealthAll othersManufacturingHT manufacturingAircraftCommunicationsComputers and office machineryPharmaceuticalsSemiconductorsTesting, measuring, and control instrumentsOther manufacturingOther 0,0986,49221,917HT high technology; KI knowledge intensive.NOTES: Reporting categories follow the data source. HT manufacturing and commercial KI services industries are classified by the Organisation for Economic Cooperation and Development.SOURCE: Bureau of Labor Statistics, Current Employment Statistics, http://www.bls.gov/ces/, accessed 15 July 2013.4 InfoBriefgNSF 15-300October 2014
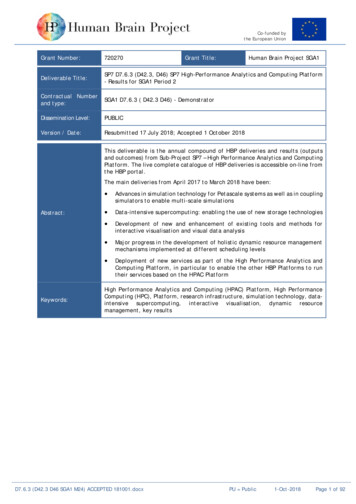
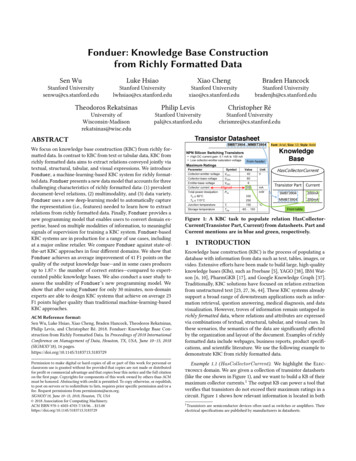
S&E workforce intensityKTI industries have a highly skilledworkforce as measured by S&Eworkforce intensity—defined as thepercentage of the workforce in S&Eoccupations. The S&E workforce intensities of HT manufacturing industries(26%) and commercial KI servicesindustries (16%) are significantlyhigher than the average S&E workforceintensity of private industries (4%)(table 3).services has the next highest S&E intensity (17%). Software publishers (46%)and data processing, hosting, and relatedservices (38%) have the highest S&Eintensities within this industry sector.S&E workforce intensity varies widelyamong individual KI services and HTmanufacturing industries. Businessservices has the highest S&E workforceintensity among the KI services industries, with about one in five employeesworking in an S&E occupation in 2012(table 3). Within business services,S&E workforce intensity is highest incomputer systems design (53%), scientific R&D (44%), and architectural andengineering (33%) (table 4). InformationWagesU.S. commercial KTI industries paymuch higher wages than other industries (figure 3, table 3). The averagesalaries of KI services industries andHT manufacturing industries in 2011were similar and were more than 20,000 higher than the private-sectoraverage. However, average salaries varywidely among individual HT manufacturing and commercial KI servicesindustries (tables 3, 4).Computers and office machinery manufacturing has the highest S&E workforceintensity among the HT manufacturingindustries (43%) (table 3), followed bycommunications (31%). Pharmaceuticalsranks the lowest at 20%.The wage premium in commercialKTI industries is due, in part, to thehigh concentration of workers in S&Eoccupations. In the private sector, S&Eworkers earn an average of 83,000,close to double the salary of non-S&Eworkers (figure 3, table 3). However,this is not the whole story. Non-S&Eworkers in commercial KTI industriesearn at least 18,000 more than those inother industries.Business services pays the highestaverage salary ( 73,000) amongcommercial KI services industries(table 4). Within this category, averagesalaries are highest in computersystems design and related servicesand in scientific R&D ( 85,000). Theaverage salary in information servicesis 64,000, with the software publishersindustry commanding the highestsalary ( 91,000) in this category.Among the HT manufacturing industries, computers and office machineryTABLE 3. Average salaries and S&E workforce intensity, by selected industry and broad occupation category: 2004 and 2012(Dollars)All occupationsIndustryAll private industriesCommercial KI servicesBusinessFinanceInformationHT manufacturingAircraftCommunicationsComputers and office machineryPharmaceuticalsSemiconductorsTesting, measuring, and control instrumentsAll other industriesS&E occupationsNon-S&E occupationsS&E workforceintensity .5HT high technology; KI knowledge intensive; S&E science and engineering.aPercentage of workforce in S&E occupations.NOTES: HT manufacturing and commercial KI services industries are classified by the Organisation for Economic Co-operation and Development. S&Eoccupations include biological, agricultural, and environmental scientists; computer scientists; life scientists; mathematicians; physical scientists; socialscientists; engineers; and S&E postsecondary teachers. Salary estimates are in current dollars and are rounded to the nearest thousand.SOURCE: Bureau of Labor Statistics, Occupational Employment Survey, special tabulations, July 2013.October 2014NSF 15-300gInfoBrief 5
TABLE 4. Average salaries and S&E workforce intensity for selected U.S. commercial KI services industries, by broad occupation: 2004 and 2012(Dollars)Service industryBusiness servicesAccounting, tax preparation, bookkeeping, and payroll servicesAdvertising, public relations, and related servicesArchitectural, engineering, and related servicesComputer systems design and related servicesLegal servicesManagement of companies and enterprisesManagement, scientific, and technical consulting servicesOther professional, scientific, and technical servicesScientific R&D servicesSpecialized design servicesFinancial servicesActivities related to credit intermediationAgencies, brokerages, and other insurance-related activitiesDepository credit intermediationInsurance and employee benefit fundsInsurance carriersMonetary authorities—central bankNondepository credit intermediationOther financial investment activitiesOther investment pools and fundsSecurities and commodity contracts intermediation and brokerageSecurities and commodity exchangesInformation servicesCable and other program distributionCable and other subscription programmingData processing, hosting, and related servicesInternet publishing and broadcastingInternet service providers and Web search portalsMotion picture and video industriesNewspaper, periodical, book, and directory publishersOther information servicesOther telecommunicationsRadio and television broadcastingSatellite telecommunicationsSoftware publishersSound recording industriesTelecommunications resellersWired telecommunications carriersWireless telecommunications carriers (except satellite)All 052,000na54,00063,00047,00060,000S&E 00081,00068,00086,000Non-S&E 00059,00043,00056,000S&E workforceintensitya2004 201218.7 21.43.82.73.53.629.5 33.348.3 52.51.21.411.7 12.918.4 17.95.94.240.0 44.13.64.74.85.43.46.02.32.73.23.4na7.87.79.514.7 21.54.65.27.15.3na8.96.96.816.2na11.8 16.66.5na7.84.729.0 38.029.2na36.9na1.72.34.43.95.2 23.714.7 20.22.83.111.6 12.848.3 45.93.83.216.1na16.3 16.513.7 15.4na not available.KI knowledge intensive; S&E science and engineering.aPercentage of workforce in S&E occupations.NOTES: Reporting categories follow the data source. Commercial KI services industries are classified by the Organisation for Economic Co-operation andDevelopment and include health, education, business, information, and financial services. S&E occupations include biological, agricultural, and environmentalscientists; computer scientists; life scientists; mathematicians; physical scientists; social scientists; engineers; and S&E postsecondary teachers. Salary estimatesare in current dollars and are rounded to the nearest thousand.SOURCE: Bureau of Labor Statistics, special tabulations, July 2013, of the Occupational Employment Survey.6 InfoBriefgNSF 15-300October 2014
FIGURE 3. Average annual salaries for selected U.S. industries and broad occupations: 2012Dollars100,00080,000All occupationsS&E occupations60,000Non-S&Eoccupations40,00020,
Jul 15, 2013 · HT high technology; KI knowledge intensive. NOTES: Reporting categories follow the data source. Value- added output is the amount contributed by the industry to the value of a good or service. HT manufacturing and KI services industries are classified by the Organisation for Economic Co- operation an