Transcription
S t ud y G ui deGeographyGrade 11
ContentsContentsGeneral Introduction . 1Introduction to geographical skills and techniques. 2Unit 1 Mapwork skills . 2Unit 2 Working with 1:50 000 topographic maps . 7Unit 3 Aerial photographs and orthophoto maps . 11Unit 4 Geographical Information Systems . 14Unit 5 Using atlases .17Unit 6 Fieldwork. 19Questions . 20Topic 1 The atmosphere. 22Unit 1 The Earth’s energy balance . 22Unit 2 Global air circulation . 28Unit 3 Africa’s weather and climate . 40Unit 4 Droughts and desertification . 46Questions .51Topic 2 Geomorphology . 56Unit 1 Topography associated with horizontally layered rocks . 56Unit 2 Topography associated with inclined rock strata . 59Unit 3 Topography associated with massive igneous rocks . 62Unit 4 Slopes . 65Unit 5 Mass movements and human responses . 68Questions . 72Topic 3 Development geography . 80Unit 1 The concept of development . 80Unit 2 Frameworks for development . 86Unit 3 Trade and development . 90Unit 4 Development issues and challenges . 95Unit 5 Role of development aid . 99Questions . 102 Via Afrika Publishers » G e o g r a p h y 11 Study Guide eBook
ContentsTopic4 Resources and sustainability . 109Unit 1 Using resources . 109Unit 2 Soils and soil erosion . 112Unit 3 Conventional energy sources and their impact on the environment . 117Unit 4 Non-conventional energy sources . 121Unit 5 Energy management in South Africa . 125Questions . 128Exam Papers.132Answers . 144 Via Afrika Publishers » G e o g r a p h y 11 Study Guide eBook
General IntroductionIntroduction to our Geography 11 Study Guide eBookWelcome to the Grade 11 Geography Study Guide. The subject of Geography haschanged considerably over time and it continues to change because it is one of the mostdynamic subjects in the curriculum. The Earth and its atmosphere, the home ofhumankind, is changing all the time and that is what makes our subject so special.This guide must be used in conjunction with the main textbook, as it is a summary ofthe main components of the textbook. Geography, like any other subject, does containfacts which must be understood and learnt, but it also emphasises skills. It is necessaryfor the learner to analyse and use these facts to understand phenomena and to try tosolve problems. Our lives depend on the ways in which we treat our environment. Thus,as citizens of the Earth, we must understand the changes that are constantly takingplace and our own impact on our surroundings.Geography is all around us at all times. Get into the habit of looking at a city, town,village, landscape and trying to work out the processes that act on it. Why is that shopthere, why are there so many people there, why is that hill shaped liked that, how isthat river being used? These are the sort of questions that you must get into the habit ofasking yourself and trying to answer. Do this regularly and you will be a much betterGeographer.Once you have studied the detail in the main textbook, use this guide as a summary.Concentrate on the key concepts and build your knowledge around them. Do thisregularly and you will develop into a genuine geographer ready to take your place as akeeper of our vital environment. Via Afrika Publishers » G e o g r a p h y 11 Study Guide eBook1
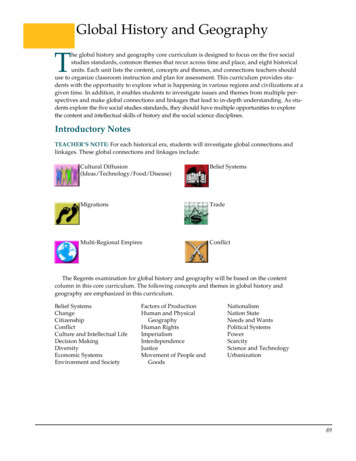
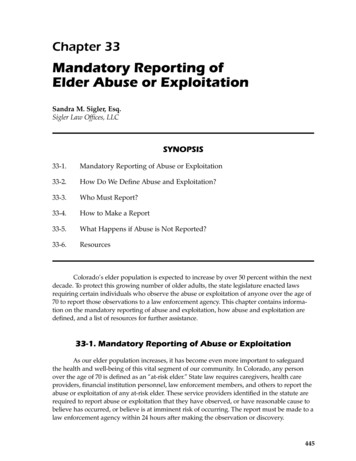
Introduction to geographical skills and techniquesIntroduction to geographical skills andtechniquesIntroductionThe aim of this topic is to explain the good skills and techniques you need to becomegeographically literate and to develop a sense of the spaces and area around you. Mapsare the language of geography. To become a good map user you must be familiar withthe necessary skills and techniques. You also need to be able to apply them in everydaysituations.Unit 1 Mapwork skills1Locating exact position (revision)You can find any place on Earth by finding the point at which its line of latitude andline of longitude intersect. All of South Africa is south of the equator and east of thePrime Meridian through Greenwich in England.FIGURE 1 The relationship between degrees, minutes and secondsEach degree (ºº) can be subdivided into 60 minutes ('') and each minute divided into 60seconds (""). This subdivision enables us to determine the position of any place or objectvery accurately. The geographic co-ordinates must be described in full as degrees,minutes, and seconds South and East. Via Afrika Publishers » G e o g r a p h y 11 Study Guide eBook2
Introduction to geographical skills and techniquesFIGURE 2 How to write a co-ordinate correctly2Locating relative position (revision)2.1What is direction?When we refer to direction we use the points of a compass card to describe the generaldirection from one feature to another (see Figure 3).FIGURE 3 Converting map direction to ground direction2.2 What is a bearing?Bearings indicate direction and are measured using a protractor and given in degrees. Via Afrika Publishers » G e o g r a p h y 11 Study Guide eBook3
Introduction to geographical skills and techniques2.2.1 True bearingTrue bearing is the angle measured relative to the true north line (see Figure 4). Thestarting point to determine true bearing is the north-south line. North will then alwaysbe 0º. True bearing is always measured clockwise from north at 0º.FIGURE 4 True bearing, magnetic bearing and magnetic declination2.2.2 Magnetic bearingMagnetic bearing is the angle measured relative to the magnetic north line(see Figure 5).Remember that for South Africa, magnetic north always lies west of true north.FIGURE 5 How magnetic declination is shown on South Africa’s topographic maps2.3 How do you calculate true bearing and magnetic bearing?The magnetic declination of any specific map area is shown on our topographic maps(see Figure 5). True bearing magnetic bearing magnetic declinationMagnetic bearing true bearing magnetic declination Via Afrika Publishers » G e o g r a p h y 11 Study Guide eBook4
Introduction to geographical skills and techniques5Calculating area of regular and irregular shapesTABLE 2 Calculating area of regular and irregular shapesYou must be able to convert both your km2 or m2 area to hectares (ha).One hectare (1 ha) 100 m 100 m 10 000 m221 km 10 ha 10 ha 100 haTo convert km2 to hectaresTo convert m2 to hectaresMultiply your answer by 100Divide your answer by 10 000 Via Afrika Publishers » G e o g r a p h y 11 Study Guide eBook6
Introduction to geographical skills and techniquesUnit 2 Working with 1:50 000topographic maps Contours are shown as brown lines on maps. Contours join all places of equal heightabove mean sea level (0 m).The South African 1:50 000 topographic maps have a contour interval of 20 m. Onthe 1:10 000 orthophoto maps the interval is 5 m.Contour lines close to each other indicate steep slopes.Contour lines that are far apart show gentle slopes.FIGURE 7 Landforms and associated contours Via Afrika Publishers » G e o g r a p h y 11 Study Guide eBook7
Introduction to geographical skills and techniques1What is a cross-section and how do you constructone?A cross-section is a drawing of the side view of a landform such as a valley, a hill, or asection of the landscape.FIGURE 8 Constructing a cross-sections2What is vertical exaggeration used for?Vertical exaggeration is the deliberate vertical stretching of a cross-section toemphasise the height of smaller landscape features such as valleys, hills, lowmountains. The ratio between the vertical scale and the horizontal scale is known as thevertical exaggeration.FIGURE 9 How to calculate vertical exaggeration Via Afrika Publishers » G e o g r a p h y 11 Study Guide eBook8
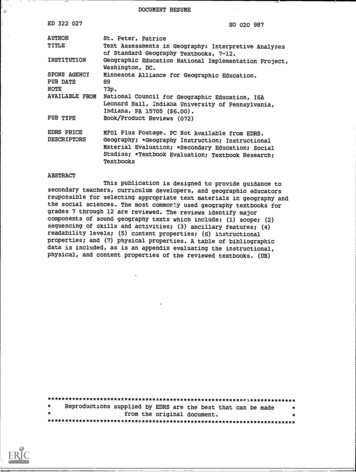
Introduction to geographical skills and techniques3What is intervisibility?Cross-sections provide a way to see which geographical features are visible from eachother (see Figure 10). When there are no blocking objects between any two featuresthese features are intervisible.FIGURE 10 Cross-sections allow you to determine intervisibility.4What is gradient?Gradient is the steepness or the angle of the slope of the ground. What does the termgradient tell us? Gradient is the ratio between height and the horizontal distance.4.1How do you calculate gradient?Using Figure 11 calculate the gradient between the wind pump and the trigonometricbeacon 408,3.FIGURE 11 Contour map to calculate gradient Via Afrika Publishers » G e o g r a p h y 11 Study Guide eBook9
Introduction to geographical skills and techniquesThe vertical difference (VD) is the height of the beacon minus the height of the windpump.VD 408,3 m – 320 m 88,3 mThe horizontal distance between the beacon and the wind pump is 5,3 cm as measuredon the map. This distance must be converted to metres. Therefore 5,3 cm map scaledivided by 100 will give us the distance in metres.HD 5,3 cm 50 000100 2650 mGradient VD 88,3 m 1HD2650 m30written as a ratio 1:30This means that for every 30 m walk there is a climb of 1 m. Via Afrika Publishers » G e o g r a p h y 11 Study Guide eBook10
Introduction to geographical skills and techniquesUnit 3 Aerial photographs andorthophoto maps1The use of aerial photographyOne of the most effective tools that the geographer can use for the interpretation of thelandscape is the aerial photograph and orthophoto map.2Oblique and vertical aerial photographsAerial photographs can be vertical, directly overhead or oblique which are taken at anangle. In this case the view is at some angle to the vertical.FIGURE 12 Difference between vertical, low-oblique and high-oblique photos.3How do you identify landforms and features?3.1Shape and patternCultural and built objects such as buildings, shopping malls and roads have regulargeometric shapes and distinct boundaries (see Figure 13). The shapes of naturalfeatures such as rivers, sand dunes and mountains are irregular and uneven. Via Afrika Publishers » G e o g r a p h y 11 Study Guide eBook11
Introduction to geographical skills and techniquesFIGURE 13 Shape and pattern are used to distinguish between objects on both panchromatic and colourphotographs.3.2 Using tone, texture and shadow to interpret photographsTABLE 3 Identifying objects by means of recognition elementsObjects on photographs can be identified by the following recognition elementsToneTone varies with the reflectivity of the object,the weather, the angle of the sunlight on anobject, and on moisture content of thesurface.Lighter toneDarker toneSmooth surfacesIrregular surfacesBare groundVegetationWinter vegetationSummer vegetationMuddy waterClear waterNew cropsMature cropsBare fieldsPloughed fieldsFIGURE 14 Bare fields are lighter in tone andsmoother. Via Afrika Publishers » G e o g r a p h y 11 Study Guide eBook12
Introduction to geographical skills and techniquesTextureShadowTexture may be described as coarse or fine,smooth or rough, even or uneven, speckled,granular, linear, woolly, and so on.It is a way of describing the smoothness orcoarseness of the image on the photo.Texture also describes the terrain surfaceroughness.Land coverCharacteristicsCultivationCrops have a speckledappearance.Ploughed field look striped anddarker.OrchardsandvineyardsOrchards have coarse and gridlike texture.Vineyards have a finer andstriped texture.ForestsandplantationsAppear mottled and coarse.Pine plantations look stippledand finer.Blue gum plantations lookgranular, coarser.Younger plantations appearstriped.FIGURE 15 Three different vegetation types can beidentified as a result of differences in texture.Objects cast shadows visible on photograph.Objects can be recognised by their shadowsalone: power lines, high buildings, coolingtowers, water towers.Help you to determine the time of day andposition of Sun.Reveal depth from inward cast shadows andheight from outward cast shadows.FIGURE 16 The circular shape indicates that theseobjects are storage tanks.4Identifying features on orthophoto mapsAn orthophoto map is a black and white photographic image to which cartographershave added helpful information such as contours, spot heights and street names. Thismakes them easier to identify. Via Afrika Publishers » G e o g r a p h y 11 Study Guide eBook13
Introduction to geographical skills and techniquesUnit 4 Geographical Information Systems1What is a Geographical Information System (GIS)?A Geographical Information System is a computerised system consisting of hardware,software and methods that are designed to capture, manage, manipulate, analyse,model, and display spatial geographic data as well as non-spatial attribute data in orderto solve complex planning and management problems. The concept of GIS consists ofthree separate words namely, geography, information, and system.1.1What are the functions of a GIS?A GIS has many functions that can be organised into the following groups: collecting and capturing datastoring and managing datarecalling and processing datatransforming and integrating with other dataanalysing datadisplaying data as maps and information tables.2Spatially referenced dataBefore geographic data can be used in a GIS it first must be spatially referenced in a coordinate system. This is known as georeferencing.FIGURE 17An example of georeferencing of geographic data Via Afrika Publishers » G e o g r a p h y 11 Study Guide eBook14
Introduction to geographical skills and techniques2.1Spatial resolutionSpatial resolution refers to the quantity of detail that can be detected. It describes thesize of the picture elements, or pixels, that make up the image.2.2 Spectral resolutionSpectral resolution is the ability of the sensor to detect information over several spectralbands of the electromagnetic spectrum.3Different types of data: point, line, area and attributeSpatial features can be classified as points, lines or area type features. Springs, bridges,monuments, beacons and wind pumps are all examples of point type features.FIGURE 18 The way a GIS stores and displays different spatial featuresSpatial data, or geographical data, is data which describes the shape and theabsolute and relative position of all geographical features or objects.Non-spatial data, or attribute data, is information which describes the spatialcharacteristics of the spatial features or objects.4Raster and vector data4.1Spatial data structuresData structures supply the information that is needed by the computer to create aspatial data model of the real world in digital format. There are two different formatsused for different types of data. Figure 19 illustrates the difference between raster dataand vector data. Via Afrika Publishers » G e o g r a p h y 11 Study Guide eBook15
Introduction to geographical skills and techniquesFIGURE 19 The difference between raster and vector data structures4.1.1Raster dataA raster data structure displays geographic features by means of arranged patternswithin a grid system of square or rectangular cells. The position of each cell isdetermined by the number of its row and column.4.1.2 Vector dataThe vector data structure shows geographic features in the form of basic geometricobjects such as points, lines and polygons. Via Afrika Publishers » G e o g r a p h y 11 Study Guide eBook16
Introduction to geographical skills and techniquesUnit 5 Using atlases5.1 What is an atlas and an atlas index?An atlas is a book with a collection of different maps showing a variety of interestingspatial information at various scales. It has different types of graphs, charts,photographs, diagrams, tables and text. These cover topics such as health issues,population pyramids, biodiversity, history of the Earth and humans, desertification andsoil degradation, world statistics and so on.Atlases are divided into various sections. The index at the back of your atlas lists placenames and features alphabetically. Next to the name of the feature or place is thedescription of type of feature, country, page number where the place appears mostprominently, an alphanumeric reference and the co-ordinates to the nearest minute.FIGURE 20Information from the index in an atlas Via Afrika Publishers » G e o g r a p h y 11 Study Guide eBook17
Introduction to geographical skills and techniquesTABLE 4 Using an atlas to find a place or to study a themeHow to use an atlas to find a placeHow to use an atlas to study a themeIf you are looking for information about a place orfeature:1 Go to the index at the back of the atlas.2 Use the alphabetical list to find the name of aplace or feature. All names are indexedalphabetically for each continent, country, city,town river, mountain, bay or any other namedgeographical feature.3 Find the page number of the map showing theplace or feature. Usually only one reference isgiven, although the same place may appear onmany maps.4 Find the reference that indicates where the placeor feature name appears on the map. Twodifferent references may be used, analphanumeric reference or geographicalcoordinates.If you are looking for information about a topic ortheme that you are studying:1 Go to the table of contents at the front of theatlas.2 Find the theme you need (for instance, climate).3 Find the page numbers of maps in each section ofthe atlas where you may find relevant maps atnational, continental and global scales.4 If the theme you are studying is not listed in thetable of contents, page through the atlas to seewhether your theme is a subtheme covered underanother heading.5 Use all the information available, including avariety of maps, different kinds of graphs, datatables and photographs. Via Afrika Publishers » G e o g r a p h y 11 Study Guide eBook18
Introduction to geographical skills and techniquesUnit 6 FieldworkTABLE 5How to conduct fieldworkGuidelines how to conduct fieldwork as part of a research escription1Identify anddefine a problemVia reading, observation ofcharacteristics and relationshipsBe feasible, relevant, appropriate andaccomplishableWhat?Who isinvolved?Class2Formulate ahypothesisPutting forward an educated guess whichmay be a possible reason for a solution tothe problem aboveStatement3Collect, describeand recordinformationDecide what information is neededDescribe features, measure dimensions,counting, taking photos, interviewingRecord onto questionnaires and recordingsheetsHow?Where?With what?When?Field4Analyse andinterpretinformationProcess Information with simplestatistical techniquesMaps, diagrams, graphs, tablesWhat patterns?How did ithappen?Why ithappened?ClassWrite report, poster or oral presentationMeaningful conclusions and suggestingsolutionsWhat is theimpact?Whatconsequences?What willhappen?Class5Present findingsand makerecommendationsAccept or reject hypothesis Via Afrika Publishers » G e o g r a p h y 11 Study Guide eBook19
Introduction to geographical skills and techniquesQuestionsQuestion 1Study the 1:50 000 topographic map extract of 2531 CC Barberton on page 260 in theLearner’s Book and answer the questions which follow.1.1State the latitude and longitude of spot height 1369 (E3)(4)1.2State the land use at 250 48' 30" S, 310 04'00" E(2)1.3A hiker walks from spot height 1369 (E3) to spot height 954 (D2). State the truebearing of the hiker’s walk.(2)1.4Indicate if each of the following statements is true or false. If false, write thecorrect answer.1.4.1The land in F2 is flatter than the land in C2.1.4.2Fruit is grown in D1.1.4.3The sawmill in B3 is an example of a primary activity.1.4.4The sewerage works in A3 are an example of a secondary activity.1.4.5There is evidence of a primary activity in D3.1.4.6The distance of the road of the R38 and the R40 (D3/D4) and Kaapmuidenis 46 km.1.4.7There is a power line in E1.1.4.8The unnamed river in F4, F5 and E5 flows towards the south-west.1.4.9A hiker walking from spot height 1625 (F3) in a south-easterly directionfor 1 500 metres goes down a convex slope.1.4.10 The dam wall in A1 is at a lower altitude than the dam wall in D2.(30)1.5The Barberton municipality wants to develop the residential area in A1 towardsthe west. State, giving a reason, if this residential area is high density or lowdensity.(4)1.6The municipality uses a GIS to plan the development. What does GIS stand for?(2)1.7Give three examples of thematic (information) layers that the developers woulduse in their planning.(6)[50] Via Afrika Publishers » G e o g r a p h y 11 Study Guide eBook20
Introduction to geographical skills and techniquesAnswers to QuestionsQuestion 11.1Latitude 25 49' 42–48" S(2)Longitude 31 02' 15–21" E(2)1.2No apparent land use or nature reserve(2)1.3326 –328 (2) OR 325 0r 329 (1)(2)1.4True/False1.4.1False (1), it is steeper (2)(3)1.4.2True(1)1.4.3False (1), it is a secondary activity (2)(3)1.4.4False (1), they are tertiary activities (2)(3)1.4.5True (1), either forestry or mining(1)1.4.6False (1), it is 46 km 1,5 – 2,5 km extra (2)(3)1.4.7True (1)(1)1.4.8False (1), it flows towards the north-east (2)(3)1.4.9True(1)1.4.10 True(1)(30)1.5High density (2) The roads are very close together or the blocks are very small.(2)(4)1.6Geographic Information System1.7There are many possible answers. Some of the more likely ones are: existinginfrastructure such as roads, power lines, water pipes, sewerage connections,existing buildings, geology, soil type.(3 2)(6)(2)[50] Via Afrika Publishers » G e o g r a p h y 11 Study Guide eBook21
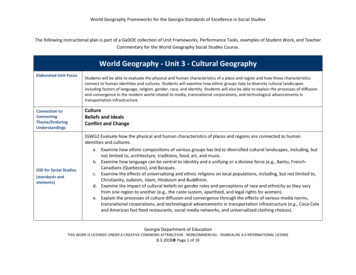
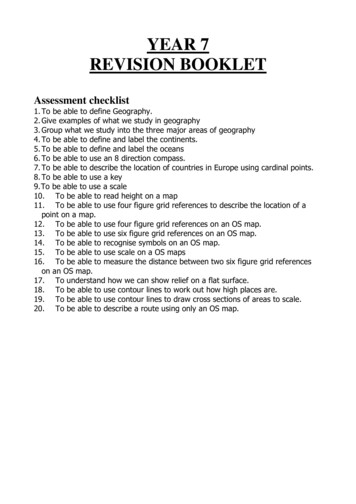
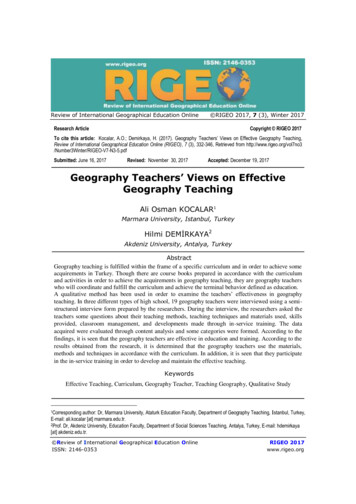
TOPIC 1The atmosphereTopic 1 The atmosphereIntroductionAlmost all life on Earth and all processes of the atmosphere depend on energy from theSun. The Sun emits this energy into space, radiating it in all directions. The Earth,about 150 million kilometres away, receives only a small part of this energy. The Sun’senergy heats the Earth’s atmosphere unequally and produces pressure differencesbetween the tropics and the polar regions. These differences cause winds and oceancurrents. Our familiar daily and seasonal temperature variations are due to changes inthe balance between the amount of incoming radiation from the Sun and the amount ofoutgoing radiation from the Earth.Unit 1 The Earth’s energy balance1What are the effects of unequal heating on the Earth’senergy balance?Incoming radiation from the Sun is mainly higher energy, short-wave radiation thatheats the Earth’s surface. The heated Earth radiates lower energy, long-wave, infraredenergy back into the atmosphere. This heats the atmosphere.FIGURE 2 1 Incoming solar radiation strikes the Earth’s curved surface at various angles. Via Afrika Publishers » G e o g r a p h y 11 Study Guide eBook22
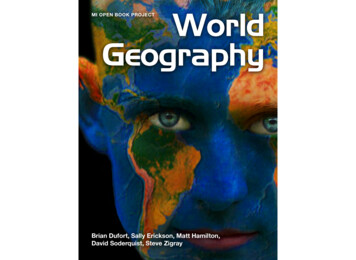
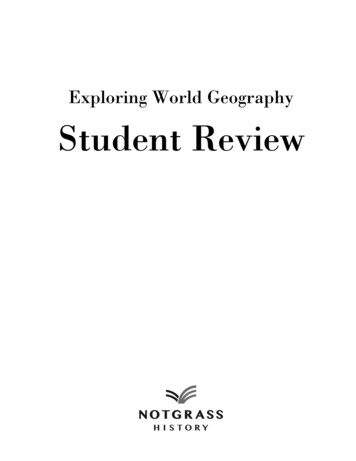
TOPIC 1The atmosphereThe incoming solar energy that reaches the Earth’s surface is called insolation and isunevenly distributed over the Earth. More insolation reaches the surface in the tropicsthan in the polar regions. In the tropics, the Sun’s rays come in nearly perpendicular tothe surface. At the poles the surface is angled away from the incoming rays of the Sun.FIGURE 2 2 Annual insolation and energy loss, showing the energy balance at different latitudesIt is colder near the poles because:The Sun’s rays have to travel through a thicker atmospheric layer and energy is lostthrough absorption, scattering and reflection. The energy of the incoming radiation is spread over a larger area. Shiny white ice and snow reflect more of the incoming energy into space.From Figure 22 we learn that: Between the tropics, the angle of incoming solar rays is high. More energy is gainedthan lost, so it is hotter.OIn the polar regions, the angle of incoming solar rays is low, so solar heating is low.More heat is reflected into space. More energy is lost than gained and there is anenergy deficit.ONear 37 both north and south of the equator, a balance exists between energygained and energy lost.O Via Afrika Publishers » G e o g r a p h y 11 Study Guide eBook23
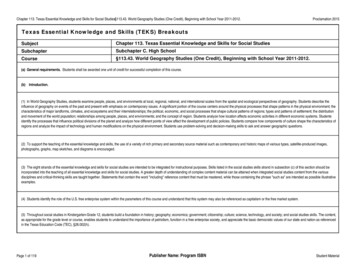
TOPIC 1The atmosphere2The significance of the Earth’s axis and revolutionaround the SunFIGURE 23 The Earth’s axis of rotation is tilted relative to the plane of rotation around the Sun. This has a majoreffect on the seasonal variation in insolation in each hemisphere.2.1What causes the seasons?This is summarised in Table 6 below.TABLE 6 The causes of the seasonsCauseDescriptionRevolutionEarth orbits around the sun once every 365¼ days.RotationEarth turns on its axis once every 24 hours.TiltThe Earth’s axis is tilted 23½ from the perpendicular.SphericityThe nearly spherical shape of the Earth produces uneven insolation.2.2 What are the seasonal effects on the energy balance?FIGURE 24 Annual cycle of the seasons Via Afrika Publishers » G e o g r a p h y 11 Study Guide eBook24
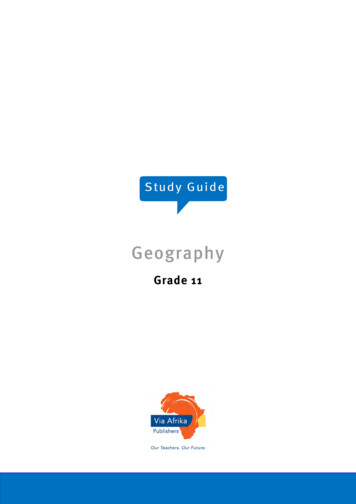
TOPIC 1The atmosphereMore heat is received in summer than in winter. Let us see how this happens: Earth’s axis is tilted.It is summer in each hemisphere when that hemisphere is tilted towards the Sunbecause it has longer daytime hours.In winter, when a hemisphere is tilted away from the Sun, it receives and retainsless incoming radiation.Twice a year, at the equinoxes on 21 March and 23 September, the Sun is directlyoverhead the equator and all places on Earth have a 12 hour day and a 12 hour night.Both hemispheres will get equal solar radiation.At the solstice on 21 June, the northern hemisphere is tilted towards the Sun. Thelonger days and shorter nights cause the northern hemisphere to receive moreinsolation and to experience summer. The southern hemisphere is tilted away fromthe Sun. This causes shorter days and longer nights. There are winter conditions.On December 21 the reverse happens with long days, short nights and summer inthe southern hemisphere. The northern hemisphere has long nights, short days andwinter.3The role of ocean currents and winds in the transfer ofenergyThere is a positive heat balance within the tropics, and a negative heat balance in thepolar regions. But the Earth does not steadily get hotter at the tropics or colder at thepoles. There is a balance between incoming solar radiation and outgoing radiation fromthe Earth. This happens through two major transfers of heat, 80% by wind and 20% bywater.3.1How do winds contribute to heat transfer?The uneven heating of the Earth causes pressure differences because warm air is lessdense and tends to rise. This difference creates a pressure gradient force and causeswind to blow from regions of high pressure (HP) to regions of low pressure (LP).Imagine an Earth with no features that does not turn. This is illustrated in Figure 25.Under such circumstances a belt of low pressure forms in the hot equatorial regionswhile a belt of high pressure forms over the cold polar areas. Via Afrika Publishers » G e o g r a p h y 11 Study Guide eBook25
TOPIC 1The atmosphereFIGURE 25 A simple global atmospheric circulation model of a non-rotating EarthThe pressure difference causes cold, dry winds to flow from the polar high pressureto the equatorial low pressure. At the equator, warm moist air rises. This warm air diverges in the upperatmosphere and flows towards the poles. Over the polar regions, the air cools, becomes more dense, and sinks down backtowards the surface. But the Earth does have features of land and sea and it does turn around on its axisso there is not a steady flow o
This guide must be used in conjunction with the main textbook, as it is a summary of the main components of the textbook. Geography, like any other subject, does contain facts which must be understood and learnt, but it also emphasises skills. It is necessary for the learner to analyse