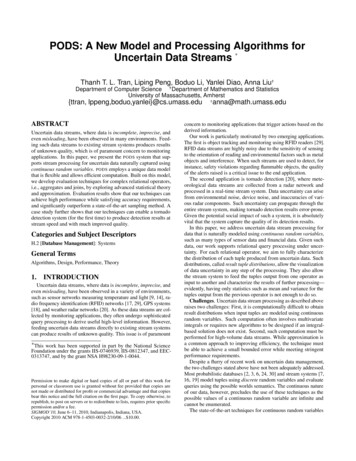
Transcription
PODS Data ManagementRisk Modeling Working GroupRon BrushMarch 7, 2017
DataRiskAssessment2
AgendaBackgroundCurrent StateOpportunities for Improvement
Where We’ve Been1980’s1990’sLate 1990’sEarly 2000’s2010 - TodayCAD replaces draftingEmerging GIS, Computer maps,Alignment sheets (replaces manual CAD)PODS model, Early risk modelsEnterprise, Liquid HCAs, Gas HCAs, Hydraulicanalysis, Gathering networksWeb 2.0, Mobile, GIS pervasive4
Sample Alignment Sheet5
6
Benefits of PODSData QualityData Analytics & ReportingLinear Referencingfor All FeaturesMAOP Validation CalculatorsMaterial, Risk, Compliance,& Operational DataData AccessibilityCustom Sheet GeneratorsMultiple Enhanced GISImplementation OptionsIntegration with SAP &MaximoPODS GISRisk and IntegrityAnalysis ToolsHCA & ClassLocation CalculatorsComplianceReportingOperational IntegrationDigital ConstructionAs-BuiltMobile PaperlessMaintenance Integration7
Win-Win Value of Standard Data Models More operators more vendor supportIncorporate best/proven practicesLower cost to implement and supportMore software/service provider optionsContinuously improvingTrained talent poolCompromise: slower pace and consensus8
Facets of Pipeline Data ManagementFeature Abstractionm Linear Referenced Centerline.02Data GranularityData IntegrityModeling Facilities9
Feature Abstraction Linear EventsPipe SegmentCasingCoatingILI Inspection RangeClass LocationHCA Could-AffectMAOP/MOPTest Pressure Point EventsValveCrossingDepth of CoverILI Feature/AnomalyGirth Weld10
Abstraction Example: Valves Opportunities:1. Model the features that are needed2. Ensure attributes are right and clearly definedTypical 3.abstraction:Correct data types Point feature (no length)No flangesNo blow-offsNo fenceMay not show above groundEvent IDValve IdentifierNameOutside Diameter Inlet CLOutside Diameter Outlet CLType CLSerial NumberModelManufacturer CLDate ManufacturedSpecification CLMill Test PressureNominal Pressure RatingNominal Pressure Rating InletNominal Pressure Rating OutletDate InstalledFunction CLJoint Type CLMaterial CLDescriptionSource CLCommentsValveNUMBER(16) pk,fk1 VARCHAR2(16)VARCHAR2(50)NUMBER(8,4) fk9 NUMBER(8,4) fk10 VARCHAR2(16) fk4 VARCHAR2(32)VARCHAR2(32)VARCHAR2(16) fk2 DATEVARCHAR2(16) fk3 6) fk7 VARCHAR2(16) fk6 VARCHAR2(16) fk8 VARCHAR2(50)VARCHAR2(16) fk5 VARCHAR2(255)not nullnot nullnullnot nullnot llnullnullnullnullnull11
Linear Referencing System (LRS)(Pipe Centerline)M: e quality spatially and linearly1. ImproveLatitude: 40.574026Longitude: -105.084143-105.0818572.Measure:Align9,728’GIS features with ILI dataLongitude:(esp. IMU)Measure: 11,976’M: 10,060’12
How is it Spatial?1Event Feature Class - the Event table has aShape/Geometry field (preferred)2Geometry Join - the Event table is joined toanother table with the Shape/Geometry fieldJoin3Event-based - the Event table is non-spatial, butan application (i.e. ArcMap) is used to view dataas a map on-the-fly13
Pipeline Spatial Data Model Family TreeNowTime2004Standards are like toothbrushes.Everybody wants one but nobodywants to use anybody else’s.-Connie Morella1994Event Feature ClassGeometry JoinEvent Based14
Data GranularityLow Granularity (Common)Pipe SegmentValveBegin0 0012 34End Length (ft)34 563,45612 34-High Granularity (Uncommon)Opportunities:BeginEnd Length (ft)1. Increase data granularityPipe Segment0 00.00 12 33.90 1,234.402. Compare coincidingevents and attributesforAbove Ground12 22.00 12 46.0024.00Blow-off12 32.50 12 32.50consistencyFlangeValvePipe SegmentFlangeBlow-offPipe Segment12 33.9012 34.4012 33.9012 36.2512 38.0012 36.7512 34.4012 36.2512 36.7512 36.7512 38.0034 56.000.501.852.850.502,219.2515
Break Data Apart (Normalize)123Events- Pipe Segment- Coating- Valve- Crossings- Elevation- Line Hierarchy- Region- Division- System- Line NameCore/ CenterlineDomain/ Lookup tables- Diameter- Manufacturer- Grade- 16
Dynamic SegmentationWall ThicknessPipe ENoRoad Proximity 100’Depth of Cover24-36”18-24”One Call Tickets 55-10Yes 50’50-100’36-48”10-2050-100’24-36” 100’36-48” 5Dyn. Seg. Result17
Sample Risk Alignment Sheet18
Data IntegrityReferential integrity is a relational database concept, whichstates that table relationships must always be consistent. Inother words, a foreign key field must agree with the primary keythat is referenced by the foreign key.Domain TablePrimary KeyCompany NameEvent TableManufacturerDiameterUS SteelUS SteelUnknownUnknown Mfg.RepublicRepublic SteelA.O. SmithUnknown18”Republic26”AO Smith0.281”UNK42”0.365”US Steel30”0.406”19
Integrity Enforced in the Database- Enforced by DBMS rules- Cannot be bypassed by applications- Data checked before loadingPipelineGIS“A database should not only store data,but should actively seek to ensure itsquality.”20
Integrity Not Enforced in the Database- Enforced by each application- Can be bypassed by applications- Data checked after loadingPipelineGIS21
Potential Indicators ofData Integrity Issues Easy to load data – few constraints Multiple vendor software tools loading andeditingdataOpportunities:1. Identify areas with likely data integrity issues Low2. in-houseexpertise with GIS technologyIdentify root causesdata miningtechniquesto find dataissues Lack3. ofUserigoroussoftwarevendortesting4. Use all data sources available to correct Lack of quality user training and rigorous useracceptance testing Reliance on QA checks after data is entered22
Modeling FacilitiesTypical abstraction: Polygon feature No buildings Limited pipe, if any Black box23
Facets of Pipeline Data ManagementFeature Abstractionm Linear Referenced Centerline.02Data GranularityData IntegrityModeling Facilities24
AgendaBackgroundCurrent StateOpportunities for Improvement
What does the data about the datatell us? Critical data needed for risk assessment ismissing or unknown A significant amount of data is not availablefor use in analysis A significant amount of data is stored outsideof the GIS and may be difficult to use Some data needs to be intentionally excludedfrom the risk assessment26
Member Feedback: Our Companycurrently utilizes these PODS tables27
Member Feedback: Our Companymaintains data primarily outside of PODS28
Estimated Unknown Pipe Data(Source: statistics from anonymous samples)DiameterWall ThicknessGradeLong. SeamDate InstalledManufacturerRegulated OnlyAll 30-40%50-60%20-30%60-70%* US Gathering and Transmission Pipelines29
Opportunities for Improving Data CP, CIS, and corrosion dataOne call activity dataDepth of cover Crossings SCC susceptibility Incident historyConstruction and manufacturingrecordsValve informationEquipment inspection recordsProcedures and audit informationWeather and outside forcesOperations data – flow rate,product corrosive characteristicsILI – often not integratedRepair dataConsequence factors– Loss of delivery– Revenue loss– Clean-up costs30
Criteria for Including Attributes inAlgorithms Is it useful? (more is not necessarily better)Does enough data exist? How many unknowns?Is the data usable (text field or inconsistent)Can it be integrated? (with LRS or spatial)Is it repeatable next time?Can it be aggregated? (e.g. depth of cover)Is it granular enough or too generalized?Is the attribute compatible with the algorithm?31
AgendaBackgroundCurrent StateOpportunities for Improvement
Enhancing Current PracticesEmerging Opportunities
1“We build fancier and fancier boxes to put the datain, but it doesn’t mean the data gets any better”- Risk Engineer Allocate time/money to fix data when migratingsystems Use migration as a data vetting opportunity34
2Prevent Data LossDuring Asset Sale or Company Sale The NPMS has pipelines with unknown ownership If the buyer and seller have compatible datastructures – minimal data loss when migrated GIS data should be reviewed as part of the duediligence process Seller should ensure that all data is handed-overduring a sale Run asset inventory query before and after transfer– Match pipe inventory footage, equipment count, etc.– Match data quality metrics35
3Prevent Data Loss DuringNew Construction Estimated up to 40% of data is lost after capitalconstruction CAD alignment sheet deliverables – output can bemanipulated – disconnect between raw data and thedrawing deliverable GIS-ready deliverables, not only CAD Better coordination between construction, surveycrew and GIS dept. - standard data dictionaries Better real-time quality metrics (before pipe iscovered)36
4Data Completeness AssessmentBenefits of Data Completeness KPIs Show continuous improvement in data quality overtime [§192.917 (b); §195.452 (j)(2)] Identify incorrect knowledge or lack of knowledgetransfer (“we don’t know what we don’t know”) Opportunity to assign confidence values to dataduring risk assessment37
4Data Completeness AssessmentData Completeness KPI Examples: Percentage of mileage where defaults are used for criticalattributes Centerline accuracy – GPS, ILI IMU, Conventional survey Number of data silos where integration is difficult orimpossible Degree of data integration (e.g. ILI features don’t match GISfeatures) Identified corruption or data integrity problems Quality metrics for acquisition data Quality metrics for construction data38
5Sharing Foreign Line CrossingsWhat if it were possible to securely share limitedinformation between utilities, pipelines, fiber,buried electric, water, sewer, Asset owner name, approximate location,product type, pipe diameter39
Enhancing Current PracticesEmerging Opportunities
3D Connected Facilities Pipelines are typically “coincident” but nothydraulically “connected” in GIS Most pipeline GIS is not truly 3D41
3D Connected Facilities Pipelines connected to stations Hydraulic simulation from the GIS42
Data, Data Everywhere Improved satellite imagery with change detectionDrone-collected 3D surfaces3D Laser scannersHigher resolution ILI dataField sensor data (Internet of Things)Real-time operational SCADA dataSensor data – weather, ground movement, etc.Unstructured data – Twitter, e-mail43
“Big Data”Big data is a term for data sets that are so large orcomplex that traditional data processing applicationsare inadequate to deal with them.- Wikipedia44
Predictive AnalyticsPredictiveAnalyticsGIS DataKnowledgeBig DataNon-LRSSpatialSpatial LRSPublic DataAssetsInspectionsDocumentsSensorData45
Next Generation Data Platform More than GIS; More than a data model Systems Integration Platform– Built-in data integrity and consistency– Data is continuously improving itself– Multi-scale view of data– More granular data abstraction– Integrated facilities We are building the foundation now46
Discussion & Questions
PODS Data ManagementRisk Modeling Working GroupRon BrushMarch 7, 2017
PODS Data Management Risk Modeling Working Group Ron Brush March 7, 2017. Data Risk Assessment 2. Agenda Background Current State Opportunities for Improvement . Alignment sheets (replaces manual CAD) Late 1990’s PODS model, Early risk models Early 2000’s Enterprise, Liquid HCAs,