Transcription
2020AnnualCompensationReportFiscal Year 2020State of Oklahoma
Annual Compensation ReportFiscal Year 2020Office of Management and Enterprise ServicesSteven Harpe, DirectorJake Smith, Human Capital Management AdministratorMedia Inquiries:Bonnie Campo, Public Information Manager405-365-9023This publication is issued by the Office of Management and Enterprise Services as authorized by Title 62, Section34. Copies have not been printed but are available through the agency website. This work is licensed under aCreative Attribution-NonCommercial-NoDerivs 3.0 Unported License.1
Table of ContentsEXECUTIVE SUMMARY . 3INTRODUCTION .3AVERAGE SALARY COMPARISON (DIRECT COMPENSATION) .3Table 1: Employee Benchmark Average Salary Comparison – State of Oklahoma vs. Market .3BENEFITS COMPARISON (INDIRECT COMPENSATION).3Table 2: Average Total Compensation Costs (Salary and Benefits).3CLASSIFIED EMPLOYEE TURNOVER .4Table 3: Classified Employee Turnover Rates FY 2000-2020 .4RECOMMENDATIONS . 6Compensation .6INTRODUCTION . 7STATUTORY REQUIREMENT .7PURPOSE AND SCOPE OF COMPENSATION REPORT .7Economic indicators .8METHODOLOGY . 8MARKET SURVEYS.8MARKET PRICING APPROACH .9BENEFITS .9EMPLOYEE TURNOVER .9ANALYSIS . 11CLASSIFIED EMPLOYEE BENCHMARK JOB AVERAGE SALARY COMPARISON.11Table 4: Employee Average Salary Comparison .11Table 5: Market Comparison Trend (2005-2020) .11Table 6: Oklahoma General Pay Increase History .12CLASSIFIED PAY BANDS .13Table 7: Pay Band Compa-Ratio.14PAY BAND CHANGES.15AGENCY DIRECTOR SALARY STRUCTURE .15BENEFITS ANALYSIS .15State benefits package .15Market benefits package .16Table 8: Vacation Days/Annual Leave .16BENEFITS COMPARISON (INDIRECT COMPENSATION) .17Table 9: Average Employee Benefits Cost Comparison .17Employer contribution.18TOTAL COMPENSATION COST .19Table 10: Average Total Compensation Costs (Salary and Benefits).19TURNOVER ANALYSIS .19Table 11: FY 2020 State Classified Employee Turnover .19Table 12: FY 2020 Turnover Cost.20RECOMMENDATIONS . 21Compensation .212
Executive SummaryIntroductionThe Annual Compensation Report provides an analysis of the rates of pay in the competitive labormarket and compares these rates with the state's current Merit System salary practices for classifiedemployees. The report also provides an analysis of the fringe benefits, or non-cash compensationprograms found in the market, and compares these programs with the state’s fringe benefits package.Average salary comparison (direct compensation)An analysis of salary survey data for 291 benchmark jobs indicates that, on average, classified employeesalaries are 11.11% below the competitive labor market. The 291 benchmarks represent 11,455employees, or 58% of classified state employees. Table 1 shows the average annual salary comparisonbetween the state and the market for benchmark jobs surveyed.Table 1: Employee Benchmark Average Salary Comparison – State of Oklahoma vs. MarketBenefitState of Oklahomacontribution 1MarketcontributionPercent above/belowmarketAverage salaries 50,051 56,308-11.11%Benefits comparison (indirect compensation)The State of Oklahoma offers a comprehensive employee benefits package. Table 2 illustrates theemployer contributions to the state’s benefits package compared to those of the external labor market.The costs in the table indicate the employers’ contributions in relation to the respective average basesalary. A detailed breakdown of benefits costs and comparisons to the labor market is contained in theanalysis section of the report.Table 2: Average Total Compensation Costs (Salary and Benefits)BenefitsState of OklahomaMarketAverage salaryTotal benefits costAverage total compensation cost 50,051 29,371 79,422 56,308 33,706 %A benefits cost comparison does not provide analysis of perceived value to employees nor benefitscompetitiveness to the market. Cost comparison reflects the financial cost the state pays for benefits1Includes average longevity payment for each benchmark.3
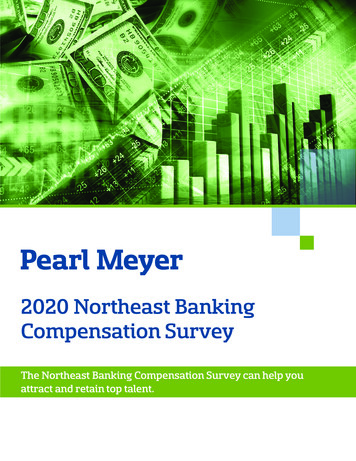
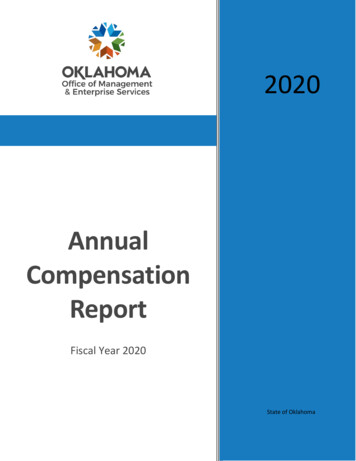
compared to the cost of the same types of benefits the market provides, and does not provide a truerepresentation of market competitiveness of the state benefits package.Classified employee turnoverThe overall turnover rate among classified employees in FY 2020 was 15.71%, and the voluntary ratewas 12.80%. The overall turnover rate includes resignations, retirements, discharges and deaths thatoccurred in FY 2020, while the voluntary rate includes resignations and retirements only. Both theoverall turnover rate and the voluntary turnover rate decreased from the previous fiscal year.Table 3: Classified Employee Turnover Rates FY ry turnover 9.60%10.30%11.40%12.10%Overall turnover 11.20%11.80%12.70%13.50%4
Figure 1: Classified Employee Turnover Rates FY 2000 l Turnover Rate20122014201620182020Voluntary Turnover RateNote: The 2013 Total Remuneration Study replaced the Annual Compensation Report in 2013, so there is no 2013turnover data.5
RecommendationsCompensationResults of the 2020 Annual Compensation Report indicate that the state’s classified pay rates are 11.11%below the market pay rates for comparable benchmark jobs, which is an improvement of the state’ssalary position to the market last year. Also, both voluntary and involuntary turnover percentages thisyear are lower than last year’s figures.The state’s classified pay rates still lag behind the market by 11.11%.On July 1, 2018, OMES moved the minimums, midpoints and maximums of the classified pay grades 5%.Foreseeing the financial hardship it would have provided for many agencies, OMES did not move theminimums of the classified pay bands in July 2019. However, the classified pay grades should beconsidered for an increased 5%. Legislative increases given in July of 2018 and 2019 contributed in thecompression between the pay grades in grades B through H. Although the pay grades were adjusted July1, 2018, the adjustment was not enough to counter the lack of adjustments for the previous three yearsalong with the legislative increases granted in 2018 and 2019. The cost to move the entire classified paystructure 5% is 443,830.OMES Human Capital Management can work with the Legislature to appropriate funds so that OMEScan move the entire classified pay structure 5%.6
IntroductionStatutory requirementTitle 74 O.S. § 840:1.6A (5) provides that the administrator of the Office of Management and EnterpriseServices shall “conduct an analysis of the rates of pay prevailing in the state within the public andprivate sectors for comparable jobs and report the findings to the Governor, the President Pro Temporeof the Senate, and the Speaker of the House of Representatives no later than December 1 of each year.Such analysis shall include all forms of compensation including fringe benefits. Information solicited bythe Office of Management and Enterprise Services from public and private sector employers for suchanalysis, including but not limited to salaries, benefits, and compensation policies and procedures, shallbe confidential and shall not be subject to disclosure under the Oklahoma Open Records Act.”The Office of Management and Enterprise Services 2020 Annual Compensation Report meets thisstatutory requirement. The report provides an analysis of the rates of pay in the competitive labormarket and compares these rates with the state's current Merit System salary practices for classifiedemployees. The report also provides an analysis of the fringe benefits, or non-cash compensationprograms found in the market, and it compares these programs with the state’s fringe benefits package.Reporting of this data is relevant to an analysis of the competitive market position of the state’sclassified workforce. Moreover, including this analysis from year to year enables trending of data andthe identification of areas of concern.Purpose and scope of compensation reportThis report is directed to the market data gathered and the analysis of that data. The survey resultsshow how the State of Oklahoma Merit System pay practices for classified jobs, which representapproximately 61.23% of all state employees, compared with the relevant labor market. Survey sourcesused for this year’s salary and benefits analysis are: 2020 National Compensation Association of State Governments Salary Report (data from statessurrounding Oklahoma). 2020 Oklahoma Hospital Association Survey. The Kaiser Foundation Employer Health Benefits 2020 Annual Survey. Payfactors Compensation Data Management Software.7
Economic indicatorsAs of November 2020, the unemployment rate in the United States was 6.7%, 3.1% more thanNovember 2019, according to the U.S. Department of ay increase budgets with U.S. employers are at 2.9% for 2020, according to the WorldatWork SalaryBudget Survey. That is 0.3% lower than in 2019, and respondents are projecting no changes for the 2021salary increase and-surveys/sbs/SBS2020-21 TopLevelData.pdfFrom the information provided by the Oklahoma Employment Security Commission, as of May 2020,unemployment in Oklahoma is at 12.6%. The state’s seasonally adjusted unemployment rate was up by9.4% compared to May MethodologyMarket surveysState of Oklahoma employees work in a broad range of occupations. We compete for human resourceswith both public and private sector organizations operating in various industries. Our compensationsurvey analysis focuses on the rates of pay offered by public and private sector organizations operatingwithin our state and on public and private sector organizations in surrounding states. In keeping withthis market philosophy, the following market data sources were used in the salary and benefits analysisin this report.National Compensation Association of State Governments 2020 Salary Report and Benefits Report(data from states surrounding Oklahoma): NCASG annually conducts the National CompensationSurvey, Benefits Survey and the Executive Survey. The consortium is composed of 46 member stateslocated within the United States. For comparative purposes, the State of Oklahoma recognizes onlythose member states that surround our state. There are six surrounding states (Arkansas, Colorado,Kansas, Louisiana, Missouri and New Mexico) that participate in the survey. Additional job matches weremade for 2020.Oklahoma Hospital Association: This salary survey is conducted semiannually by the Oklahoma HospitalAssociation. Surveys are distributed to each of the 135 hospitals in Oklahoma. Additional job matcheswere made for 2020.The Kaiser Foundation Employer Health Benefits 2020 Annual Survey: The Kaiser Family Foundationand the Health Research & Educational Trust conduct an annual survey of employer-sponsored healthbenefits. HRET, a nonprofit research organization, is an affiliate of the American Hospital Association.The Kaiser Family Foundation designs, analyzes and conducts this survey in partnership with HRET andalso funds the study. Kaiser contracts with researchers at National Opinion Research Center at theUniversity of Chicago to work with the Kaiser and HRET researchers in conducting the study.Kaiser/HRET retained National Research LLC, a survey research firm based in Washington, D.C., toconduct telephone interviews with human resource and benefits managers using the Kaiser/HRET8
survey instrument. From January to July 2020, National Research completed full interviews with 1,765firms.Payfactors: This suite of cloud-based compensation data management tools allows the State ofOklahoma to access market data updated monthly, along with benchmarking, job pricing, and reportbuilding functionality. Payfactors enables the streamlining and centralization of compensation analyticsfor the State of Oklahoma. The addition of this software has changed the methodology slightly fromprevious years.Market pricing approachThe market pricing methodology employed in this report is based on the establishment of marketcomposite rates, which are market averages for each benchmark job obtained by blending survey datafrom all available and appropriate survey sources.This methodology is based on generally accepted compensation practices and is recommended byWorldatWork, the leading compensation professional association in the United States, as a means ofestablishing an accurate assessment of pay competitiveness in the labor market.BenefitsState benefits will be compared with the market in the following areas:Paid leave – includes vacation and sick days, paid holidays and other paid time off.Insurance costs – includes health, dental, life, short- and long-term disability or salarycontinuation.Employer retirement contributions – includes employer contributions on behalf of employees’defined-benefit plans and defined-contribution pension plans.Legally required benefits – includes Social Security and Medicare, federal and stateunemployment insurance and workers’ compensation.Employee turnoverEmployee turnover is a measure of separations from an employing organization, usually expressed as aturnover rate. Overall turnover rates are calculated by dividing the total number of separations, bothvoluntary and involuntary, throughout the fiscal year, by the total number of employees at thebeginning of the fiscal year. For the purpose of calculating this rate, separations are defined asdischarges, deaths, resignations and retirements. In addition to the overall turnover rate, it is importantto look specifically at voluntary turnover, which represents the rate at which employees exercise theirfree choice to leave employment. This rate includes only resignations and retirements.The following turnover analyses are included in this year’s report.9
The voluntary turnover cost for the classified state workforce is based on the voluntary separations thatoccurred throughout the fiscal year. The formula used to calculate this cost is based on a conservative,simplified costing model. 2 Below are the steps of the costing model:A. Classified benchmark average salary.B. Percentage of pay for benefits average salary.C. Total employee annual cost (A B).D. Determine the number of employees who voluntarily resigned within the previous fiscal year.E. The time an employee becomes fully productive (typically 12 months).F. Per-person turnover cost ([E 12] C 50%). 3G. Annual turnover cost for the state (F D
Such analysis shall include all forms of compensation including fringe benefits. Information solicited by the Office of Management and Enterprise Services from public and private sector employers for such analysis, including but not limited to salaries, benefits, and