Transcription
M. Grootjen, M.A. Neerincx, J.C.M. van Weert, "Task Based Interpretation of Operator State Informationfor Adaptive Support”, ACI/HFES 2006, San Francisco.Task Based Interpretation of Operator State Informationfor Adaptive Supporta,bM. GrootjenMarc@Grootjen.nlab,cM.A. NeerincxMark.Neerincx@tno.nlbJ.C.M. van WeertJ.C.M.v.Weert@student.tue.nlDefense Materiel Organization, Directorate Materiel Royal Netherlands Navy, Dep. of Naval Architecture andMarine Engineering, P.O. Box 20702, 2500 ES The Hague, The NetherlandsbTechnical University of Delft, P.O. Box 5031, 2628 CD Delft, the NetherlandscTNO Human Factors, Kampweg 5, P.O. Box 23, 3769 ZG Soesterberg, the NetherlandsAbstractIn the last 2 decades, the application of new technologies in process control caused a radical change in the role ofthe operator. To cope with these changes, the operator needs personalized support that can vary over time. Torealize this support, we present the design and first testing of a framework for adaptive support. First an analysiswas done which data is necessary for the framework. After selection, data was collected during an experiment.Based on this data a software tool was designed to visualize task load of operators over time. Evaluation of the toolshows that combination of cognitive task load, effort and performance gives insight into the task load of an operatorover time. Furthermore, it enables generation of critical and optimal task load work area’s. Further implementationof the framework needs to be done to generate a real time adaptation plan.1INTRODUCTIONIn the last 2 decades, major changes in information technology have taken place. In process control, the ongoingautomation and the application of new technologies caused a radical change in the position of the operator. Thisposition shifted from monitoring and control to supervision. During multiple seminars and projects we identified 6main topics:1.Changing of information type and volume. The operator has to handle large amounts of digitalinformation, varying between sensor values and ‘higher level’ information, often used together. Highlydynamic systems cause enormous fluctuations in information volume.2.Task integration. The integration of tasks from different domains (e.g. navigation and propulsion)increases.3.Increasing autonomy. Autonomous systems may cause ‘out of the loop’ problems for an operator.4.Increasing complexity. Systems and their dependencies become more and more complex.5.Decreasing personnel and training budgets. The pressure to work with the lowest possible costs and thehighest possible efficiency asks for an optimal distribution of personnel and intuitive systems.6.Increasing legislative constraints. The increasing number of laws (Teltzrow & Kobsa, 2004) puts extraconstraints on the system design.To deal with the mentioned problems, the operator needs specifically personalized support which can differ in time(Neerincx et al., 2005). This paper describes the design (section 2) and first testing (section 3) of a high levelframework for adaptive support. Finally, section 4 presents conclusion and discussion.
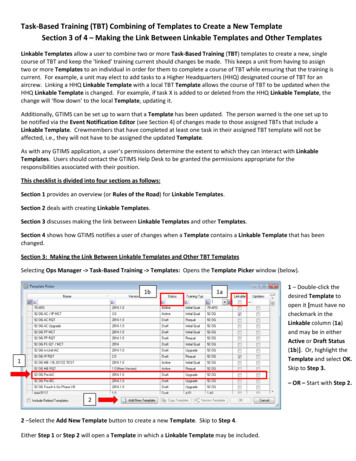
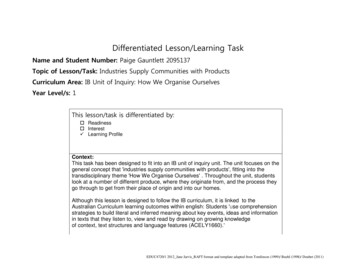
2FRAMEWORK FOR ADAPTIVE SUPPORTOur goal is to develop a user friendly, efficient and effective system which adapts to the situation and the operator. Itshould accommodate the user with the right task support at the right time. Consequently we have to know how andwhen this system should be adjusted. For this we need information about user’s momentary processing capacitiesand a mechanism that transforms this information into a plan for employing these capacities effectively andefficiently. This plan should describe when and how to adapt the system, and to dynamically allocate tasks betweenthe actors. We define this plan here as the work plan, the mechanism that generates this work plan the dynamic taskallocator or shortly allocator, the sources of information are models and the mechanisms that produce the models byfiltering and collecting information from the environment are modeling components. For generation of this workplan, we designed a framework. First step in the design of this framework is the identification of the models weneed. Literature shows a large variety of models, for example Schneider-Hufschmidt et. al (1993) describe astructural model of the interface composed of about 13 elementary models which focus on the various functionalaspects relevant to adaptive interaction. Of course, if the amount of models is increased, the information will bemore precise. However, the complexity of the system will also increase enormously. If we want to keep the systemcontrollable, we should minimize the number of models. Based on our goal, we need at least the following models(figure 1):1. operator model (or user model)2. task model3. system model4. context model (or domain model)Figure 1. Information from the environment is used to produce four models. Accordingly, the allocator generates aneffective and efficient work plan.Operator model. An essential source of information for the allocator is the operator model. In order to adapt thesystem to the characteristics of the operator, the operator model can contain a large variety of information: To collect task data, experts performed a video analysis afterwards using the Observer XT (Noldus, 2006).At the moment we are testing the use of logfiles and gaze tracking to collect task information. Real-time taskload measures (see allocator). Profile parameters; routine on the job (Benyon & Murray, 1988), spatial abilities, memory span (Neerincxet al., 2005), education & characteristic knowledge, preferences, generic role in environment. Physiological measures. Performance; reaction time, time pressure, correct handling. Subjective effort; Behavioral variables; eye tracker, gaze tracker.Task model. The task model should contain information about the possible tasks for an operator. It should be notedthat this information represents task demands that affect human operator performance and effort (i.e. it is not adefinition of the operator cognitive state). We see the task model as some kind of static representation expressing all
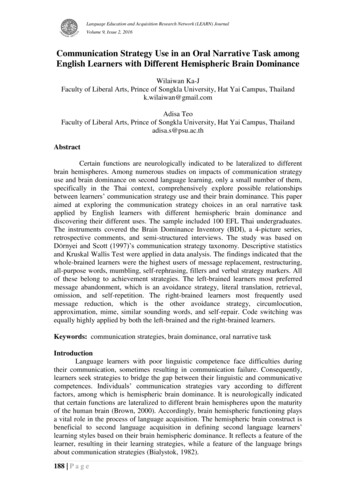
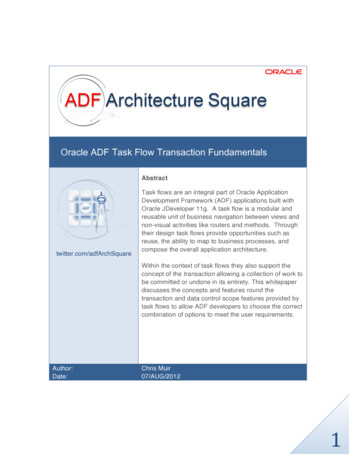
possible tasks that can be executed (Neerincx, 2003). The effects these tasks have on the operator belong to theoperator model.System model. In order to support a user, a system needs to have information about itself available. Consequently,the system model contains technical information about the different system components (e.g. layout, softwareapplications and dependencies). Special cases of system models are for example application models and dialogue(interaction) models (Brown et al., 1990).Context model. The context model (or domain model) contains relatively static, high level information of theoperational unit and its environment (e.g. the readiness state of a combat unit).Allocator. Neerincx (2003) developed a model for Cognitive Task Load (CTL) which is very useful for the allocator.The CTL model (figure 2) distinguishes three load factors that have a substantial effect on task performance andmental effort. The first load factor is the classical factor percentage time occupied (%TO). The second load factor isthe level of information processing (LIP) (cf. Rasmussen, 1986). To address the demands of attention shifts, thecognitive load model distinguishes task-set switching (TSS) as a third load factor.Figure 2. Dimensions of the CTL model (Neerincx, 2003) (see text for explanation).Figure 2 presents a 3-dimensional ‘load’ space in which human activities can be projected with regions indicatingthe cognitive demands that the activity imposes on the operator. In the middle area, CTL matches the operator’smental capacity. At angular point 8 CTL is high and an overload situation occurs. Angular point 1 represents thearea in which CTL is not optimal due to underload. When TO is high, and LIP and TSS are low, vigilance problemscan appear (angular point 2) (Parasuraman, 1986). When TO and TSS are high, lock-up can appear (Boehne &Paese, 2000).With information of the different models, the allocator should be able to generate ‘CTL space’, determine thecurrent and future working point for a specific operator and generate a work plan. The next section will focus on theselection of data for the operator and task model and the generation of CTL space.3.SELECTING, MEASURING AND PROCESSING OF DATABased on a literature review and empirical studies (table 1 and Grootjen et al., in press; Grootjen et al., 2006), weselected different types of data that should feed into the task and operator models. In recent experiments, wesubsequently investigated and applied different technologies for recording this data and analyses of these data. Foranalysis, two different tools were used: the Observer XT (Noldus, 2006) and SOWAT (Ship Operator WorkloadAssessment Tool). SOWAT should enable an offline generation of CTL space and an online generation of theoperators path through this space. Explanation of the Observer XT software is out of the scope of this paper.3.1Selecting Effort ParametersDuring the first experiments we concentrated on the collection of performance, effort and task data. With acombination of this data we should be able to determine the position of the mentioned regions in CTL space. Effortdata can be collected with use of subjective or physiological measurements. Research has shown that it is very hardto find an unique measure that can be directly interpreted as a effort indicator (Veltman, et al., 1996; Wilson, 2001;Wilson et al., 2003; Miyake, 2000). Moreover, different measures provide insight in different aspects of effort, e.g.eye blink rate variations can correspond specifically with visual demands (Wilson, 2001) (Wilson et al., 2003). We
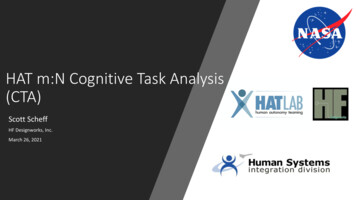
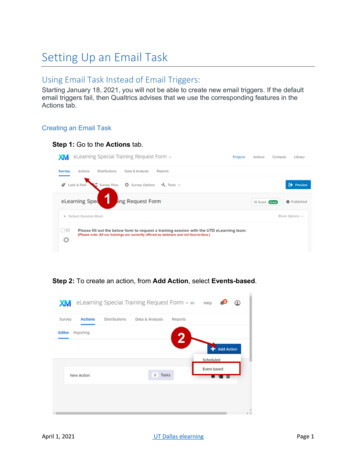
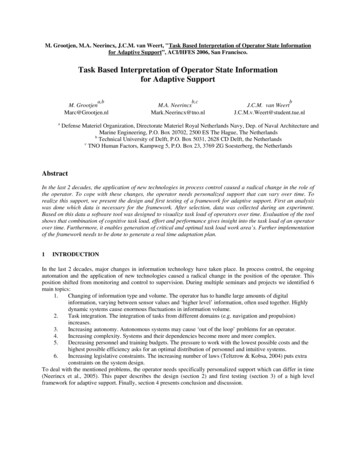
decided to use a mixture of subjective and physiological measurements for effort. To determine what measurementsare suitable for us, we rated available measurements on three criteria:1. Sensitivity to workload changes.2. Obtrusiveness for the operator.3. Availability of the equipment.Table 1 shows the rating results. Used literature is shown in the in the last column of the table.Table 1. Overview of effort parameters with rating from -2 (bad/low) to 2 (good/high)MeasurementHeart iratory20yesBlinking, EOG12yesGaze tracking02yesPupil dilation22yesVoice stress02noFacial expression-12noFace warmth01yesBrain activity (EEG)2-2yesBlood pressure01yesSkin conductivity00yesGesture recognition-22noMuscles (Lundberg, U. et al. 1994)10yesCortisol (saliva)-1-2noNASA-TLX2-2yesSelf Assessment Manikin (SAM)-1-1yesWorkload Watch20yesRating Scale Mental Effort (RSME)20yesContinuous memory task (CMT)2-2yes3.2LiteratureVeltman & Gaillard, 1996; Veltman &Gaillard, 1998; Wilson, 2001; Wilson &Russel, 2003; Miyake, 2000Veltman et al., 1998; Wientjes, 1992Veltman et al., 1998; Wilson et al., 2003Marshall et al., 2003; Zhai et al., 1999Marshall, 2002Rothkrantz, et al., 2004Kuilenburg, et al., 2005Veltman & Vos, 2005Wilson, 2001; Prinzel et al., 1999Veltman, et al., 1996; Miyake, 2000Haag et al., 2004Ehlert,2003Lundberg et al., 1994Veltman et al., 1996; Lundberg et al., 1994Hart & Staveland, 1988Bradley & Lang, 1994Boer, 1997; Likert, 1932Zijlstra, 1993Veltman et al., 1996Measuring DataData was collected during an experiment called OLA 2 (Operator Load Assessment 2). OLA 2 was done to evaluatethe ship control centre of the air defense and command frigate. Three scenarios, designed using the CTL method(Neerincx, 2003), were executed by a total of 12 teams divided over three different frigates. The experiment tookplace at sea, the problems were simulated but all actions had to be operated on the actual systems. During theexperiment physiological data was recorded using Mobi8 (heart and respiratory measures, TMS International, 2005)and Tobii (eyeblinks and pupil dilation, Tobii Technology AB, 2006). During video analysis, subjective effort andcomplexity was measured using a workload watch (Boer, 1997) (i.e. a device that beeps on predefined moments andasks for subjective input). Performance and task data was available after video analysis of experts.3.3Visualization of DataThe previous sections described which information we selected for the models from figure 1. Now we should definehow this information can be used by the allocator to create a work plan. To visualize the information we developedSOWAT (figure 3). Each numbered area will be explained below:1.Selection area. In this area a start and stop time of the data that has to be visualized can be selected.Below the end time, the amount of cube points determines the number of CTL points (i.e. the intervaltime for each CTL calculation). The LIP variable can be calculated in three ways, which can be selectedat the drop down menu ‘LIP source’. First option is the use of subjective ratings, where the subjectivecomplexity ratings from the workload watch are used as LIP values. Second option is the use of expertLIP ratings, which were defined in advance for each action by experts, using the decision tree for LIP(Neerincx & Lindenberg, 1999). Third option is to use an average of those two ratings. For the operator
2.3.4.5.skill level the user can choose ‘beginner’, ‘intermediate’ and ‘expert’, which is of influence on the expertLIP ratings.Presentation area. After data selection and pressing the plot button, all figures will be shown in thepresentation area. First the CTL cube and projections of the three sides of the cube are plotted. On theright side of the area, additional plots from all recorded variables against time are shown using tab pages.Possible variables are: TO, LIP, TSS, WLW, subjective effort and complexity, expert rating, heart rate,upper/lower respiratory values, pupil size.CTL table area. In the lower left corner, a table is displayed containing the values of all variables for eachcube point. Selecting a point in this table will highlight the accompanying point in each figure in thepresentation area.Configuration area. At the left part of this area the coloring of points can be configured. Next to this, thecoloring thresholds (subjective effort and expert ratings) can be set. There are three colors, green (loweffort or high performance), orange (medium effort or performance) and red (high effort or lowperformance).Export area. After pressing one of the export buttons, all plotted data including a large variety of otherdata (e.g. average LIP and total TSS over all data) will be saved in text and jpg files.Figure 3. Ship Operator Workload Assessment Tool (SOWAT). A first construction of CTL area’s is made.3.4Interpretation of ResultsThe results visualized with SOWAT can be used in two ways. The first way is an ‘online’ interpretation of anoperators CTL in time. A line between the CTL points can be turned on, presenting the chronological path of anoperator in CTL space. Also the gradient coloring, which can be turned on in the configuration area, indicates anoperators path in time through the cube. It is preferred for the overview to keep the amount of CTL points low. Thesecond way is an ‘offline’ interpretation of data to construct the CTL area’s of figure 2. Using a higher number ofCTL points directly shows the critical area’s in CTL space for an operator, for example in figure 3. Depending onoperator profile parameters (operator model, figure 1), critical area’s can be determined for specific groups ofoperators.
4CONCLUSION AND DISCUSSIONThe increase in automation in process control emerged a strong need for a user friendly, efficient and effectivesystem which accommodates the user with the right task support at the right time. This paper shows the design andfirst application of a framework for adaptive support which results in the following conclusion:Combination of CTL, effort and performance information gives great insight in the state of the operator. With use ofSOWAT, data can be processed and visualized using video observations, subjective user input and objectivephysiological and performance data. Specifically, two main applications can be distinguished:1. An offline analysis of data with SOWAT enables a generation of optimal and critical area’s in CTL space2. An online analysis by SOWAT enables generation of the operators path through CTL spaceFuture research will focus on the usage of offline and online analysis to generate a work plan. Main topics duringthis research will be: 5.Specification of system and context model.Implementation of operator classes using profile parameters.Further specification of the operator model. This paper presented a literature review of possibleinformation for the operator model. However, an evaluation of chosen measurements should still bedone. Depending on this evaluation other measurements could be added.Integration of effort and performance data into one or two variables. Current visualization shows allvariables in separate figures, however, combination into more generic variables makes it easier tointerpret the data.To collect task data, experts performed a video analysis afterwards using the Observer XT. At themoment we are testing the use of logfiles and gaze tracking to collect task information.In the development of an adaptive support system, we need an real time framework. The work plan needsto be generated using real time information which can be used to keep the operator out of critical area’s.At the moment analyzing is only possible afterwards.When a work plan can be generated another important question needs to be answered. Who should makethe decision for dynamic task allocation? The decision can be made by automation, the operator or by amix of both. Even another operator (e.g. a superior) can be involved and make the decision.REFERENCESBenyon, D. & Murray, D. 1988. Experience with adaptive interfaces. The Computer Journal, 31.Boehne, D. M. and Paese, P. W. 2000. Deciding whether to complete or terminate an unfinished project: A strongtest of the project completion hypothesis. Organizational Behavior and Human Decision Processes 2, 178-194.Boer, L. C. Workload-watch as an element of human engineering testing and evaluation.Bradley, M. M. and Lang, P. J. Measuring emotion: The self-assessment manikin and the sematic differential.Journal of behavioural Therapy & Experimental Psychiatry 25[1], 49-59. 1994. Elsevier Science Ltd.Brown, D., Totterdell, P., & Nonnan, M. 1990. Adaptive user interfaces. London: Academic Press.Ehlert, P. 2003. Intelligent User Interfaces. Report Technical University Delft.Grootjen, M, Bierman, E. P. B., and Neerincx, M. A. 2006. Optimizing cognitive task load in naval ship controlcentres: Design of an adaptive interface. IEA 16th World Congress on Ergonomics.Grootjen, M, Neerincx, M. A., and Veltman, J. A. in press. Cognitive Task Load in a Naval Ship Control Centre.Ergonomics.Haag, A., Goronzy, S., Schaich, P., and Williams, J. 2004. Emotion Recognition Using Bio-Sensors: First StepsTowards an Automatic System.Hart, S. G. & Staveland, L. E. 1988. Development of NASA-TLX (Task Load Index): Results of Empirical andTheoretical Research. Human Mental Workload.Kuilenburg, H. van, Wiering, M., and Uyl, M. J. den. 2005. A Model Based Method for Automatic FacialExpression Recognition. 16th European Conference on Machine Learning.Likert, R. 1932. A technique for the measurement of attitudes. Archive of Psychology.Lundberg, U., Kadefors, R., Melin, B., Palmerud, G., Hassmen, P., Engstrom, M., & Dohns, I. 1994.Psychophysiological stress and EMG activity of the Trapezius muscle. International Journal of BehavioralMedicine.
Marshall, S. P. 2002. The index of Cognitive Activity: Measuring Cognitive Workload.Marshall, S. P, Pleydell-Pearce, C. W., and Dickson, B. T. 2003. Integrating PsychoPhysiological Measures ofCognitive Workload and Eye Movements to Detect Strategy Shifts.Miyake, S. 2000. Multivariate workload evaluation combining physiological and subjective mea
Behavioral variables; eye tracker, gaze tracker. Task model. The task model should contain information about the possible tasks for an operator. It should be noted that this information represents task demands that affect human operator performance Cited by: 19Publish Year: 2006Author: M. Gro