Transcription
Fertilizer Calculator for Ohio‐User GuideVersion 2020A Microsoft Excel spreadsheet has been developed to support nutrient management educationprograms provided by Ohio State University Extension and for users who want to generate their ownrecommendation or compare recommendations provided to them to the Tri‐State FertilizerRecommendations for Corn, Soybeans, Wheat, and Alfalfa, 2020. The spreadsheet is designed to becompatible with Excel version, Excel 1997‐2003 or later.The tool generates recommendations for the following at (Grain Only)Wheat (Grain & Straw)AlfalfaGrass HayGrass/Legume HayOverview of spreadsheet features: There are 21 data lines that could be 21 fields or 21 zones within a field.The soil test data can be entered by cut/paste from another spreadsheet into the appropriatecolumns or type entered.Crop and yield can be copied down the column after the first entry.The user can select by field/data line if they want build/maintenance or maintenance onlyphosphorus (P) & potassium (K) recommendations.User can select when a field has planned long‐term wheat, alfalfa, or grass legume hay to usethe critical level values for these crops to generate P recommendations.Can select a shorter or longer buildup period than standard 4 year for P & K.P & K recommendations are displayed with buildup and maintenance requirements separately.Total fertility need can be determined for a 1‐, 2‐ or 3‐year application on P & KRecommendation page.Lime recommendations are developed from target final soil pH and tillage depth.User can compare cost of two lime sources on lime recommendation page.User can determine total cost of P & K fertilizer needed to meet the nutrient recommendation.User can determine total cost of Lime needed in the recommendation developed.The spreadsheet is available for downloaded atorver2020xlsFor questions and comments to improve contact Greg LaBarge, Ohio State University Extension, FieldSpecialist, Agronomic Systems, labarge.1@osu.eduAugust 20201
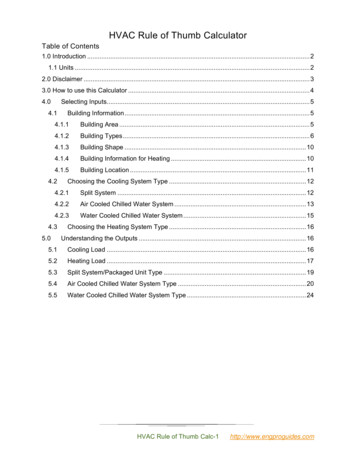
1) Once downloaded, open the spreadsheet in Microsoft Excel or compatible program. Thespreadsheet contains Macros that must be enable when the file is opened. Click on EnableContent to use macros.2) The file will open to the Home Page which will guide you to data entry, report sheets and printfunctions.3) Entry of background data needed to calculate recommendations are made through two pagesaccessed by clicking on the red button with a pencil icon.Click on Field Name and Soil Test Data to enter data on fieldsfrom include in laboratory reports.August 20202
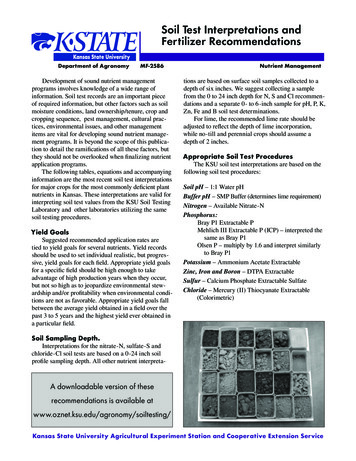
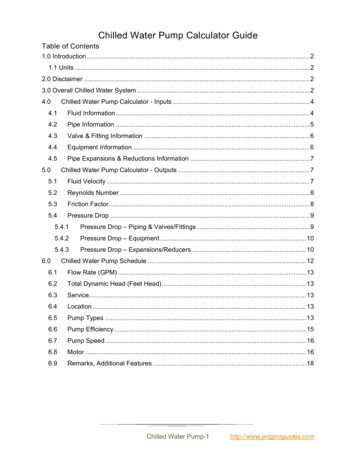
4) First select the units used on the soil test report either “PPM” or “lbs/A”. The red highlightedbox is a pull‐down menu. For phosphorus (P) select the extractant being reported either”Mehlich 3” or “Bray P1”. Complete the fields with field identification information, if subsampleswere taken for the field use the Subfield Id to name grids or zone then input acres for the areasampled. Soil test values from the lab report ae now entered. If a spreadsheet file of results wasprovided by the lab, the user can copy values from lab report columns and paste into theFertilizer Calculator for Ohio tool. Once transferred be sure to check that field names and resultsline up and were not shifted.5) Once soil test data entry is complete scroll to top of page and click on Return to Home Page.6) Access the second page of data entry as noted below.Click on Yield, Rotation, Management Preferencesto enter data on fields from include in laboratory reports.August 20203
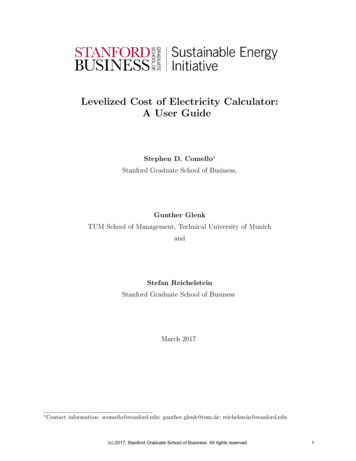
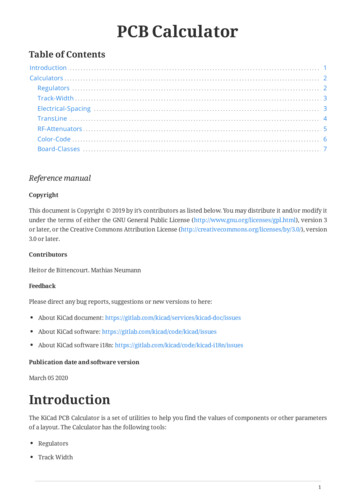
7) The recommendations page gives the user the opportunity to make management decisions thatwill influence phosphorus, potassium, and lime recommendations. Selection maybe influencedby owned versus rented land, long term rotation plans and current fertilizer economics.The questions to answer are noted with the red/pink boxes and include:a. Year ‐ Enter the start year for recommendations.b. Is wheat, alfalfa or grass/legume hay regularly planted in this field?“Yes” or “No” can be selected through a down arrow when theentry box is selected. If answered “Yes” the higher Critical Level of30 PPM phosphorus is used to generate recommendations forbuildup. If “No” is selected a Critical Level of 20 PPM phosphorus isused.c. Include P & K Buildup in final recs? “Yes” or “No” can be selected through a down arrowwhen the entry box is selected. To exclude Buildup from recommendation, select “No”resulting recommendation is based solely on crop removal where soil test does not exceedmaintenance limits.August 20204
d. User can customize buildup period from 3 to 6 years to manage fertilizer cost. The defaultvalue used in Tri‐State tables is 4 years. A pull down is used to select.e. Target pH for lime can be selected as 6.0, 6.5 or 6.8. A pull down is used to select.f.Depth of tillage for lime recommendation with adjust lime needed based on farm tillagesystem and expected incorporation. Depths range from 4‐8 inches in 2‐inch increments.g. Enter the crop using the pull down. A pull down is used to select.h. Type in the yield goal.Data Entry Tip. Data can be copied down the column by placing the curser in the lowerright‐hand corner, clicking so the green outline appears and then pulling down on the lowerright corner of the cell. This will work on any column where data entry is repeated fromentries made above it.Complete Single Field Entry for three crop rotation on Yield, Rotation, ManagementPreferences. Once all fields are entered scroll to top, scroll to top of page and click on Return toHome Page.August 20205
8) With field identification, soil test results and management information entered the user is readyto check the nutrient recommendations generated, then develop fertilizer and limerecommendations based on nutrient sources the user will use to meet the nutrientrecommendation.August 20206
9) Review Phosphorus Recommendations displays by crop year, the maintenance and buildupP2O5 needed based on the soil test and crop rotation.10) Review Potassium Recommendations displays by crop year, the maintenance and buildup K2Oneeded based on the soil test and crop rotation.August 20207
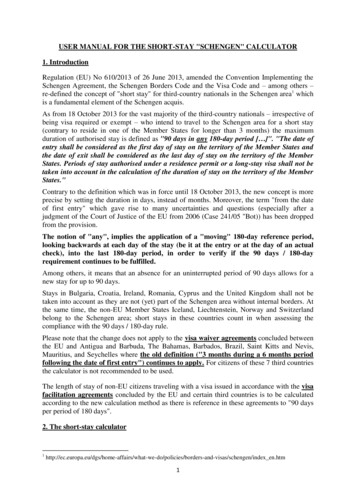
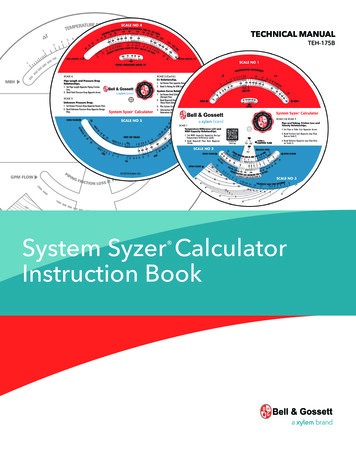
11) The Fertilizer P and K Recommendation page gives the user the option to identify the amountand cost of purchased fertilizer needed to meet the nutrient recommendation. The page allowsthe user to select the years where nutrient recommendations are available to include (A) andenter the analysis and cost of the fertilizer source (B) that would be used. Planned starterphosphorus and potassium can be subtracted by entering the pounds of P2O5 or K2O in theappropriate columns.12) On the Lime Recommendations page, the user can compare two lime sources (A) based on theircost and effectiveness to neutralize acidity. Needed information include Effective NeutralizingPower (ENP) from the lime analysis available from the lime source and cost information.Once the Lime Recommendations are completed, scroll to top of page and click on Return toHome Page.August 20208
13) The print option gives the user the ability to print output to the device selected in Excel forprinting.Prints just the Fertilizer P & K Recommendations Pageand Lime Recommendations Page.Prints all input and output pages.August 20209
Appendix 1. Critical levels, crop removal and equations used in Spreadsheet are from Tables 12, 15, 16and 17 of Tri‐State Fertilizer Recommendations for Corn, Soybeans, Wheat, and Alfalfa,2020.Table 12. Recommended Mehlich-3 Soil Test Phosphorus and Potassium Levels (CriticalLevel and Maintenance Limit) for Field Crops in the Tri-State RegionMehlich‐3 PhosphorusMaintenance RangeCropMehlich‐3 Potassium Maintenance RangeSandy soils(CEC 5 meq/ 100g)Loam and clay soils(CEC 6 meq/ 100g)Corn (grain orforage), Soybean20 – 40 ppm100 – 130 ppm120 – 170 ppmWheat, Alfalfa30 – 50 ppm100 – 130 ppm120 – 170 ppmTable 15. Nutrients Removed in Harvested GrainGrain Nutrient Removal RateCroplbs P2O5/ bushel lb K2O/ e 16. Nutrients Removed in Harvested Forage BiomassForage Nutrient Removal RateCroplbs P2O5/ tonlb K2O/ tonWheat Straw3.729Corn silage3.17.3Alfalfa12.049Source: International Plant Nutrition Institute (2014), dry matter basis: 100% for wheat straw and alfalfa;35% for corn silage (0% moisture for wheat straw, 65% moisture for corn silage).August 202010
Table 17. Equations Used for Calculating New Fertilizer RecommendationsMichigan potassium equations are identical to Indiana and Ohio with the exception there is notan additional 20 lbs of K2O added to crop nutrient removal.Phosphorus (lbs P2O5/ acre to apply)Maintenance rangeYield Nutrient RemovalBuild‐up range(Yield Nutrient Removal) [(CL – STP) x 5]Potassium for Indiana and Ohio (lbs K2O/ acre to apply)Maintenance range (grain crops)(Yield Nutrient Removal) 20[(Yield Nutrient Removal) 20] ‐Maintenance range (forage crops)[((Yield Nutrient Removal) 20) x (STK – CL)/50][(Yield Nutrient Removal) 20] Build‐up range[(CL – STK) (1 (0.05 x CEC))]Potassium for Michigan (lbs K2O/ acre to apply)Maintenance range (grain crops)Yield Nutrient Removal(Yield Nutrient Removal) ‐Maintenance range (forage crops)[(Yield Nutrient Removal) x (STK – CL)/50](Yield Nutrient Removal) Build‐up range[(CL – STK) (1 (0.05 x CEC))]Yield Yield potential in bushels/ acre or ton/acreNutrient Removal Nutrient removal rates from Tables 15 and 16 (lbs/bushel or lbs/ton)CL Critical level from Table 12 (ppm)STP Soil test phosphorus (Mehlich‐3ICP ppm), quantified by inductively coupled plasma emissionspectroscopy (ICP)STK Soil test potassium (Mehlich‐3 ICP ppm), quantified by ICPCEC cation exchange capacity (meq/100g)Appendix 2. Notes on Grass Hay and Grass/Legume Hay recommendations.Grass Hay and Grass/Legume Hay are not included in Tri‐State Fertilizer Recommendations for Corn,Soybeans, Wheat, and Alfalfa, 2020. The spreadsheet tool for Ohio also containsrecommendations for Grass Hay and Grass Legume Hay for P & K. The equations used are the Pequations and K the forage equation included in Table 17 above. With the followingparameters. Dr. Steve Culman, State Soil Fertility Specialist and Dr. Mark Sulc, State ForageSpecialist provide input into this chart.CropForage Nutrient Removal RateCritical‐Maintenance LevelMehlich 3‐PPMPK CEC 5K CEC 6lbs P2O5/ tonlb K2O/ tonGrass Hay124920‐40100‐130120‐170Grass/Legume Hay124930‐50100‐130120‐170August 202011
Crop and yield can be copied down the column after the first entry. The user can select by field/data line if they want build/maintenance or maintenance