Transcription
Development of GHG efficiency benchmarksfor the distribution of free emissionsallowances in the California Cap-and-TradeProgramRefineries – Preliminary Work Product
Development of GHG efficiency benchmarks for the distributionof free emissions allowances in the California Cap-and-TradeProgramRefineries – Preliminary Work ProductDate: August 20, 2012Project number: CMNNL11651/MARUS12484 Ecofys 2012 by order of: California Air Resources Board (CARB)ECOFYS Netherlands B.V. Kanaalweg 15G 3526 KL Utrecht T 31 (0)30 662 33 00 F 31 (0)30 662 33 01 E info@ecofys.com I www.ecofys.comChamber of Commerce 30161191
A cooperation of:Ecofys and UC BerkeleyDisclaimerEcofys U.S., Inc., a Nevada corporation (“Ecofys US”), its co-author(s), their parent organization(s)or subsidiaries, and their employees (collectively, “Ecofys”) has prepared this report for the sole useof the California Air Resources Board (“CARB”) pursuant to an agreement between Ecofys US andCARB. The views and opinions of authors expressed in the report do not necessarily state or reflectthose of CARB, the State of California, or any agency thereof. Ecofys makes no warranty, express orimplied as to the conduct of Ecofys or the contents of this report, and Ecofys assumes no legalliability or responsibility for the accuracy, completeness, or usefulness of any information in thereport.ECOFYS Netherlands B.V. Kanaalweg 15G 3526 KL Utrecht T 31 (0)30 662 33 00 F 31 (0)30 662 33 01 E info@ecofys.com I www.ecofys.comChamber of Commerce 30161191
Table of Contents1Introduction12Overview of California Refinery Industry3345Oil Refining Process and Related CO2 Emissions123.1Refinery process123.2Sources of CO2 Emissions163.3Determinants of Emissions Intensity17Overview of Approaches for Benchmarking Emissions Efficiency194.1Benchmarking on the Basis of Crude Oil Processed or Output of Products194.2Process-Specific Benchmarks214.3Hybrid Approach224.4Complexity Weighted Approaches224.5Comparison of Approaches23CO2 Weighted Tonne (CWT) Approach245.1Description of CWT Methodology245.1.1Determination of Amount of CWT245.1.2Determination of Benchmark255.1.3Determination of Allocation265.2Technology and Input Differentiation265.3Background to the Development and Adoption in the EU ETS265.3.1Development at Solomon265.3.2Adoption in EU Regulations275.4Weighting Factors285.4.1Introduction285.4.2Effect on benchmark and allocation285.4.3CWT Factors used in Europe295.4.4Weighting Factors for California295.5Definition of Process Units305.5.1Introduction305.5.2Definition Used in Europe305.5.3Definitions for California305.6Corrections for Off-Sites and Non-Crude Feedstock305.6.1Introduction30ECOFYS Netherlands B.V. Kanaalweg 15G 3526 KL Utrecht T 31 (0)30 662 33 00 F 31 (0)30 662 33 01 E info@ecofys.com I www.ecofys.comChamber of Commerce 30161191
65.6.2Corrections Used in Europe315.6.3Corrections for California315.7Steam Import and Export315.7.1Determination of the Benchmark315.7.2Determination of the Allocation335.8Electricity Consumption and Production345.8.1Determination of the benchmark345.8.2Determination of the allocation385.9Hydrogen Production395.9.1Introduction395.9.2Refinery-Owned versus Merchant Production395.9.3Gaseous versus Liquid Hydrogen405.10Coke d versus Merchant Production41CWT Approach Applied to California Refineries426.1Data Sources and Approach426.2Results426.3Exclusion of Atypical Refineries447Conclusions and Recommendations468References47Appendix A: CWT Calculation Table49Appendix B: Details of CWT Process Units51Appendix C: Efficiency vs. Intensity70Appendix C: Linking of refineries listed by different data sources72ECOFYS Netherlands B.V. Kanaalweg 15G 3526 KL Utrecht T 31 (0)30 662 33 00 F 31 (0)30 662 33 01 E info@ecofys.com I www.ecofys.comChamber of Commerce 30161191
1IntroductionThe California Greenhouse Gas Cap-and-Trade Program aims to control greenhouse gas emissions ofthe participants in a cost-effective way by creating a system of tradable greenhouse gas (GHG)emissions allowances. The associated emissions cap and market-based compliance mechanisms aredefined by the final Cap-and-Trade Regulation that went into effect on January 1, 2012.1The program includes three compliance periods in which the covered entities need to balanceemissions with allowances. The first one of these periods will start on January 1, 2013 and ends inDecember, 2014. The second period will start in 2015 and ends in 2017. The third period will start in2018 and end 2020. The program initially covers industrial facilities, electricity generators, electricityimporters and suppliers of carbon dioxide. With the start of the second compliance period in 2015,the program will also include suppliers of natural gas, RBOB, distillate fuel oil and liquefied petroleumgas. Only entities that need to balance annual emissions above a threshold of 25 kt CO2 are includedautomatically. Entities with emissions below this threshold may apply to be included via opt-inprovisions.Most covered industrial facilities will receive an amount of allowances for free based on GHGemissions intensity benchmarks:-The Cap-and-Trade Regulation defines product-based benchmarks for 23 activities. Facilitiesthat perform one or more of these activities receive an amount of allowances that is based onthe relevant yearly amount of output (expressed in unit of output per year) and thecorresponding benchmark (expressed in allowances per unit of output), a cap adjustmentfactor and, an assistance factor. The amount of allowances is updated each year to reflectchanges in output, cap adjustment, and assistance factor.-For industrial activities that are not covered by a product-based benchmark, facilities receivean amount of allowances that is based on steam and fuel consumption in an historicalbaseline period (steam and/or fuel, expressed in MMBtu per year) and one or two energybased benchmarks (0.06244 allowances per MMBtu of steam and/or 0.05307 per MMBtu offuel). Unlike the allowances distributed via product-based benchmarks, the amount ofallowances distributed via energy-based benchmarks is calculated only once and not updatedeach year.For the first compliance period, the amount of free allocation to refineries is determined using a twostep approach. First, the total amount of free allocation to California refineries is determined using a“simple output barrel” product-based benchmark2. In a second step, this total amount is distributedover individual refineries on the basis of a complexity-adjusted energy efficiency metric for complexrefineries and the simple barrel benchmark for simple refineries. After the first compliance period,1Subchapter 10 Climate Change, Article 5, Sections 95800 to 96023, Title 17, California Code of Regulations.2This benchmark is based on the primary products produced including aviation gasoline, motor gasoline,kerosene-type fuel jet fuel, distillate fuel oil, renewable liquid fuels and asphalt.1
this two-step approach will be replaced by a uniform complexity-adjusted approach for all refineriesknown as the Carbon Dioxide Weighted Tonne (CWT) approach.This document3 compares the different allocation approaches. It investigates the use of the CWTapproach in the California Cap-and-Trade Program to identify potential issues and proposes differentways to deal with those issues. The goal of this document is to support California rulemaking. Inparticular, this document serves as a basis for discussions with stakeholders. It does not aim to makeany judgment about the California Cap-and-Trade Regulation, but rather to objectively describeconsequences of different policy decisions.The structure of this report is as follows:-Chapter 2 provides a general overview of the California refinery industry.-Chapter 3 describes the oil refining process and associated CO2 emissions.-Chapter 4 discusses and compares different benchmarking approaches.-Chapter 5 focuses on the Carbon Dioxide Weighted Tonne (CWT).-In Chapter 6, the CWT approach is applied to California refineries using data that wasavailable to the authors as of July 2012.-Finally, chapter 7 summarizes the conclusions and recommendations.3This document has been developed as part of a larger assignment by ARB to a consortium of Ecofys and UCBerkeley.2
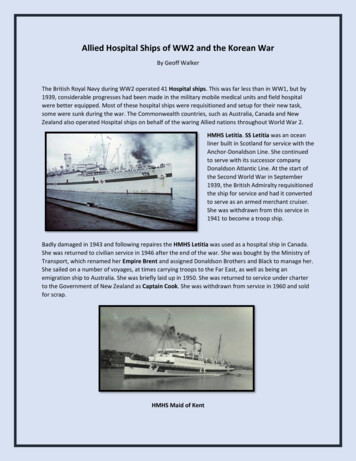
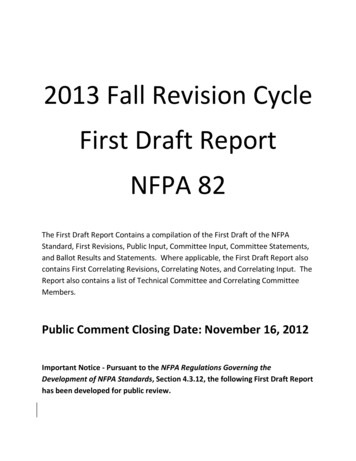
2Overview of California Refinery IndustryThe Cap-and-Trade Regulation defines a “Petroleum Refinery” or “Refinery” as any facility engaged inproducing gasoline, gasoline blending stocks, naphtha, kerosene, distillate fuel oils, residual fuel oils,lubricants, or asphalt (bitumen) through distillation of petroleum or through re-distillation, cracking,or reforming of unfinished petroleum derivatives. The regulation further states that facilities thatdistill only pipeline transmix (off-spec material created when different specification products mixduring pipeline transportation) are not petroleum refineries, regardless of the products produced.There are 23 facilities in California that meet the definition in the Cap-and-Trade Regulation. Thesefacilities are classified as follows in the North American Industry Classification System (NAICS),(NAICS, 2007):-20 petroleum refineries; these facilities are primarily engaged in refining petroleum fromcrude petroleum (NAICS code: 32411)-1 facility categorized under “all other basic inorganic chemical manufacturing” (NAICS code:325188)4-1 petroleum lubricating oil and grease manufacturing facility; the products are lubricatingoils and greases made by blending or compounding refined petroleum and/or re-refiningused petroleum lubricating oils (NAICS code: 324191).5-1 asphalt paving mixture and block manufacturing facility; the products are asphalt and tarpaving mixtures and blocks (NAICS code: 324121).5The locations of petroleum refineries are shown inFigure 1. The figure shows that refineries are mainly located in the San Francisco Bay Area, LosAngeles area, and the Central Valley.4This facility is a sulfur recovery plant that can be seen as a support facility for one of the petroleum refineries(source: South Coast Air Quality Management District)5This facility has emissions below the inclusion threshold of 25 ktCO2 and has not been included in earlier workon benchmark development by ARB staff (see also next section on emissions).3
Figure 1. Refinery locations in California (source: URS Corporation, 2007 from California Energy Commission)Emissions4
Refineries are a major source of GHG emissions in California. While only accounting for 4% of thetotal number of facilities in the Cap-and-Trade Program, refinery emissions represent about 30% oftotal covered emissions. Table 1 shows the yearly emissions from non-biomass fuel consumption inthe period 2008–2010 as reported under California’s Mandatory Greenhouse Gas ReportingProgram.6A number of facilities that reported under the primary reporting sector “Petroleum Refinery”did not only manufacture petroleum products, but produced electricity, heat, calcined coke, and/orhydrogen as well. Out of the 23 refineries, 16 refineries also reported under a secondary reportingsector (see Table 1). Relevant definitions for secondary reporting sectors as found in the ARBMandatory Reporting Regulation (ARB MRR) are provided below. The definition of petroleum refinerycan be found on page 3.-“Cogeneration” means an integrated system that produces electric energy and useful thermalenergy for industrial, commercial, or heating and cooling purposes, through the sequential orsimultaneous use of the original fuel energy. Cogeneration must involve generation ofelectricity and useful thermal energy and some form of waste heat recovery .-“Hydrogen plant” means a facility that produces hydrogen with steam hydrocarbonreforming, partial oxidation of hydrocarbons, or other processes.-“Electricity generating facility” means a facility that generates electricity and includes one ormore generating units at the same location.Operators of installations that had annual emissions equal to or greater than 25 kt CO2 in 2009through 2011 are included in the first compliance period of the Cap-and-Trade Program. Any facilitythat exceeds the threshold in subsequent years is a covered entity starting in the year that thethreshold is exceeded. Table 1 shows that the facility classified as petroleum lubricating oil andgrease manufacturing facility and the facility asphalt paving mixture and block manufacturing facilityhave annual emissions below 25 kt CO2. Despite having emissions below the inclusion threshold,these installations may elect to opt in to the Cap-and-Trade Program, provided that the ARB’sExecutive Officer approves.6For more background see: d data/ghg-reports.htm5
Table 1 Facilities in California reporting under primary reporting sector ‘Petroleum Refinery’ in California’s Mandatory Greenhouse Gas Reporting Program; and their reported2008-2010 emissions.ARBFacility/SectorMRR IDCitySecondary reporting sector#Emissions from fuel combustion(metric ton CO2-eq. / year)e200820092010NAICS 324110 - Petroleum RefineriesAlon Bakersfield Refinery - Area 3 (formerly Big Westof Californiaa Bakersfield Refinery)100884BakersfieldAlon Bakersfield Refinery - Areas 1&2 (formerly BigWest of Californiaa Bakersfield Refinery)101237BakersfieldHydrogen PlantBP West Coast Products LLC, Refinery101246CarsonChevron Products Company - El Segundo Refinery100138El en Plant, Cogeneration Facility4,504,2864,426,8514,432,520Electricity Generation3,357,8213,205,8733,452,447Chevron Products Company - Richmond Refinery101384RichmondHydrogen Plant, Cogeneration Facility4,798,2824,522,3834,511,882ConocoPhillipsc Refining Company - SF Refinery100303RodeoHydrogen Plant, Cogeneration c Los Angeles Refinery, Wilmington Plant100329WilmingtonHydrogen Plant, Cogeneration drogen icity 4,5742,907,770cConocoPhillips Los Angeles Refinery, Carson PlantConocoPhillipsc Santa Maria RefineryEdgington Oil Companyb101320ExxonMobil Torrance Refinery100217Kern Oil and Refining CompanyLunday-Thagard CompanybLong Beach2,852,37331,452TorranceHydrogen Plant, Cogeneration Facility101507BakersfieldCogeneration Facility171,140161,313145,469101162South 7,520Paramount Petroleum Corporation101056ParamountCogeneration FacilitySan Joaquin Refining Company101239BakersfieldHydrogen Plant100914MartinezHydrogen Plant, Cogeneration 1,9092,102,726Shell Oil Products USTesoro Refining and Marketing Co. - LAR100335WilmingtonHydrogen Plant, Cogeneration Facility,Electricity GenerationTesoro Refining and Marketing Company101331MartinezHydrogen Plantd6189,3601,627,8612,703,1451,455,976
ARBFacility/SectorMRR IDCitySecondary reporting sector#Emissions from fuel combustion(metric ton CO2-eq. / 1,106Ultramar Inc – Valero101205WilmingtonValero Refining Company -California, Benicia Refineryand Benicia Asphalt a16,2665,202Bn.a.Hydrogen Plant, Cogeneration Facility994,536NAICS 325188 - All Other Basic Inorganic ChemicalManufacturingTesoro Refining and Marketing Co. - SRPdNAICS 324191 - Petroleum Lubricating Oil and GreaseManufacturingEvergreen Oil, Inc, RefineryNAICS 324121 - Asphalt Paving Mixture and BlockManufacturingSanta Maria Refining Companya.b.c.d.e.f.Acquired by Alon in 2010Acquired by Alon in 2006Became Phillips 66 in May 2012. The San Francisco Refinery comprises two facilities linked by a 200-mile pipeline: the Santa Maria facility located in Arroyo Grande and the Rodeofacility in the San Francisco Bay Area. The Santa Maria facility upgrades heavy crude oil for final processing in the San Francisco Bay facility. The Los Angeles Refinery Complex iscomposed of two facilities linked by a five-mile pipeline. The Carson facility serves as the front end of the refinery by processing crude oil, and Wilmington serves as the back end byupgrading the products (source: 10-K forms)Spent DEA solution (hydrogen sulfide rich solution) and sour water (containing hydrogen sulfide and ammonia) are transferred, via pipeline, from the refinery (LAR) to the sulfurrecovery plant (SRP) for sulfur recovery and ammonia removal. The lean (hydrogen sulfide free) DEA solution from the SRP is sent back to the refinery (LAR) for reuse. Because ofthe operational dependency between the two facilities, the SRP is considered a support facility for the refinery even though the two facilities are neither contiguous nor adjacent toeach other (source: South Coast Air Quality Management District)As available in May 2012: Overall report verification finding of 2010 and 2009 emissions was ‘positive’ unless indicated otherwise by superscript A (‘adverse’) or B (‘unverified’).Report emissions status of 2008 emissions ‘certified’ unless indicated otherwise by superscript C (‘in revision’) or D (‘not certified’)Will become Tesoro in 2013. Tesoro plans to connect the refinery with their Wilmington refinery, making them a single unit, with crude oil and product pipelines ixzz23Wrn1i27)7
CapacityTable 2 shows the capacity of the major process units within California refineries as available in the2011 Refinery Capacity Report7 by the U.S. Energy Information Administration (EIA).Capacity can either be reported per stream day or as per calendar day8:-Barrels per stream day: the maximum number of barrels of input that a distillation facility canprocess within a 24-hour period when running at full capacity under optimal crude andproduct slate conditions with no allowance for downtime.-Barrels per calendar day: the amount of input that a distillation facility can process underusual operating conditions. The amount is expressed in terms of capacity during a 24-hourperiod and reduces the maximum processing capability of all units at the facility undercontinuous operation (see “barrels per stream day”) to account for the following limitationsthat may delay, interrupt, or slow down production:1. The capability of downstream processing units to absorb the output of crude oil processingfacilities of a given refinery. No reduction is necessary for intermediate streams that aredistributed to other than downstream facilities as part of a refinery's normal operation;2. The types and grades of inputs to be processed;3. The types and grades of products expected to be manufactured;4. The environmental constraints associated with refinery operations;5. The reduction of capacity for scheduled downtime due to such conditions as routineinspection, maintenance, repairs, and turnaround; and6. The reduction of capacity for unscheduled downtime due to such conditions as mechanicalproblems, repairs, and slowdowns.7Capacities as available in the 2011 Refinery Capacity Report by the U.S. Energy Information Administration (EIA)(Available at: scriptions from: http://petrofortune.com/Resources/Glossary/B.aspx8
Table 2 Refinery capacity data by individual refinery as of January 1, 2011 (U.S. EIA, 2011)1Downstream charge atalyticCatalyticCatalyticFuels solvent Thermal VacuumAsphalt & HydrogenDesulphurisation6Isomerisation8 Lubricants PetcokeAlkylates Aromatics(st/d)cracking3 hydrocracking4 reforming5deasphalting cracking7 distillationroad oil 0b12,900c55,000d53,200a82,000NAICS 324110/SIC 2911 - Petroleum9RefineriesAlon Bakersfield Refinery - Areas1&210Production capacity (b/sd)-966,000449,900a52,000b 1,721,368 ,80010,000b1053,10012,800b1,500414,345Alon Bakersfield Refinery - Area 310BP West Coast Products LLC,Refinery14a266,000 102,500Chevron Products Company – ElSegundo Refinery286,900Chevron Products Company Richmond Refinery257,20073,800aa90,000ConocoPhillips Refining Company - SFRefinery11128,00050,00052,300a11ConocoPhillips Santa Maria RefineryConocoPhillips Los Angeles RefineryWilmington Plant11ConocoPhillips Los Angeles Refinery,Carson Plant 11Edgington Oil Company13147,000a51,60027,50036,20039,800 25,000934,0009,90015,000
1Facility/SectorCrude2(b/sd)Downstream charge capacity1(b/sd)CatalyticCatalyticCatalyticFuels solvent Thermal VacuumAsphalt & HydrogenSulphurDesulphurisation6Alkylates AromaticsIsomerisation8 Lubricants Petcokecracking3 hydrocracking4 reforming5deasphalting cracking7 distillationroad oil (MMCFD)(st/d)aExxonMobil Torrance Refinery155,800Kern Oil and Refining Company27,000Lunday -Thagard Company10,000Paramount Petroleum Corporation1355,000San Joaquin Refining Company25,000Production capacity 3aShell Oil Products USTesoro Refining and Marketing Co. –LARTesoro Refining and MarketingCompanyUltramar Inc – Valero12Valero Refining Company -California,Benicia Refinery and Benicia 0e26,700f29,500b81,30017,100The input (feed) capacity of the refinery processing facilitiesBarrels per stream day, except for hydrogen in millions of cubic feet per day (mmcfd) and sulphur in short tons per day (st/d)abThe feeds used for catalytic cracking are fresh feed and recycled 20010,0002656,800303
4abThe feeds used for catalytic hydrocracking are gas oil and distillate.abCatalytic reforming can occur at low pressure or high pressure.6abcdefThe feeds used for desulphurisation: naphtha/reformer, diesel oil, kerosene and jet, gasoline, heavy gas oil and other distillate.7abcThe types of thermal cracking used are delayed cooking, fluid cooking and vis breaking.8abcIsomerisation of isobutane, isopentane/isohexane and isooctane; does not include sulphur and hydrogen.9In the EIA data, capacity data of Tenby Inc owned by Oil Holding Inc is given. However, this company does not appear on ARB’s list of operable facilities and has therefore been excludedfrom the total capacity calculation.10Acquired by Alon in 201011Became Phillips66 in May 201212In EIA data Valero Refining Co Wilmington Asphalt Plant is mentioned separately. It is assumed that this plant is not part of facility as defined for the Cap-and-Trade Program13Acquired by Alon in 2006514Will become Tesoro in 2013. Tesoro plans to connect the refinery with their Wilmington refinery, making them a single unit, with crude oil and product pipelines ixzz23Wrn1i27)11
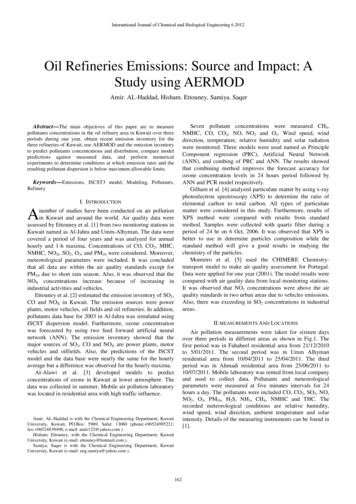
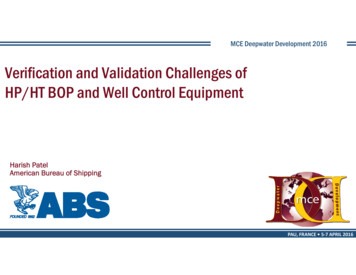
3Oil Refining Process and Related CO2 Emissions3.1Refinery processThe basic processes in the production of refined oil products from crude oil can be categorized in thefollowing groups (Ecofys, 2009):-Distillation processes: physical separation methods to decompose homogeneous liquid-Conversion processes: chemical methods to change the chemical structure of hydrocarbonsmixtures under usage of the different boiling behavior of the mixture components.contained in the different crude oil fractions (mostly producing smaller molecules andincreasing the hydrogen to carbon ratio).-Finishing processes of refined oil products: the gases, liquefied gases, gasoline, middledistillates and gas oils produced by the distillation and conversion processes are cleaned byremoving compounds which disturb further processing or the quality of finished products.-Other processes: besides these basic procedures mentioned above, a number of furtherprocedures are necessary to achieve the desired quality of the oil products and process byproducts such as sulfur.In addition to the process steps that are typically found in refineries, several refineries also includepetrochemical units for the production of basis chemicals such as steam crackers and units for theproduction of aromatics. A simplified process diagram of a typical oil refinery is shown in Figure 2.The processes in a refinery vary depending on the complexity of the refinery. Below, the key processsteps in a refinery are briefly explained in more detail (unless noted otherwise, descriptions are basedon Öko Institut (2008); other overviews are, amongst others, provided by LBNL (2004), LBNL (2005)and BREF Refineries-draft (2012)).Crude oil distillation: The first step in the oil refining process is the separation of crude oil intovarious fractions by distillation in atmospheric and vacuum towers. The main fractions obtained havespecific boiling-point ranges and can be classified in order of decreasing volatility into gases, lightdistillates, middle distillates, gas oils, and residues.The distillation products are further processed, depending on the desired product mix. Refinery gas isused as fuel in the refinery operations to generate heat (furnaces), steam (boilers) or power (gasturbines), while some of the refinery gas may be flared. Parts of the refinery gas may also be used toblend with LPG or for hydrogen production. Hydrogen is used in different processes in the refinery toremove sulfur (e.g., hydrotreating) and to convert to lighter products (e.g., hydrocracking).12
Figure 2. Simple diagram of an oil refinery (Source: http://en.wikipedia.org/wiki/Petroleum refining)13
Thermal operations: Since not all products of the simple distillation of crude oil can directly be soldto the market, subsequent refinery processes change the product mix by altering the molecularstructure of the hydrocarbons. One of the ways of accomplishing this change is through "cracking," aprocess that breaks or cracks the heavier, higher boiling-point petroleum fractions into more valuableproducts such as gasoline, fuel oil, and gas oils. The two basic types of cracking are thermal cracking,using heat and pressure, and catalytic cracking.Coking process: Coking is a severe method of thermal cracking used to upgrade heavy residualsinto lighter products or distillates. Coking produces gasoline and various middle-distillate fractionsused as catalytic cracking feedstock. The process completely reduces hydrogen such that the residueis a form of carbon called "coke."The most important processes are delayed coking and flexicoking, both developed by Exxon and usedat various refineries around the world. Refineries in California generally use lots of heavy feedstocks.Therefore, California refineries have a relative large coking capacity. The coking capacity in Californiais mostly made up of delayed cokers. In the U.S., only the Shell Martinez-refinery in the SanFrancisco Bay Area has a flexicoker installed (LBNL, 2004).Coke calcining: See section 5.10.Catalytic cracking: Catalytic cracking breaks complex hydrocarbons into simpler molecules in orderto increase the quality and quantity of lighter, more desirable products and decrease the amount ofresiduals. This process rearranges the molecular structure of hydrocarbon compounds to convertheavy hydrocarbon feedstock into lighter fractions such as kerosene, gasoline, LPG (liquifiedpetroleum gas), heating oil, and petrochemical feedstock. Use of a catalyst (a material that assists achemical reaction but does not take part in it) in the cracking reaction increases the yield of products.The most common catalytic cracking process is the FCC (fluid catalytic cracking). Most Californiarefineries pre-treat the FCC-feed by hydrotreating (LBNL, 2004).Hydrocracking: Hydrocracking is a two-stage process combining catalytic cracking andhydrogenation. In this process, heavier feedstocks are cracked in the presence of hydrogen toproduce more desirable products. The process employs high pressure, high temperature, a catalyst,and hydrogen. Hydrocracking is used for feedstocks that are difficult to process by either catalyticcracking or reforming.Catalytic reforming: Catalytic reforming is an important process used to convert low-octanenaphtha into high-octane gasoline blending components called reformates. Reforming represents thetotal effect of numerous reactions such as cracking, polymerization, dehydrogenation, andisomerisation taking place simultaneously. Hydrogen, a significant by-product, is separated from thereformate for recycling and use in other processes.Catalytic hydrotreating: Catalytic hydrotreating is a hydrogenation process used to remove about90% of contaminants such as nitrogen, sulfur, oxygen, and metals from liquid petroleum fractions.14
These contaminants, if not removed from the petroleum fractions as they travel through the refineryprocess units, can have effects on
Ecofys and UC Berkeley . Disclaimer . Refineries are a major source of GHG emissions in California. While only accounting for 4% of the total number of facilities in the Cap-and-Trade Program, refinery emissions represent about 30% of total covered emissions. Table 1 shows the yearly emissions from non-biomass fuel consumption in