Transcription
A STUDY INROASTLEVELSComparing and ContrastingTwo Coffees Roasted to Five Different LevelsStory and Photos by Coffee Analysts’ StaffROAST PROFILE DEVELOPMENT is both anart and a science. Determining what isThe first step is to identify success criteria:What is good, what is not good, how willbest for each coffee is a difficult challenge—bestthe coffee be evaluated, and, perhaps mostblend, best roast level, best brewing method,importantly, to what will the coffee be compared?and so on. Knowing what attributes you preferProduct development has two importantis easy; however, when developing productsfunctions: creating a product that meets theto sell, predicting what customers will like isquality and profile expectations of the company,more difficult. While marketing managers andand developing a product that will be purchasedconsumer insight professionals have protocols forand enjoyed by consumers. Ultimately, thedetermining consumer preferences and purchasetrue measure of any coffee program is beverageintent, coffee roasters and product developersquality—how does it taste? Branding, promotionmust conduct their own technical analysis whenand merchandising will capture the first sale, butdeveloping new products and optimizing existingonly consistent quality will keep your customersones.returning time after time.continued on page 26The Costa Rican samples ground and ready to brew.24roastMa r c h Ap r i l 2 0 1525
A STUDY IN ROAST LEVELS Comparing and Contrasting Two Coffees Roasted to Five Different Levels(continued)We often hear, “The lighter the roast, theagain using the SCAA scoring method forgreater the acidity; the darker the roast, theconsistency.fuller the body,” so we decided to study theeffects of roast development on physical,chemical and sensory attributes.The ProjectLa Minita provided the two green coffee lotsWe elected to evaluate two arabica coffeesrequest was fresh green coffee from Central(one Central American and one East African)America and East Africa so we could studyat five different roast levels for physical,the differences between these two popularchemical and sensory attributes. We set outgrowing regions. As with any scientific study,to utilize two sensory protocols: cupping,having two data sets is important to helpas the standard professional analysis; andexplain any anomalies or unexpected results.tasting, or evaluating brewed beverages fromHowever, instead of using two similar coffeesthe consumer perspective. For consistency,for this research project, we decided that twowe used the standard Specialty Coffeegreen coffees from different parts of the worldAssociation of America (SCAA) cupping formwould be more interesting. We selected a fullyas the scoring method. Following SCAAwashed arabica from Costa Rica and a naturallyprotocols whenever possible, origins werefermented arabica from Kenya.sample roasted, then rested overnight andBoth sample coffees roasted to five different levels.26roastThe CoffeeSelection Processfor this project. For sample purposes, our onlyThe Central American coffee was growncupped by our sensory panel. To obtainat Hacienda La Minita in the Tarrazú regiontasting scores, origins were brewed onof Costa Rica, on a farm founded by Williamcommercial Bunn Axiom brewers using aMcAlpin in 1978, with a total size of 1,200 acres.standard brewing formula and evaluated,continued on page 28The Kenyan coffee ready to cup.Ma r c h Ap r i l 2 0 1527
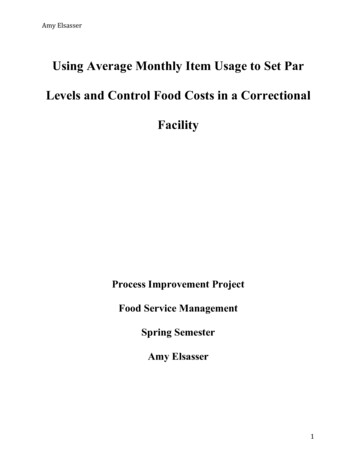
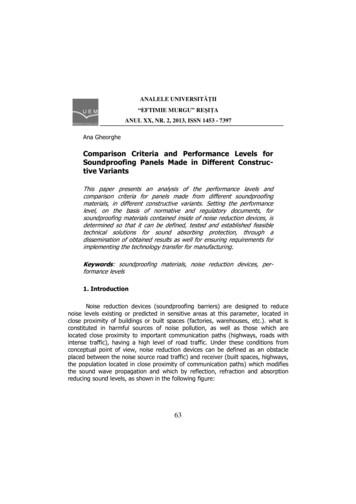
A STUDY IN ROAST LEVELS(continued)This Rainforest Alliance-certified farm harvested by hand andprocessed the coffee in its wet mill and dry mill facilities. Thecoffee tested was harvested between 1,300 and 1,800 metersabove sea level (MASL) and was made up of the followingcultivars: caturra, catuai red, catuai yellow, and tipica hibrido.The East African coffee was grown by the MkumbuneFarmer Coop Society in the Meru region of Kenya, in volcanicloam on the eastern slopes of Mount Kenya. The coffee testedwas harvested at 1,550 MASL and was made up of traditionalSL28 and SL34 varieties. The Mkumbune Farmers Coop Societyis made up of approximately 400 small-holder farmers with anaverage of 200 trees each. These farmers also harvest by handand deliver the fruit to the wet mill. The fully washed coffeesare sun-dried on elevated tables at the Regeju Factory.continued on page 30CHART SECTION A: ROAST PROFILESCosta Rica Roast Profiles500480temperature (F )460440420Level 1Level 2Level 3Level 4Level 10”minutesKenya AA Roast Profiles500480temperature (F )460440420Level 1Level 2Level 3Level 4Level 10”11”minutes28roastMa r c h Ap r i l 2 0 1529
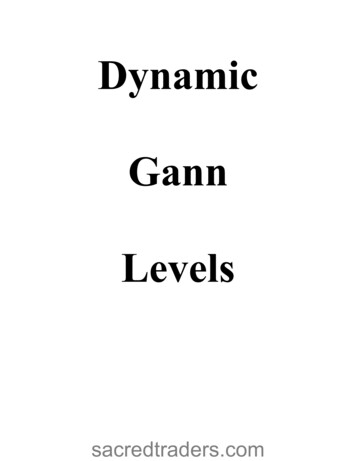
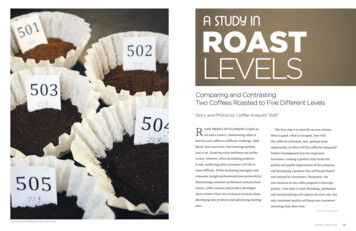
A STUDY IN ROAST LEVELS(continued)Physical analysis was completed on 350 grams of each coffee withthe following results:The Costa Rica Tarrazú coffee had zero primary defects andone secondary defect. The total moisture upon receipt was 7.53percent with a density of 0.713 g/ml3.The Kenya AA coffee had zero primary defects and two secondary defects. The total moisture was 7.27 percent with a density of0.733 g/ml3, suggesting a greater concentration of cells per volume than the Costa Rica Tarrazú.The Roast Process andSelection Of Roasted SamplesSee Chart Section A on page 28Five green samples of 165 grams each were prepared fromeach origin. These greens were roasted with Coffee Analysts’Jabez Burns four-barrel sample roaster. The roasting followedSCAA protocol for roast development (length of roast). Roasttemperatures were noted and logged during the process atcontinued on page 32CHART SECTION B: COSTA RICACosta Rica Attribute vs. Roast Level8.58.0Fragrance& Aromafinal ance5.0Overall4.5Level 1Level 2Level 3Level 4Level 5roast levelCosta Rica Tasting vs. Cupping8684final score82807876CuppingTasting7472Level 1Level 2Level 3Level 4Level 5roast level30roastMa r c h Ap r i l 2 0 1531
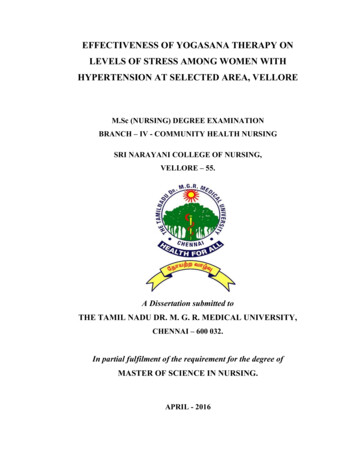
A STUDY IN ROAST LEVELS Comparing and Contrasting Two Coffees Roasted to Five Different Levels(continued)1-minute intervals. After the roasting was52.1, 46.0, 36.6, and 28.4 (lightest to darkest).there were no quakers present. (A quakercomplete, five samples were selected fromThe Kenyan samples were 56.9, 50.1, 40.8, 37.3is an undeveloped coffee bean that doesn’tthe sweet, dried-fruit note along with thedominated. The dried-fruit note, thougheach origin, fairly representing the lightest toand 27.9 (lightest to darkest).roast to the same level as others. Specialty-introduction of leather and smoke.present, was diminished significantlydarkest samples for this experiment.For this research, our goal was to produceYield from each roast was between 140and 150 grams. This allowed for each samplefive samples for analysis at visually differentto be used for cupping (60 grams purge) andlevels of roast development. We measuredbrewing (77.9 grams) from the same roastedthe roast development using an Agtron E-20batch.CP Analyzer, using the commercial scale forPer SCAA protocol, 100 grams from eachrecording. The Costa Rica samples were 63.3,roast was evaluated for the presence of quakers;grade coffee has zero quakers in a 100-gramroasted sample.)The Cupping ProcessFor each origin, coffee from each of thefive roast levels was scaled into five cupsand hydrated using 1.63 grams per fluidounce of water. The samples were groundand evaluated by panelists using the SCAAscoring method.The Brewing ProcessFor each origin, 77.9 grams was scaled, thenground into a filter and brewed using BunnAxiom commercial equipment. Sampleswere drawn to determine and test for pH,brew solids and extraction.The brewed samples were poured intocupping bowls and arranged so that eachpanelist had a full set of all five roast levelsto evaluate and note the sensory attributes.The SCAA scoring method was used forthe brewed coffee samples to achieveuniformity in sensory evaluation.Sensory ProfileTasting and Cupping:Costa Rica TarrazúSee Chart Section B on page 30Sensory attributes were observed asLevel 5 (darkest): The coffee maintainedThese characteristics were consistent withcupping and tasting.Level 5 (darkest): Earth and smoke pre-and the coffee gave way to slight ashy andburnt characteristics.These characteristics were mirrored inSensory ScoresTasting and Cupping:Costa Rica Tarrazúboth cupping and tasting notes.Sensory ScoresTasting and Cupping:Kenya AASee Chart Section C on page 34Sensory scores for the Kenya AA showed similartrends for cupping and tasting, both peaking atlevel 2 and scoring lower for dark roast levels.Cupping scores peaked at roast level 2 withcontinued on page 34See Chart Section B on page 30Scores for the Costa Rica coffee followeddifferent sensory score trends for cuppingand tasting. Cupping scores peaked at roastlevel 3 with body at greatest intensity atlevel 4 and acidity highest at level 2 andlevel 3, but dropping almost 3 points at level5. Level 4 of the Costa Rica coffee producedsimilar scores for cupping and tasting.Level 3 had the greatest sensory scoredifference. The scores intersected after level1 and at level 4, illustrating a reversal ofintensity and quality between cupping andtasting.Sensory ProfileTasting and Cupping:Kenya AASee Chart Section C on page 34The progression of sensory attributesthroughout the roasting process wasobserved as follows:consistent with roast development fromlightest to darkest.Level 1 (lightest): Panelists mentionedbright lemon, grass and floral notes. TheLevel 1 (lightest): Panelists noted lemon,apricot and peanut shells.Level 2: The lemon character becameLevel 2: As the roast progressed, lemonbecame peach and tangerine, honey turnedthe introduction of caramel, honey sweet-to caramel, and toasted almond generalizedness and chocolate.to toasted nuts.Level 3: Chocolate and bakery spicesginning to diminish. The brightness of theentered the profile of the coffee. What wascitrus was tempered with plum and driedonce tangerine and peach moved into driedfruit.fruit (berry and plum).Level 4: The introduction of tobacco, ashroastalmond and light caramel.more of a caramelized citrus combined withLevel 3: Panelists noted the acidity be-32sweetness came from honey, toastedLevel 4: Dark chocolate was prominent.and molasses was noted along with choco-Tobacco, leather, molasses and slightlate notes becoming less sweet, more simi-smoky notes were apparent and the dried-lar to cocoa and dark chocolate.fruit notes held firm.Ma r c h Ap r i l 2 0 1533
A STUDY IN ROAST LEVELS Comparing and Contrasting Two Coffees Roasted to Five Different Levels(continued)body at greatest intensity at level 3 and acidity highest at level 1brew solid levels. Because the samples all were brewed at theand level 2, but dropping 1.5 points at level 5. Level 2 of the Kenyasame coffee-to-water ratio, in the same brewers, at the sameproduced similar scores for cupping and tasting. Level 3 had thetemperature, and tested identically, one can only posit thatgreatest sensory score difference. The scores did not intersect, butcontinued on page 36followed similar trends.CHART SECTION D:Brew Solids, Extraction and pHBrew Solids, Extraction and pHSee Chart Section D, this pageBrew Solids and RoastPrior to roasting, all green coffee has an abundance of amino acids1.2and carbohydrates. The roasting process starts to convert andof soluble material. As heat is applied, the amount of solublematerial decreases until complete pyrolysis occurs. This generaltrend can be seen in the brew solids and extraction data charts.An anomaly occurred at roast level 4, which demonstratedbrew solids (%)new ones. In the green state, coffee has the highest amountKenya AACosta Rica1.1break down these components, eliminating some and creatinga large increase in both the extraction percent and, therefore,1.00.90.80.70.60.5CHART SECTION C: KENYALevel 1Level 4Level 5Extraction Yield and Roast229.0Fragrance& erall6.5Level 1Level 2Level 3Level 4Level 5Kenya AACosta Rica20extraction yield (%)8.5final scoreLevel 3roast levelKenya Attribute vs. Roast Level6.0Level 21816141210Level 1roast levelLevel 2Level 3Level 4Level 5roast levelKenya Tasting vs. CuppingpH Data (Brewed Coffee)866.585final score846.082805.5787674CuppingTasting5.0Kenya AACosta Rica Tarrazu7270Level 1Level 2Level 3Level 4Level 54.5Level 1Level 2Level 3Level 4Level 5roast level34roastMa r c h Ap r i l 2 0 1535
A STUDY IN ROAST LEVELS(continued)The Costa Rican samples brewed and poured.something inherent to the roast level caused this change. Theoccurrence of second crack happened at roast level 4, causingthermal expansion of the beans, creating a more porous cellstructure that allows for greater extraction, and thus increasedyield. However, a more thorough physical and chemicalinvestigation of this phenomenon would be required for aconclusive answer.pH is the measure of the acidity or alkalinity of an aqueous(water-based) solution, not the presence of organic acids. Asexpected, pH increased as the roast development darkened, withalmost a 1-point range overall. However, it was interesting toobserve the reduction of acidity, with pH data increasing, as theroast development increased to darker levels.continued on page 38CHART SECTION E: Acidity and BodyAcidity and Body Cupping Costa Rica8.58.07.5Level 1Level 2Level 3Level 4Level 5score7.06.56.05.55.04.5aciditybodyAcidity and Body Cupping Kenya9.08.5score8.0Level 1Level 2Level 3Level 4Level 57.57.06.56.036roastaciditybodyMa r c h Ap r i l 2 0 1537
A STUDY IN ROAST LEVELS(continued)The Costa Rican tasting samples, hot and cold.Summary of ObservationsSee Chart Section E, page 36This was a project of discovery, not an experiment to prove ordisprove a theory. Our team was excited to collect the technicaldata for the various roasts of these two coffees and genuinelycurious regarding the outcome of these evaluations. Wereminded ourselves that quantifying the intensity of attributesas well as the quality of sensorial characteristics does notalways equate to consumer preference. Our goal was to usescientific tests to understand the effects of different roast levelson physical, chemical and sensorial attributes.Our research confirmed our expectations that sensoryperceptions change as roast development darkens for these twocoffees. For both the Costa Rican and the Kenyan coffees tested,lighter roasts were observed to have higher levels of intensityand quality for sensorial attributes than darker roasts.Our data further supported the common industryunderstanding that “the lighter the roast, the greater theacidity; the darker the roast, the fuller the body.” As the roastsdeveloped darker, the perception of intensity and quality ofacidity diminished while the mouthfeel became more viscous.In addition to the specific attribute changes related to roastlevel, it is important to note the variations in final sensoryscores between cupping and tasting—or brewing—the samecoffees. This suggests that product development should notbe isolated in the laboratory but should consider consumerbrewing methods as well.COFFEE ANALYSTSis an independent coffee testing laboratorycertified by the Specialty Coffee Association of America. The company doesnot sell coffee; it tests coffee. The Coffee Analysts team specializes in theevaluation and improvement of coffee programs and supports quality programsthroughout the global farm-to-cup coffee supply chain. Coffee Analysts staffincludes Tobin Jordan, Peter Montane, Gwen Toohey, Vince Caloiero, DavidMorrill, Spencer Turer and Dan Cox.38roastMa r c h Ap r i l 2 0 1539
to utilize two sensory protocols: cupping, as the standard professional analysis; and tasting, or evaluating brewed beverages from the consumer perspective. For consistency, we used the standard Specialty Coffee Association of America (SCAA) cupping form as the scoring method. Following