Transcription
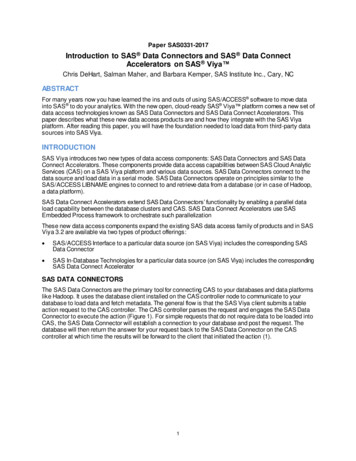
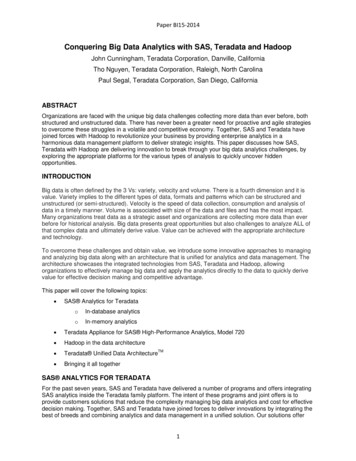
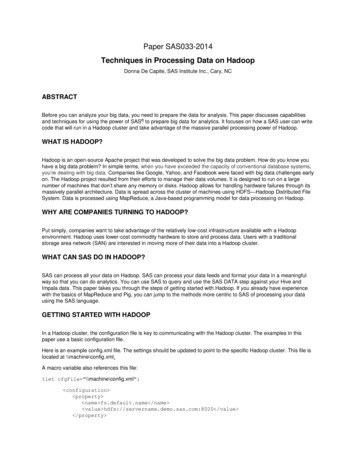
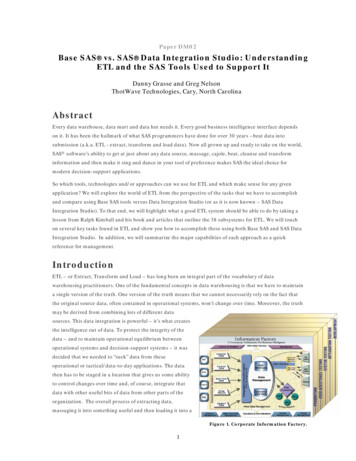
Paper DM02Base SAS vs. SAS Data Integration Studio: UnderstandingETL and the SAS Tools Used to Support ItDanny Grasse and Greg NelsonThotWave Technologies, Cary, North CarolinaAbstractEvery data warehouse, data mart and data hut needs it. Every good business intelligence interface dependson it. It has been the hallmark of what SAS programmers have done for over 30 years –beat data intosubmission (a.k.a. ETL - extract, transform and load data). Now all grown up and ready to take on the world,SAS software’s ability to get at just about any data source, massage, cajole, beat, cleanse and transforminformation and then make it sing and dance in your tool of preference makes SAS the ideal choice formodern decision-support applications.So which tools, technologies and/or approaches can we use for ETL and which make sense for any givenapplication? We will explore the world of ETL from the perspective of the tasks that we have to accomplishand compare using Base SAS tools versus Data Integration Studio (or as it is now known – SAS DataIntegration Studio). To that end, we will highlight what a good ETL system should be able to do by taking alesson from Ralph Kimball and his book and articles that outline the 38 subsystems for ETL. We will touchon several key tasks found in ETL and show you how to accomplish these using both Base SAS and SAS DataIntegration Studio. In addition, we will summarize the major capabilities of each approach as a quickreference for management.IntroductionETL – or Extract, Transform and Load – has long been an integral part of the vocabulary of datawarehousing practitioners. One of the fundamental concepts in data warehousing is that we have to maintaina single version of the truth. One version of the truth means that we cannot necessarily rely on the fact thatthe original source data, often contained in operational systems, won’t change over time. Moreover, the truthmay be derived from combining lots of different datasources. This data integration is powerful – it’s what createsthe intelligence out of data. To protect the integrity of thedata – and to maintain operational equilibrium betweenoperational systems and decision-support systems – it wasdecided that we needed to “suck” data from theseoperational or tactical/data-to-day applications. The datathen has to be staged in a location that gives us some abilityto control changes over time and, of course, integrate thatdata with other useful bits of data from other parts of theorganization. The overall process of extracting data,massaging it into something useful and then loading it into aFigure 1. Corporate Information Factory.1
non-volatile environment or data warehouse is referred to as ETL.Note that data in the diagram above flows from left to right. As it leaves the operational systems, it isintegrated, conformed and made useful by the ETL process. (Diagram above adapted from Imhoff & Sousa,2002).Since the mid 1980s, we have learned a lot about what is practical and useful as it relates to data warehousedesign as well as what things should happen in these processes. One of the thought leaders in this area hasbeen Ralph Kimball. From his early days, he described a number of design patterns that was eventuallyknown as “dimensional” data warehouse design (Kimball, 1996; Kimball & Margy, 2002). As SASprogrammers, we know intuitively that Dr. Kimball was right. For example, the idea of writing reports thatrequire understanding, navigating and eventually joining data contained in a 3rd normal form relationaldatabase was depressing at best. In his first book (Kimball, 1996), he described the necessary design thatwould make the data not only useful, but that gave us the ability to capture changes in dimensions.Subsequent to this early work, Dr. Kimball has blessed us with a rich history of articles and commentary onthe state of data warehousing. One area that recently was publicized was his work on best practices for ETL.In his seminal article, “The 38 Subsystems of ETL: To create a successful data warehouse, rely on bestpractices, not intuition,” Dr. Kimball described the necessary components that every ETL strategy shouldcontain.Note that we used the term “strategy” and not tool or system. It is clear from reading his article andsubsequent book that he is not giving us a cook-book approach to ETL, but rather an integrative look for howwe should approach ETL.Later in this paper, we will attempt to categorize those 38 subsystems and apply what we know about SAS tohow these might be handled in SAS. Specifically, we wanted to take the user through some of the morecommon tasks that we would ask of any ETL tool (i.e., software) and compare what we can reasonable dowith Base SAS and SAS Data Integration Studio, a modern ETL tool that supports GUI-based development.Evolution of SASBefore we dive into Kimball’s review of what subsystems are required for a good ETL strategy, let’s first talkabout SAS as a toolset. SAS has been around for over 30 years – starting out in academic research as a set offoundational tools for statistical analysis. One of the early inventions at SAS was the DATA Step. The DATAStep, SAS software’s answer to how we process records of data, is still a core component of the SAS System.Over time, SAS recognized that in order to satiate the need for statistically derived results, you had to notonly massage or transform the data but also present that data in meaningful and relevant ways. As SASevolved from a set of PROCs (procedures) and the DATA step to an entire platform for decision support, so.too, the tools evolved from a 4GL (4th Generation language) to something more akin to what users need tobuild complex data warehouse, business intelligence and advance analytics applications. So as we thinkabout just one piece (ETL) within that entire information architecture, let’s not forget that a clear benefit ofSAS is that it does answer the call for an integrated, emprise-class platform.ETL Best PracticesAs Kimball cites in his article, we typically spend about 70 percent of our time in data warehousing “doing”ETL. What are these tasks/activities or as Kimball called them “subsystems” of ETL all about? First, let’s2
categorize them into a subset of concepts that we could reasonably cover in paper of this type. As we startedto dissect Kimball’s 38 subsystems, we decided the following six areas were represented well enough to showvalue in this paper. These include:1.Design and data profiling.2.Source data extraction.3.Transformation and loading.4.Change data capture.5.Quality review, auditing and exception handling/management.6.Integration with the production environment and business process components.While we don’t pretend to cover all 38 subsystems in detail, categorizing them into these six major areasproves helpful in evaluating the capabilities within SAS. Below we briefly describe which of the 38subsystems aggregate up into these six areas of ETL “competency” and then describe how you wouldaccomplish these using a combination of SAS tools and our own best practices. Not everyone will agree 100percent on the best way to do any one thing in SAS. We do not expect our competitors in the SAS consultingspace to share our opinions on what is best practice, but after 20 years in the business and over 50enterprise-class, data-warehousing projects behind us, we think there are some lessons to be learned andshared.Design and Data ProfilingWhile Kimball makes no overt reference to data-warehouse design activities in his “38 sub-systems” article,there is clearly a strong undercurrent of “plan – design – replan” in his work. This is especially clear in hisnewer book on ETL (Kimball and Conserta, 2004). We strive for a good balance between up-front planningand design, but we also tend to be practical in our efforts. Like good decision makers, we try to make thosedesign decisions in the context of a good understanding of what is actually in the data. To that end, webelieve a logical and physical design for any data warehouse should include a healthy dose of reality. Makesure you build time into your process time to actually go out and explore the data. Look at the missingvalues. Is the cardinality in the data what you expected? I know, the data administrators told us that the datawas clean, is it?In Kimball’s article, we find the following subsystem most relevant here.3. Data profiling system. Column property analysis including discovery ofinferred domains, and structure analysis including candidate foreign key —primary relationships, data rule analysis, and value rule analysis.In SAS the critical first step is to look at the data -- generate listings, frequency counts and summarystatistics on the fields in the source data systems. The classic SAS programmer will no doubt recognize thisas one of those steps that they take without thinking. Over the years, we have all seen specialty macrospublished in papers and on Web sites that do exactly that kind of thing. Even in our own thinking data Toolkit for Data Warehousing we have a number of macros that automate the discovery of data anomalies.In the new world of GUI-based tools, it is really quite easy to get a quick understanding of your data beforeyou make fundamental design decisions. DataFlux, a wholly owned subsidiary of SAS, has created a flagshipproduct, DataFlux dfPower Software, that allows you to visually inspect your data quickly and withoutprogramming. It is designed for the business user or IT analyst to support data profiling via an intuitive3
point-and-click interface. This solution allows users to connect directly to their data sources andautomatically discover and correct data quality issues. As a design time tool, dfPower helps usersunderstand important information about the quality of their data and includes column-level statistics (e.g.,count, null & blank counts, min, max, etc.), frequency distributions (including pattern counts anduniqueness useful in determining de-duplication/cleansing strategies) as well as relationship analysis andoutlier analysis. Relationship analysis helps uncover redundant values across multiple tables, i.e., helps youhighlight orphaned records.Unfortunately in Data Integration Studio, we don’t find much in the way of data profiling other than whatyou can do in Base SAS – namely what you could get out of a PROC Contents. Integration with dfPowermight be recommended.Source Data ExtractionSAS software has the ability to get at just about any data source in the world. From relational databasesystems to legacy mainframe systems to flat file and proprietary applications, SAS can either access themnatively (native access engines) or through any number of methods including ODBC/JDBC or openstandards supported with SAS Integration Technologies. As a foundation, these are supported in both BaseSAS as well as tools like Data Integration Studio. In the Fall of 2005/ Winter of 2006, DataFlux software willbe able to take advantage of SAS’ extensive access engines.Kimball gave direct reference to data extraction in one of his subsystems:1. Extract system. Source data adapters, push/pull/dribble job schedulers,filtering and sorting at the source, proprietary data format conversions, anddata staging after transfer to ETL environment.From our read of this subsystem, we wanted to comment on the following attributes. Source data adapters (including data conversions and filters).oAs mentioned above, SAS can access just about any known data source through theirnative access engines and open standards approaches. This functionality is surfaced inboth Base SAS and Data Integration Studio through metadata.oThe SAS System has over 200 numeric, character and date conversion routines orfunctions that allow for complex manipulations on the data. These are accessible throughboth the DATA Step and through PROC SQL. By definition these are also available in DataIntegration Studio.oData Integration Studio has built-in access to all SAS formats and conversion features.Whenever a datum is accessed, in-formats, formats, mathematical manipulations,substring-ing, etc., can all be applied through its GUI interface. And, as described below,you can always make ‘user exits’ – calls to custom SAS code - to accomplish the step. Push/pull/dribble.oWe will touch on this later when we talk about how you might productionize the ETLprocess, but there are a number of methods to feed a SAS process – whether we pull datafrom the source system, push it out, in real time or staged, or create a mechanism forslowly feeding the data throughout the day. Filtering & Sorting.4
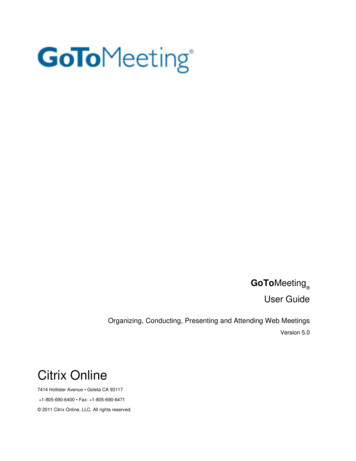
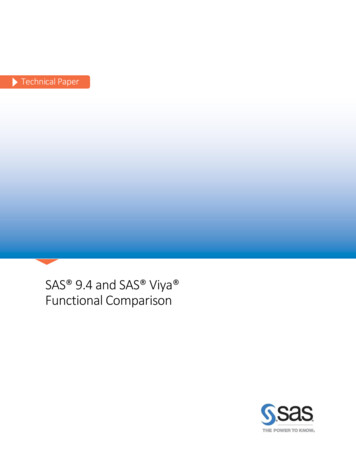
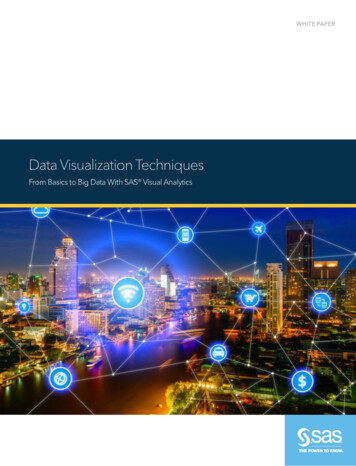
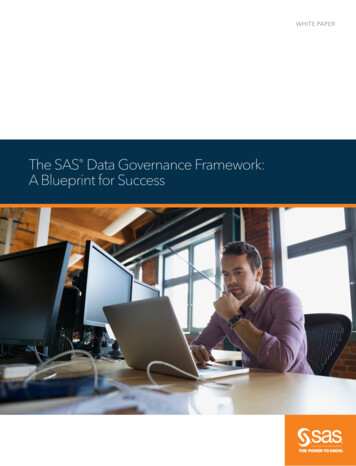
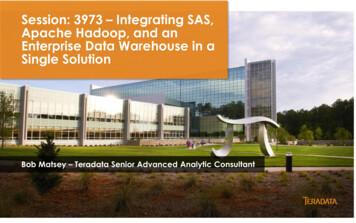
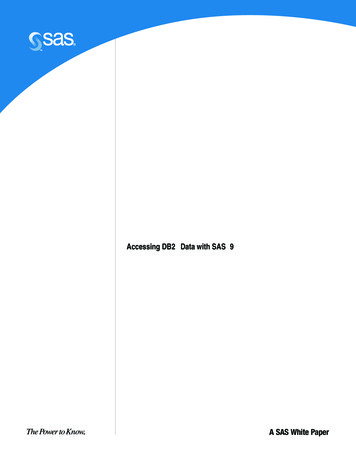
oBase SAS has conditional logic support (‘if-then-else’), so you can act on whateverobservations or columns you wish. Data Integration Studio has a built-in extracttransform that provides this need.Figure 2. Data Integration Studio: Dropping a column while extractingfrom a source table.oIn the provided images you see that a subset of columns is pulled across, and only thoserows matching the condition are retained. We’ve found it useful to pull across exactly therows /columns needed in the ‘E’ of ETL for the subsequent ‘T’. If additional columns areneeded later, pulling them through is simple in Data Integration Studio.Figure 3. Data Integration Studio: filter out rows on some criteria using the‘where clause’ builder.5
Data staging (versus accessing).oSAS doesn’t require the data to be staged separately from the source system, although it iscertainly possible. That is, data can be accessed in place in its native form without havingto land the data a second time.Transformation and LoadingThose of us who have been involved in ETL for a while will quickly realize that transformation and loading istruly the meat and potatoes of the data warehouse. This is where we do the magic that connects sourcesystems and target systems to create usable data huts for consumption. Our methodology calls for thecreation of design documents around how this mapping should occur. In fact, we call for an SMT documentthat is integral to the design of a data warehouse. SMT stands for source-movement-target, and is adocument that describes what is to be accessed; including formats and expected values, how it should bemoved or transformed, and what the target values should look like (again, expected values, conformeddimensions, etc.). This design document is an essential tool for ensuring that everyone involved is speakingthe same language. Its detail is the ‘one version of the truth’ for mapping the source data to the final targetstructure. This is especially useful with Data Integration Studio since, when creating a job in the ProcessDesigner, you work backward. Knowing what the target table should look like is pretty much a requirement.Throughout Kimball’s work, he spends a considerable amount of time and effort making sure we understandthe role of the transformation and loading parts of ETL. In his article, he gave reference to 16 of hissubsystems that pertained to our ability to beat data into submission and get it into the right format for thetarget tables. Those included the following:5. Data conformer. Identification and enforcement of special conformeddimension attributes and conformed fact table measures as the basis for dataintegration across multiple data sources.9. Surrogate key creation system. Robust mechanism for producing streamof surrogate keys, independently for every dimension. Independent of databaseinstance, able to serve distributed clients.12. Fixed hierarchy dimension builder. Data validity checking andmaintenance system for all forms of many-to-one hierarchies in a dimension.13. Variable hierarchy dimension builder. Data validity checking andmaintenance system for all forms of ragged hierarchies of indeterminate depth,such as organization charts, and parts explosions.14. Multivalued dimension bridge table builder. Creation and maintenanceof associative (bridge) table used to describe a many-to-many relationshipbetween dimensions. May include weighting factors used for allocations andsituational role descriptions.15. Junk dimension builder. Creation and maintenance of dimensionsconsisting of miscellaneous low cardinality flags and indicators found in mostproduction data sources.16. Transaction grain fact table loader. System for updating transactiongrain fact tables including manipulation of indexes and partitions. Normallyappend mode for most recent data. Uses surrogate key pipeline (see subsystem19).17. Periodic snapshot grain fact table loader. System for updating periodicsnapshot grain fact tables including manipulation of indexes and partitions.Includes frequent overwrite strategy for incremental update of current periodfacts. Uses surrogate key pipeline (see subsystem 19).6
18. Accumulating snapshot grain fact table loader. System for updatingaccumulating snapshot grain fact tables including manipulation of indexes andpartitions, and updates to both dimension foreign keys and accumulatingmeasures. Uses surrogate key pipeline (see subsystem 19).19. Surrogate key pipeline. Pipelined, multithreaded process for replacingnatural keys of incoming data with data warehouse surrogate keys.20. Late arriving fact handler. Insertion and update logic for fact records thathave been delayed in arriving at the data warehouse.21. Aggregate builder. Creation and maintenance of physical databasestructures, known as aggregates that are used in conjunction with a queryrewrite facility, to improve query performance. Includes stand-alone aggregatetables and materialized views.22. Multidimensional cube builder. Creation and maintenance of starschema foundation for loading multidimensional (OLAP) cubes, including specialpreparation of dimension hierarchies as dictated by the specific cube technology.23. Real-time partition builder. Special logic for each of the three fact tabletypes (see subsystems 16, 17, and 18) that maintains a "hot partition" in memorycontaining only the data that has arrived since the last update of the static datawarehouse tables.24. Dimension manager system. Administration system for the "dimensionmanager" who replicates conformed dimensions from a centralized location tofact table providers. Paired with subsystem 25.25. Fact table provider system. Administration system for the "fact tableprovider" who receives conformed dimensions sent by the dimension manager.Includes local key substitution, dimension version checking, and aggregate tablechange management.While we don’t have the time nor energy to comment on each of these in detail, we “thot” it would beimportant to talk about a few of them. Conforming dimensions and facts.oIntegrating data from multiple sources and formats is a key component to successful datawarehousing. Data integration means creating one version of the truth in how wereference information – particularly dimensions. If one system used male and female andanother M and F, we normalize these values into a single set of values – most likely theones that provide business value to those reporting on the data.oTo normalize the data, we not only make the data structurally identical, but also filter outinvalid values, standardize the content, de-duplicate the values and create that singleversion of the truth. Common tasks for software in this process includes standardizing,matching and surviving – or populating the target tables with those that are deemed as“good”.oIn Base SAS we have a tremendous amount of functionality at our disposal for doing thematching and retention of good values. In Data Integration Studio, we have standardtransformations as well as the ability to create customer transformations that can bedropped onto the process editor. And in DataFlux software, we have a robust library totransformation routines that not only helps us profile the data for quality, but alsoproductionizes the standardization process. Creation of surrogate keys.oA surrogate key is an identifier that is c
about SAS as a toolset. SAS has been around for over 30 years – starting out in academic research as a set of foundational tools for statistical analysis. One of the early inventions at SAS was the DATA Step. The DATA Step, SAS software’s answer to how we process records of data, is still a core component of the SAS System.File Size: 614KB