Transcription
The Justice System — Judicial Branch,Adult Corrections, and Youth CorrectionsJudicial BranchBranch Overview. One of three branches of Colorado state government, the JudicialBranch interprets and administers the law, resolves disputes, and supervises offenders onprobation. The Chief Justice of the Colorado Supreme Court, selected by the justices of the Court,is the executive head of the Branch. The justices also appoint a State Court Administrator tooversee the daily administration of the Branch and provide technical and administrative support tothe courts and probation. The General Assembly has established 22 judicial districts within thestate. The state court system consists of four primary courts, described below. The GeneralAssembly establishes the number of justices and judges at each level of the state court system1.1. County Courts have limited jurisdiction, handling civil cases under 15,000,misdemeanors, civil and criminal traffic infractions, felony complaints, protection orders,and small claims.2. District Courts have general jurisdiction, handling felony criminal cases, large civilcases, probate and domestic matters, cases for and against the government, as wellas juvenile and mental health cases. Water Courts (which are divisions of districtcourts) have exclusive jurisdiction over cases concerning water matters. There areseven water courts, one in each of the major river basins in Colorado.3. The Colorado Court of Appeals hears cases when either a plaintiff or a defendantbelieves that the trial court made errors in the conduct of the trial. The Court of Appealsalso reviews decisions of several state administrative agencies.4. The Colorado Supreme Court also hears appeals, but only when it considers the casesto have great significance. The Supreme Court may also answer legal questions fromthe General Assembly regarding proposed laws. The Supreme Court is alsoresponsible for overseeing the regulation of attorneys and the practice of law, and forreviewing judges standing for retention during elections.Municipal courts and Denver's county court are not part of the state court system, and they arefunded by their respective local governments.The Branch is also charged with supervising offenders on probation. Managed by the chiefprobation officer in each judicial district, 1,200 employees prepare assessments and provide presentence investigation services to the courts, supervise offenders sentenced to communityprograms, and provide notification and support services to victims. Investigation and supervisionservices are provided based on priorities established by the Chief Justice and each offender's riskof re-offending.1Legislation changing the number of Supreme Court justices or district court judges requires a 2/3 majority in each house[Article VI, Sections 5 and 10 of the State Constitution].November 2012Page 1
Finally, the Branch includes four independent agencies:1. The Office of the State Public Defender (OSPD) provides legal representation forindigent defendants in criminal and juvenile delinquency cases where there is apossibility of being jailed or imprisoned. The OSPD is comprised of a centraladministrative office, an appellate office, and 21 regional trial offices. The OSPDemploys about 650 individuals including attorneys, investigators, and support staff.2. The Office of Alternate Defense Counsel oversees the provision of legal representationto indigent defendants in criminal and juvenile delinquency cases when the OSPD hasan ethical conflict of interest. This office provides legal representation by contractingwith licensed attorneys and investigators across the state.3. The Office of the Child's Representative oversees the provision of legal representationto children and youth involved in the court system, primarily due to abuse, neglect, ordelinquency. Generally, the Office provides legal representation by contracting withapproximately 250 licensed attorneys to serve as guardians ad litem (GALs).4. The Independent Ethics Commission hears complaints, issues findings, assessespenalties, and issues advisory opinions on ethics-related matters concerning publicofficers, state legislators, local government officials, or government employees.Appropriations to the Branch for FY 2012-13 include nearly 4,300 FTE and 508 million,including 352 million General Fund (69%), 133 million cash funds (26%), with the remainder fromreappropriated funds and federal funds.Population Served and Primary Services Provided. In FY 2011-12, approximately788,000 cases were filed in the state court system, including 493,000 (63%) in county courts,290,000 (37%) in district courts, 2,700 in the Court of Appeals, and 1,500 in the Supreme Court.In June 2012, approximately 69,000 adults and 5,500 juveniles were under probationsupervision. Of the adults, 49,000 were supervised by state staff and 20,000 were supervised byprivate probation providers. Treatment services provided to individuals on probation include:substance abuse testing and treatment, sex offender assessment and treatment, mental healthtreatment, domestic violence treatment, transportation assistance, emergency housing, educationand vocational assistance, and restorative justice.In FY 2011-12, the OSPD provided legal representation to indigent clients in approximately120,500 cases. Of these cases, 47 percent concerned felonies, 45 percent concernedmisdemeanors, and the remainder were juvenile cases. The Office of the Alternate DefenseCounsel provided legal representation to clients in approximately 12,600 cases. The Office of theChild's Representative provided legal representation for approximately 13,000 court appointments(an appointment may involve more than one case, and more than one child or youth).Factors Driving the Budget - Caseload Growth Drives Need for Budget Increases.The main factor driving the Branch's budget is caseload. Judges, defense attorneys, guardiansad litem, probation officers, and court staff can only handle so many cases per year. As thecaseload grows, so does the need for resources if the Branch is to continue fulfilling itsconstitutional and statutory duties in a timely and professional manner. Caseload growth isgenerally driven by increases in state population, changes in the state's economic climate (whichaffect both the crime rate and the proportion of clients requiring state-funded representation), andNovember 2012Page 2
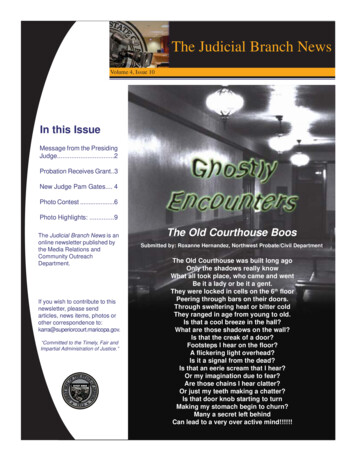
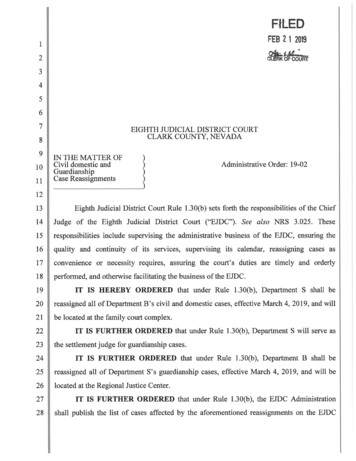
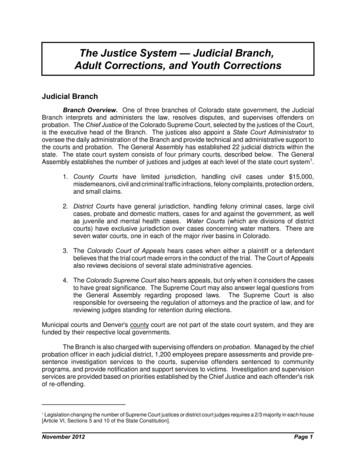
legislative changes. Workload is also impacted by the types of cases filed, as some cases requiremore time and resources than others. Figure 1 depicts the number of cases filed in county anddistrict courts in each of the last ten fiscal years, by case type.Figure 1District and County Court FilingsFY 2002-03 through FY 2011-12The total number of county and district case filings has increased by 23 percent over the last tenfiscal years, with a compound annual growth rate of 2.1 percent. The most significant increase hasoccurred in civil cases, and in particular cases concerning tax liens and foreclosures. While somecivil cases can require a significant amount of judge and staff time, the majority do not.Fortunately, filings of some of the case types that do have a significant workload impact -- felonycriminal, dependency and neglect (D&N), and juvenile delinquency cases -- have declined over thelast several years.The three independent agencies affected by county and district court caseload growth areimpacted differently, based on the clients they are charged with representing. The compoundannual rate of caseload growth experienced by each agency since FY 2003-04 is as follows: Office of the State Public Defender: 2.4 percent (active cases)Office of the Alternative Defense Counsel: 1.6 percent (paid cases)Office of the Child's Representative: 2.3 percent (paid cases)November 2012Page 3
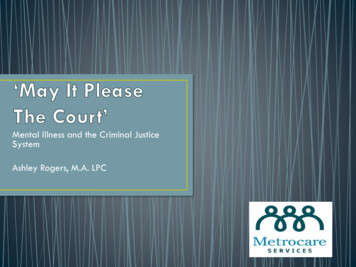
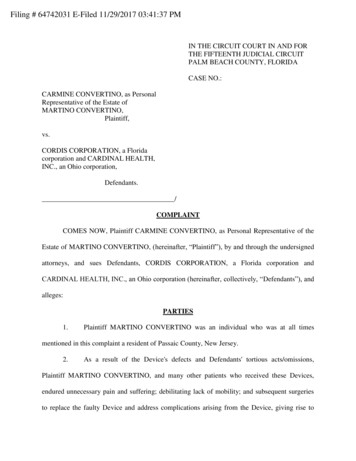
Department of CorrectionsDepartment Overview. The primary responsibility of the Department of Corrections' (DOC)is to supervise adult offenders sentenced to prison by the courts as the result of a felony conviction.The department manages 16 state-owned and operated correctional facilities and contracts withfour privately-operated prisons. The department is also responsible for supervising offenders whoare sentenced to Colorado's Youthful Offender System, "transition" offenders who are acceptedinto community corrections programs prior to being paroled, and offenders who are placed onparole by the Parole Board.Population Served. As of Oct. 1, 2012, the Department of Corrections supervised 20,628offenders with inmate status, 9,252 with parole status, and 272 in the Youthful Offender System.Sixty seven percent of the offenders with inmate status are in state prisons, 19% are in privateprisons, 10% are in community corrections facilities, 3% are in the community being supervisedunder the state's "Intensive Supervision - Inmate" program, and 1% are in county jails. Theseinmate-status offenders are 91% male, 9% female, 44% Caucasian, 33% Hispanic/Latino, 19%African American, 3% Native American, and 1% Asian. Seventy-six percent have moderate tosevere substance abuse problems, 32% have moderate to severe mental health problems, 53%have moderate to severe vocational needs, 25% have moderate to severe educational needs, and4% are developmentally disabled. The average age is 37 years.Primary Services Provided. The department's operational responsibilities include inmatecare (such as food, clothing, medical, and housing and security), inmate programs (such aseducation, labor, and recreation), and facility maintenance. In addition, the department providestreatment services for inmates, including sex offender treatment, substance abuse treatment, andmental health treatment.Factors Driving the Budget. The following chart shows the Department of CorrectionsGeneral Fund appropriations since the 1980's.To enhance year-to-year comparisons, the dotted lines in this chart include American Recovery andReinvestment Act (ARRA) federal funding that the state used to support prisons. This temporaryfunding displaced Department of Corrections General Fund appropriations, freeing the money tobe used elsewhere in the budget.November 20124Page 4
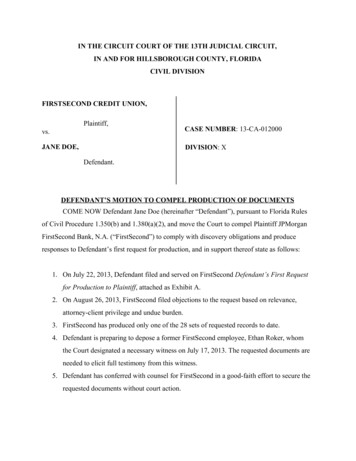
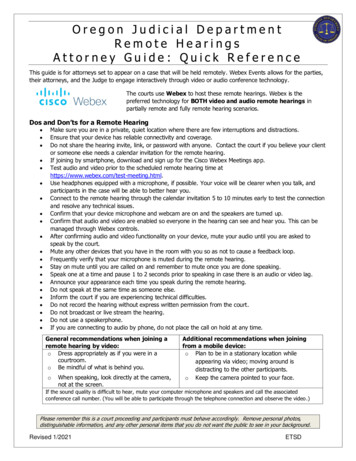
From FY 1984-85 to the peak in 2008-09, General Fund appropriations grew at an average rateof 11.3 percent. In inflation adjusted terms, appropriations grew an average of 8.1 percentannually. These rates far exceed the state's average annual population growth rate of 1.8% overthis period. What was happening?The Department's budget depends in substantial part upon the Department's caseload, which hastwo key components: The number of offenders that the Department must house in prisons; andThe number parole offenders that the Department must supervise.The following diagram shows Colorado's inmate and parole populations since the mid1980's. Both populations increased prior to July 2009 and subsequently declined, mirroring anationwide trend. The inmate population reached a peak in June 2009 of 23,186 and subsequentlydeclined at an average annual rate of 1.0% to 21,037 inmates by the end of June 2012. Thisdecline since 2009 has led the state to close two prisons and close one living unit at each of threeother prisons.Colorado's parolee population, shown in the next diagram, has followed a similar, butslightly more ragged course, peaking in 2009 at 9,016 and subsequently declining at an averageannual rate of 0.8% to 8,350 by the end of June 2012.November 20125Page 5
The number of incarcerated offenders in Colorado's prisons depends upon three factors:the States's adult population, the proportion of that population that is sentenced to prison (the"sentence rate"), and the average length of stay once an offender arrives in prison. The sentencerate can change for a number of reasons, including Legislative changes that define new crimes punishable with DOC incarceration or alterthe definitions of existing crimes.Changes of the proclivity of Colorado residents to commit crime, which may be linkedto changes in the relative size of the "at risk" population (those aged 19 to 39, who aremore likely to commit crime) and to other factors, such as the effectiveness of theeducation system, the effectiveness of the criminal justice system in deterring crime,and the ability of the criminal justice system to alter the criminal tendencies of thosewho previously committed crimes and already have been through the justice system.Changes in the rate at which law enforcement arrests criminals, the rate at whichprosecutors obtain convictions, and the rate at which convicted offenders are sentencedto DOC.The duration of incarceration depends upon a number of factors, including The presumptive sentence range prescribed in law for the various classes of felonies,The rules that determine the date on which an offender is first eligible for parole and thedate by which an offender must be released from prison. These rules include "earnedtime" reductions, which offenders receive for good behavior.The willingness of the parole board to release offenders who have reached their paroleeligibility date but are not yet at their mandatory release date, when they must beparolled.The amount of extra time a typical parolee is reincarcerated for violating his conditionsof parole.If the state's population grows steadily while the sentence rate and the average duration of stayremain constant, the prison population will grow at the same rate as the state population. OffendersNovember 20126Page 6
departing prison will be replaced with a slightly larger number of new arrivals, reflecting statepopulation growth. If these factors change, the resulting adjustments to the prison population willplay out over a period that reflects the distribution of prison terms among offenders. These termsaverage 36 months, but range from one year to 40 (the expected stay for the 2.5% of offenderswho arrive at DOC with life sentences). Thus half the response to a General-Assembly-mandatedchange the average offender sentence will occur in about three years.Youth CorrectionsDivision Overview. Youth involved in the criminal justice system are primarily theresponsibility of the Division of Youth Corrections (DYC) in the Department of Human Services.DYC has four primary areas of responsibility: (1) providing housing, education, and treatment tocommitted youths; (2) providing housing and supervision to detained youths; (3) supervisingjuveniles placed on parole; and (4) providing funding and technical support for local jurisdictionsfor alternatives to incarceration, through SB 91-94 funds.Committed Youth. Committed youth are juveniles who are adjudicated and are placed inthe legal custody of the DYC by the courts. During FY 2011-12, the DYC was responsible for 983committed youth, who had an average length of stay of 18.3 months. Based on FY 2009-10 data(the most recent available), of newly-committed youth, 88 percent are male, 12 percent are female,and the average age at commitment is 16.1 years old. The racial profile of these inmates is asfollows: 43.3 percent White, 36.2 percent Hispanic, 18.6 percent African American, and1.3 percentNative American, with the balance Asian or "Other".The department's operational responsibilities include facility maintenance, inmate care(such as food, clothing, medical, and housing and security), and inmate programs (such aseducation, labor, and recreation). In addition the department provides treatment services forinmates, including sex offender treatment, drug/alcohol treatment, and mental health treatment.During FY 2011-12, the State supervised 44 percent of the committed youth in secure stateoperated facilities. The remainder were supervised in privately operated facilities, includingfacilities that were state owned but privately operated.Commitment Population Trends. From FY 1989-90 to FY 2004-05, as the statepopulation increased by 43 percent, the average daily population (ADP) of committed youth nearlytripled from 513 ADP to 1,454 ADP. However, during the first two months of FY 2012-13, theaverage daily population was just 896, representing a decline of over 38 percent from the FY 200405 peak. The population decline has reduced placements in both contracted and state-operatedfacilities and led to the closure of one of the seven state commitment facilities in FY 2011-12,among other impacts.Parole Services. Legislation requiring mandatory parole for all committed juvenilesproduced a large increase in the parole population in the late 1990s. When the period ofmandatory parole was reduced to six months, through S.B. 03-284, the parole population fell.Since that time, the parole population has largely mirrored, but lagged, changes in the commitmentpopulation. After reaching its most recent peak of 522 in FY 2006-07, the average daily parolepopulation declined to 363 for FY 2011-12.Detained Youth. This population includes youth held by law enforcement while awaitingadjudication plus adjudicated youth who have been sentenced by the courts to detention for aperiod up to 45 days. Youth stayed an average of 14.5 days in FY 2012-13. The state operatesNovember 20127Page 7
eight detention facilities (including some which serve both detained and committed youth) andcontracts for 17 detention beds. Detention facilities are similar in their role to county-operated adultjails. In the 2003 legislative session, the detention population was capped statutorily at a dailymaximum of 479 youth. This cap was further reduced in the 2011 session to 422. The detentionpopulation has continued to decline, and the average daily population in FY 2011-12 was 316.Alternatives to Secure Placement - S.B. 91-94. In response to rapid increases in thenumber of committed and detained youth, the legislature authorized funding in 1991 for localjurisdictions to provide alternatives for juvenile incarceration (SB 91-94 programs). This fundingis believed to be a contributing factor in reducing the use of secure detention and commitmentbeds, along with other factors that have reduced youth arrests and involvement in the criminaljustice system in Colorado and the nation.Factors Driving the Budget. The size of the population served, and particularly thepopulation of committed youth, is a significant factor driving the youth corrections budget.However, funding increases and declines are also substantially affected by legislative policydecisions. As described above, the number of youth served by the Division has declined in everycategory since the mid-2000's. From FY 2006-07 through FY 2008-09, the General Assemblychose to retain funding in the budget, even as the population declined, in order to improve thequality of services. Then, in light of statewide budget constraints, cuts were applied from FY 200809 through FY 2011-12. In FY 2012-13, funding was increased, despite a decline in the populationserved, to eliminate overcrowding in state facilities. Due to such changes in policy from year-toyear, overall appropriations for youth corrections have not consistently tracked the size of thepopulation.November 20128Page 8
Legislative Staff ContactsOffice of Legislative Legal ServicesMichael Dohr (303-866-4347)Legislative Council StaffJessika Shipley - House Judiciary Committee; Fiscal Notes (303-866-3528)Hillary Smith - Senate Judiciary Committee; Fiscal Notes (303-866-3277)Joint Budget Committee StaffCarolyn Kampman - Judicial Branch (303-866-4959)Steve Allen - Department of Corrections (303-866-4961)Amanda Bickel - Youth Corrections, Department of Human Services (303-866-4960)November 20129Page 9
The Office of the Alternate Defense Counsel provided legal representation to clients in approximately 12,600 cases. The Office of the Child's Representative provided legal representation for approximatel