Transcription
The Physician Assistant Workforce In North Carolina anda Potential Physician Assistant Program at Winston-SalemState UniversityJulie C. Spero, MSPH and Zahabiya Petiwala, MBAJanuary 2018IntroductionBackgroundThe 2017 NC Appropriations Act of2017 (N.C.S.L. 2017-57) mandated thatthe Board of Governors (BOG) of theUniversity of North Carolina study thefeasibility of establishing a physicianassistant (PA) program at Winston-SalemState University (WSSU). The ShepsCenter for Health Services Research atthe UNC-Chapel Hill was asked by theUNC General Administration to conducta study to inform decision-makingabout the establishment of this program.Specifically, this study examines thecurrent supply of PAs in NC includingdemographic trends, practice locations,demand for services, and educationaltrends. This study does not examine thecosts and financing for a new school.Physician assistants (PAs) are licensed by the NCMedical Board to practice medicine under thesupervision of a physician, which may includeexamining patients, reviewing lab findings,diagnosing patients, developing a treatment plan,prescribing medication, or assisting in surgery. PAsare trained at the master’s degree level and usuallycomplete their degree in roughly two years. SomePAs choose to complete a residency before enteringpractice, but residency training is not required.Winston-Salem State University (WSSU) is ahistorically Black university (HBCU) in WinstonSalem, North Carolina. WSSU has a schoolof health sciences offering undergraduate,graduate, and professional degrees. Fields ofstudy include: nursing, occupational therapy,physical therapy, rehabilitation counselling,clinical laboratory science, exercise physiology,and health management. WSSU is ranked firstin NC and eighth nationally for graduatingProgram on Health Workforce Research & PolicyThe Cecil G. Sheps Center for Health Services ResearchThe University of North Carolina at Chapel HillCampus Box 7590 725 Martin Luther King Jr. Blvd. Chapel Hill, NC 27599-7590http://www.healthworkforce.unc.edu nchp@unc.edu Twitter: @UNC PHWRP Facebook: @uncworkforce
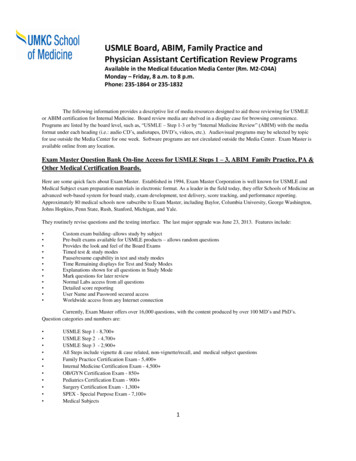
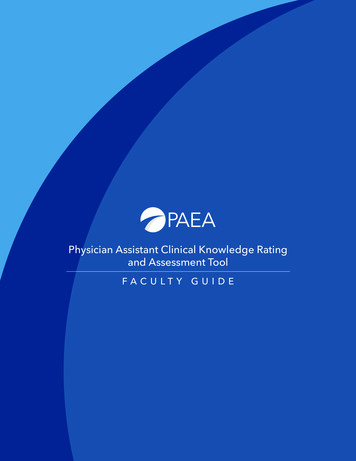
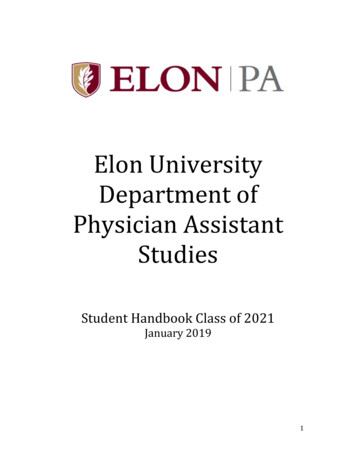
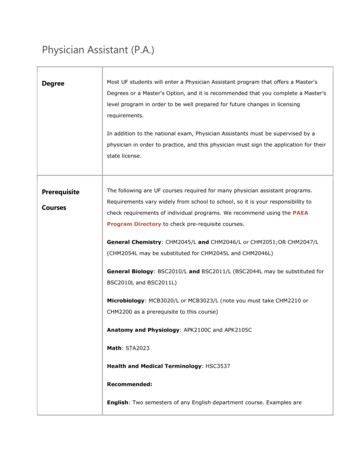
Black students in health professions, aswell as first in NC and fifth nationally forgraduating Black students in nursing.1The PA and the nurse practitioner (NP)workforces have grown rapidly in recent years,both in NC and in the US (Figure 3). NPsand PAs are often grouped together becauseeven though they are trained under differentmodels, they can fill similar positions and jobduties. For example, job postings may advertisefor a PA or an NP. As a point of comparison,there were 6,152 NPs in the NC workforce in2016, a ratio of 6.1 per 10,000 population.MethodsThis analysis used a mixed methodsapproach, employing both quantitativeand qualitative analyses to assess thedemand for and supply of PAs in NC.We conducted analysis on PA licensure datamaintained by the NC Health ProfessionsData System (HPDS). Descriptive statisticsPAs train as generalists but may specializeafter training. Some PAs and NPs switchspecialties after they have practicedin the workforce.2 (Figure 4)and cartographic analyses were used toanalyze and display data on PA supply,distribution, and diversity, including a mapof the location of PA programs in NC.DemographicsThe PA workforce is majority female, (64.5%,n 3,615). The average age is 41.1 years old, with77.3% (n 4,332) of the workforce younger thanage 50. Figure 5 describes the age structure ofthe active PA population in North Carolina.FindingsNC Phyisican Assistant Workforce TrendsIn 2016, there were 5,602 active, licensedPAs practicing in NC, with a state ratio of5.5 PAs per 10,000 population (Figures 1, 2).PAs are less diverse than the NC population,with 4.7% (n 263) identifying as Black,Figure 1. Physician Assistants per 10,000 Population, North Carolina, 2016WSSUAlleghanySurryWarrenNorthamptonGatesCa Curm ritde ucn kPerquimansktanuosqPaStokes Rockingham Caswell urhamGraChowanHertfordHalifaxYadkin eyNashxantoMadisonEdgecombeAleIredellTyrrell ncombe Rate per 10,000 population(# of counties)0 (4)less than 2.9 (40)2.9 to 5.8 (38)5.8 to 8.6 (12)8.6 to 12.0 (4)12.0 to 14.0 ickNewHanoverNotes: Data include all active, instate PAs licensed in North Carolina as of October 31 of the respective year. Sources: North Carolina Health Professions DataSystem, https://nchealthworkforce.sirs.unc.edu, with data derived from the North Carolina Medical Board, 2016. Population data downloaded from the NorthCarolina Office of State Budget and Management via NC LINC and are based on US Census data. Produced by: The Program on Health Workforce Research andPolicy, Cecil G. Sheps Center for Health Services Research, University of North Carolina at Chapel Hill.2
Figure 2. Growth of the Physician Assistant Workforce, North Carolina, 2000-2016b. Total Number of PAs in North Carolinaa. PAs per 10,000 Population in North Carolina5.55,6024.04,0002.32.002016Figure 3. Cumulative Rate of Growth per 10,000 Populationin North Carolina Since 2000: Physicians, NursePractitioners and Physician Assistants100Physicans19%50Percent in Primary CarePercent Growth Since 2000PAs136%1502016Figure 4. Percent of Nurse Practitioners andPhysician Assistants Reporting a Primary CareSpecialty, 1997-2011, North CarolinaNPs194%2002000NPs 50%43%PAs 45%40%20199798020 0020 1020 20320042005200620020 7020 8020 9120 0120 1120 21320120 4120 rYearFigure 5. Active, Licensed Physician Assistants byAge Group, NC, 201633%n 5,60223%22%14%8%0.4%30 &under31-4041-5051-6061-7071-80Table 1. Diversity of the NC Population and Physician Assistants, 2016NC Populationn 10,146,788Black/African-AmericanPhysician Assistantsn 5,60222%5%Hispanic9%3%Asian/Pacific Islander3%2%American Indian/Alaskan 4%12%81%7% of PA s (n 133)were missing race data.Figure 6. Percent of PAs who were Underrepresented Minorities in North Carolina, 2000 to 201610%9%8%5%0%2000 2001 2002 2003 2004 2005 2006 2007 2008 2009 2010 2011 2012 2013 2014 2015 2016Notes: Figures 2, 5, 6; Table 1: Data include active, instate PAs licensed in North Carolina as of October 31 of the respective year. Underrepresentedminorities include PAs who self-identify as African-American, Hispanic, or American Indian/Alaska Native. Figures 3, 4: Data include active, instate, non-federal,non-resident-in-training physicians (Figure 3), and all active, instate PAs and NPs (Figure 4) licensed in North Carolina as of October 31 of the respective year.Specialty data were prepared in December 2012 and include a primary specialty of family practice, general practice, internal medicine, ob/gyn, or pediatricsfor PAs, and a physician extender type of family nurse practitioner, adult nurse practitioner, ob/gyn nurse or pediatric nurse practitioner for NPs. PA data for2010 and 2011 are excluded due to changes in the way specialty data were collected. Sources: North Carolina Health Professions Data System,https://nchealthworkforce.sirs.unc.edu, with data derived from the North Carolina Medical Board and North Carolina Board of Nursing, 2000 to 2016.Population data downloaded from the North Carolina Office of State Budget and Management via NC LINC and are based on US Census data. Produced by:The Program on Health Workforce Research and Policy, Cecil G. Sheps Center for Health Services Research, University of North Carolina at Chapel Hill.3
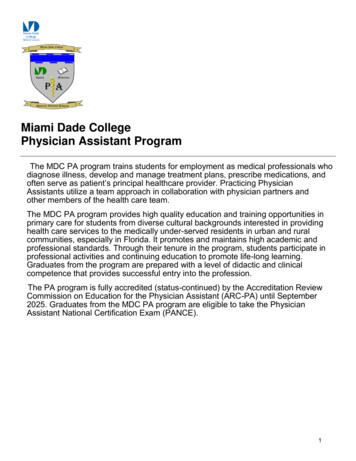
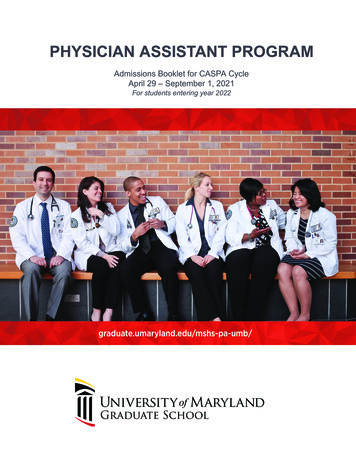
2.9% (n 162) identifying as Hispanic, and 0.7%(n 43) identifying as American Indian (Table 1).PAs in NC have not broadly diversified over thepast 16 years, and roughly the same percentage(8%) of PAs identified as an underrepresentedminority in 2016 as did in 2000 (Figure 6).The PA Job MarketIn 2016, the mean salary for PAs in NC was 100,480.3 The job prospects for PAs in NC arecurrently good. There are no current reportsof PAs having difficulty finding employment,although some jobs require years of experiencein addition to the degree. Key informantsadvised that because there are so many openPA positions, PAs tend to “job hop.” Table 2summarizes an analysis of job postings for PAsonly (not including jobs posted for either aPA or an NP) conducted by Perri Morgan andcolleagues, which showed that there were 1,096job postings for PAs in 2014. This equates roughlyto one job opening for every five PAs in the NCworkforce in 2014.i These analyses use a novelmethodology and it is unclear how accuratelythey reflect actual vacancies—for example, ahealth system might decide to leave a postingopen after it is filled to have the ability to hireadditional personnel later. However, signs pointto a strong current demand for PAs in the state.Table 2. North Carolina Physician AssistantJob Postings, 20144Job TypeFor PAs onlyFor PAs or NPsTotalNumberPercent1,09665.5%57734.5%1,673100%i NC HPDS data show 4,790 PAs in the NC workforce in 2014.See: https://nchealthworkforce.sirs.unc.edu/4Although at present, the demand for PAs exceedsthe supply, it is not known how long this demandwill persist. Discussion in the academic literaturesuggest that the US may be oversupplied withPAs in the future, but due to the paucity ofdata around PA and NP practice patterns,it is unknown when or whether the marketwill be saturated with these professionals.5PA Education TrendsPA training programs in NC have expandedrapidly to meet the demand from the employerside and the high level of demand from students.The Accreditation Review Commission onEducation for the Physician Assistant (ARC-PA)accredits PA educational programs. SevenNC programs are fully accredited and fourare provisionally accredited (Figure 7). ThePA program at Pfeiffer University is underdevelopment and is not yet accredited.Since 2011, the state has added six new PA schools,matriculating a combined 175 students annually.7This count does not include the program underdevelopment at Pfeiffer University, scheduledto open in 2020 with an inaugural class of 24students that will eventually grow to 45.8 Inaddition to the new programs, existing PAschools have increased enrollment. Projectedenrollment for the PA schools in NC in 20172018 was 520 students, a 16% increase overenrollments in the 2015-2016 school year (Table 3).Cost of attendance varies depending onwhether the program is located at a public ora private school. For example, estimated totalcosts to obtain a PA degree at East Carolina
Figure 7. Physician Assistant Programs, North Carolina, 2017High Point UniversityElonUniversityUNCChapel HillDukeUniversityEast CarolinaUniversityWake Forest UniversityLenoir-RhyneUniversityGardner Webb UniversityPfeifferUniversityAccreditation ping - Not AccreditedUrban Areas (Rural-Urban Commuting Area (RUCA) Code 4 for US Census Bureau ian assistant program data from the Physician Assistant Education Association Program Directory, accessed November 30, 2017 from http://directory.paeaonline.org/programs. RUCA data from the USDA Economic Research Service, -commuting-area-codes.aspx.Table 3. Enrollments in North Carolina Physician Assistant Programs, 2015-201762016-17 projected2017-18 projectedProjected % IncreaseCampbell UniversityUniversity44445014%Duke University9090900%East Carolina University3436366%Elon University3838380%Gardner-Webb University22293141%High Point University19213584%0324025%Methodist University4040400%UNC Chapel Hill*2020200%Wake Forest University9090900%Wingate University5050500%44751052016%Lenoir-Rhyne UniversityPA Totals2015-16*Data for UNC have been updated to reflect actual numbers per rmation-2/frequently-askedquestions.University are 43,395 for NC residents and 89,417 for non-residents,9 while costs for a PAdegree at Elon University are 134,455.10Estimates of the cost to develop a PA program in theSoutheastern US are documented in the academicliterature. A study of a new PA program at theUniversity of Tennessee Health Science Center(UTHSC) in Memphis with a class of 25 applicantscost 10.5 million in 2015 dollars for the first tenyears of operation.11 There are differences betweenthe two campuses, (e.g., UTHSC has a medicalschool while WSSU does not), but this estimatemay provide some guidance on the potentialexpected cost to develop a new program at WSSU.5
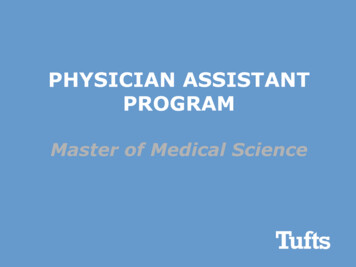
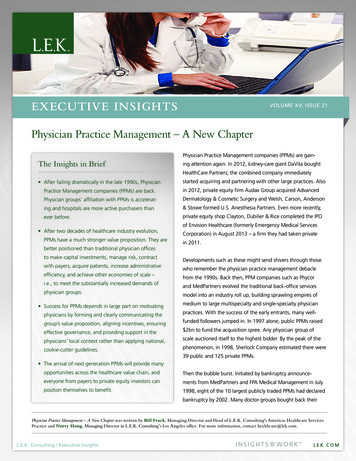
Student Interest in PA Programs2016, indicate that faculty recruitment for PAprograms is challenging.14 The report showsthat 77% (n 161) of PA programs hired newfaculty in the prior academic year. Of those thathired new faculty, 85% (n 137) cited the lack ofqualified candidates as a significant barrier tohiring new faculty, and 82% (n 132) cited lackof teaching experience as a barrier (Figure 9).Students apply to PA programs online via theCentral Application Service for PhysicianAssistants (CASPA). CASPA data demonstratethat between 2002 and 2011, despite therapid expansion of PA programs throughoutthe US, the total number of applicants toPA programs increased compared to thenumber of seats available (Figure 8).12 Themost recent data from CASPA indicate thatin the 2015-2016 admissions cycle, therewere 3.0 PA school applicants per seat.13Survey data from 2015 show that the majority(80.4%, n 863) of PA faculty were PAs,but one in five were not. Most commonly,non-PA faculty held PhDs (33.7%, n 66)or were physicians (30.0%, n 51).PA Faculty RecruitmentSurvey results suggested that most PA facultyhave not held their positions for a long period oftime.15 Of those surveyed, the majority of faculty(81.6%, n 621) had only been employed at oneNational data from the 2016 Physician AssistantEducation Association program report, whichsurveyed all 209 PA member programs inFigure 8. Number of Applicants per Seat, Physician Assistant Programs, U.S., 02002Applicants per Seat3.0Incoming School YearMcDaniel MJ, Hildebrant CA, Russell GB. Central application service for physician assistants ten-year data report, 2002 to 2011. J PA Educ. 2016;27(1),17-23.Figure 9. Barriers to Hiring New PA Faculty, PAEA, 2015Salary (n 140)Significant barrierLack of Qualified Candidates (n 137)Moderate barrierLack of Teaching Experience (n 132)Insignificant barrierLocation (n 126)Note: This scale was originallyan 8-point scale, with 1 as themost significant barrier and 8as the least significant barrier.Scale points were collapsed asfollows: 1-3 (significant barrier),4-5 (moderate barrier),6-8 (insignificant barrier).Cost of Living (n 119)Degree Requirements (n 118)Lifestyle (n 117)Other (n 18)0%20%40%60%Percent of Programs Reporting Barriers80%100%Source: Physician Assistant Education Association, Physician Assistant Program Faculty and Directors Survey Report, 2015, Washington, DC: PAEA, 2015,accessed November 30, 2017 from aculty-directors-report20160218.pdf.6
Table 4. Past Employment of New Physician Assistant Faculty Hired in the 2014-15 Academic Year(N 193, 18% of all respondents)Immediate Past EmploymentNumberPercentClinical practice (including precepting)8845.6%Clinical practice (no precepting)4020.7%PA education3116.1%Other educational program (non-PA)168.3%Previously worked part-time at the current rce: Physician Assistant Education Association, Physician Assistant Program Faculty and Directors Survey Report, 2015, Washington, DC: PAEA, 2015,accessed November 30, 2017 from aculty-directors-report20160218.pdf.program. Close to half (46.2%, n 495) had heldtheir current faculty position for fewer thanfour years. The majority of the 193 faculty thatwere hired in the prior academic year camefrom clinical practice; 45.6% (n 88) werein clinical practice and precepted students,and 20.7% (n 40) were in clinical practiceand did not precept students (Table 4).Training Sites for PA StudentsAn important concern regarding PA (as wellas physician and NP) education in the state isthe lack of available preceptorships. As part oftraining, students must complete rotations atclinical sites. The rapid expansion of PA schoolenrollment, along with medical school and NPschool enrollment, has put pressure on the stateto find qualified preceptors for learners. WhileNP students are typically (although not always)precepted by other NPs, medical students andPA students sometimes compete for the samepreceptorships.16 The NC AHEC program hasdeclared the situation a “crisis” and has madethe issue one of its key priorities.17 According toa study conducted by AHEC in 2016, 93% (27of 29) of the NC schools that train physicians,PAs, NPs, or pharmacists provide financialincentives to preceptors, which typically go tothe practice, rather than the preceptor.18 Twohealthcare systems in the state have set explicitlimits on the number of students they will preceptand the number of schools from which theywill accept students due to the indirect costsassociated with precepting,19 which includesupervising practitioner time, background checksfor students, onboarding to electronic healthrecord systems (EHRs), and administrative costs.Given the choice between precepting studentsfrom two different schools, a preceptor maybe more likely to accept students from schoolsthat provide larger incentive payments. Privateschools can opt to charge higher tuition to coverthese incentive payments and are then at anadvantage when competing for preceptors withpublicly funded institutions. AHEC has led ataskforce around these issues and is evaluatingoptions to level the playing field. Georgia,Maryland, and Colorado have recently passedlegislation providing tax credits to physicianswho precept medical students.20 It remains to beseen whether NC will pursue a similar model.A 2016 AHEC report noted that two keyinfluences related to preceptorships are7
accreditation requirements and alumni ties.21Without a pre-existing alumni network of graduates,WSSU may be at a comparative disadvantage inrecruiting preceptors for a new PA program.DiscussionThe case for a new PA program at WSSU is unclear.On one hand, the demand for PAs on the employerside is strong and the demand for students issuch that despite the growth in seats at trainingprograms, the number of applicants per seat hasgrown. At the same time, PA programs haveexpanded rapidly in the state and in the countryover the past six years. While the current job marketappears strong, there are concerns among PAworkforce researchers that the market will reachsaturation in the future. Evidence to support anycurrent PA workforce saturation is lacking becauseinformation on PA practice patterns is scarce.A key challenge facing a new PA program is thelack of available preceptors in the state to trainlearners. The lack of preceptorships is a significantbarrier already faced by existing PA programs.While this challenge would not be unique toWSSU, the university would need to navigate analready crowded field. PAs and medical studentssometimes compete for the same preceptorships.With the existing medical school and PAprogram at Wake Forest University and the PAprogram at nearby High Point University, it maybe that local preceptorship options are alreadycommitted to other institutions. Furthe
are trained at the master’s degree level and usually complete their degree in roughly two years. Some PAs choose to complete a residency before entering practice, but residency training is not required. Winston-Salem State University (WSSU) is a historically Black university (HBCU) in Winston-