Transcription
Comparison of School CoursesSchool course titles and descriptions are compared to course levels in this sectionof the report. The majority of algebra I and geometry classes were ranked as intermediate,regardless of the label given by the school. Seventy-three percent of graduates inclasses the school labeled “honors” algebra I and 62 percent of graduates in classesthe school labeled “honors” geometry were in courses ranked as intermediate.A larger percentage (37 percent) of White graduates in geometry classes labeled“honors” were enrolled in rigorous courses, compared to the percentage of Blackand Hispanic graduates (21 and 17 percent, respectively) in similarly titled courses.ALGEBRA I AND GEOMETRY CURRICULA 29
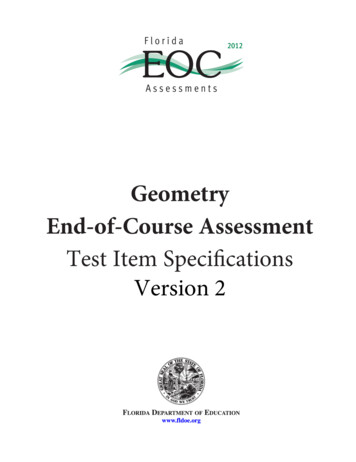
ALGEBRA IMost graduates’ algebra I coursesranked at the intermediate level,regardless of the course title.The percentages of graduates who tookdifferent types of algebra I courses, by schoolcourse descriptions and course levels, areshown in figure 6. Only 18 percent of highschool graduates who took classes that schoolslabeled as “honors” algebra I were in coursesranked as rigorous, based on textbooks usedby the schools. Most graduates who tookclasses schools labeled as “honors” algebra I(73 percent) were in intermediate courses.The percentage of graduates who took“honors” classes that were ranked as intermediate(73 percent) is larger than the percentage ofgraduates who took “regular” algebra I classesthat were ranked intermediate (54 percent).About 9 percent of graduates in classes thatschools labeled “honors” algebra I were incourses ranked as beginner.Conversely, a larger percentage of graduateswho took “two-year” algebra I classes (22 percent)were in courses ranked as beginner, compared tograduates who were in “honors” algebra I classes(9 percent). (“Two-year” algebra I is a course thatis completed in two school years.)PERCENTFIGURE 6. Percentage of graduates who took algebra I classes, by school course title and course level: RA I SCHOOL COURSE TITLE* Significantly different (p .05) from honors.NOTE: Details may not sum to total because of rounding and the use of integrated mathematics textbooks in nonintegrated algebra I courses.“Two-year”algebra I is a course that is completed in two school years.“Honors” algebra I is a course that covers more advanced algebra topics and/or morein-depth analysis of algebra topics, including courses labeled honors, gifted and talented, and college preparatory.SOURCE: U.S. Department of Education, Institute of Education Sciences, National Center for Education Statistics, High School Transcript Study (HSTS),Mathematics Curriculum Study, 2005.30 COMPARISON OF SCHOOL COURSES
TABLE 5. P ercentage of graduates who took algebra I classes, by course level, school course description, andstudent race/ethnicity: 2005School course descriptionand student race/ethnicityAlgebra I course 18Hispanic105635‡‡‡Two-year algebra IHispanicAsian/Pacific IslanderRegular algebra IAsian/Pacific IslanderHonors algebra IAsian/Pacific Islander‡ Reporting standards not met.* Significantly different (p .05) from White graduates.NOTE: Details may not sum to total because of rounding and the use of integrated mathematics textbooks in nonintegrated algebra I courses.“Two-year”algebra I is a course that is completed in two school years.“Honors” algebra I is a course that covers more advanced algebra topics and/or morein-depth analysis of algebra topics, including courses labeled honors, gifted and talented, and college preparatory. Black includes African American,Hispanic includes Latino, and Asian/Pacific Islander includes Native Hawaiian. Race categories exclude Hispanic origin.SOURCE: U.S. Department of Education, Institute of Education Sciences, National Center for Education Statistics, High School Transcript Study (HSTS),Mathematics Curriculum Study, 2005.Few racial/ethnic differences bycourse level found among graduatesin similarly titled algebra I courses.Table 5 shows the course level breakdown ofalgebra I classes by school course descriptionsand student race/ethnicity. Overall, few significantdifferences were found when comparing thepercentages of White graduates who took algebra Icourses by school course description and courselevel to Black, Hispanic, and Asian/Pacific Islandergraduates who took similar courses, as noted intable 5. Approximately 37 percent of the Hispanicgraduates in “two-year” algebra I classes were inbeginner courses, compared to 19 percent each ofWhite and Black graduates in similarly titled classes.When looking at graduates who were in coursestitled “regular” algebra I classes, a larger percentageof Asian/Pacific Islander graduates, 22 percent,were in beginner courses compared to Whitegraduates (10 percent). No racial/ethnic differencesby course level were found among graduateswho took classes labeled as “honors” algebra I.ALGEBRA I AND GEOMETRY CURRICULA 31
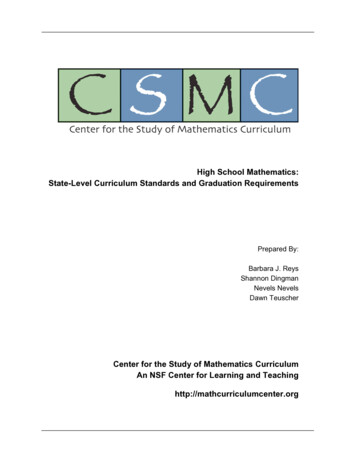
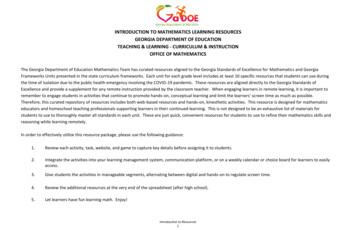
GEOMETRYMost graduates received intermediatelevel geometry courses, regardless ofcourse title.The percentages of graduates who took differenttypes of geometry courses, by school coursedescriptions and course levels, are shown infigure 7. One-half or more of the high schoolgraduates enrolled in “informal,” “regular,” and“honors” geometry classes had an intermediatecourse. (“Informal” geometry is a course thatdoes not emphasize proofs.) Fifty-four percentof graduates in classes that schools described as“informal” geometry, 68 percent of graduates in“regular” geometry, and 62 percent of graduatesin “honors” geometry were in courses rankedas intermediate.For those graduates in “honors” geometry classes,only 33 percent were in rigorous geometrycourses. A larger percentage of graduates whotook “honors” geometry classes had rigorouscoursework, compared to graduates who took“informal” and “regular” geometry classes (14 and19 percent, respectively). A larger percentage ofgraduates who took classes labeled “informal”geometry received coursework ranked as beginnerlevel (30 percent), compared to graduates whotook classes labeled “regular” or “honors”geometry (11 and 4 percent, respectively).PERCENTFIGURE 7. P ercentage of graduates who took geometry classes, by school course titleand course level: ETRY SCHOOL COURSE TITLE* Significantly different (p .05) from honors.NOTE: Details may not sum to total because of rounding and the use of integrated mathematics textbooks in nonintegrated geometry courses.“Informal”geometry is a course that does not emphasize proofs.“Honors” geometry is a course that covers more advanced geometry topics and/or more in-depthanalysis of geometry topics, including courses labeled honors, gifted and talented, and college preparatory.SOURCE: U.S. Department of Education, Institute of Education Sciences, National Center for Education Statistics, High School Transcript Study (HSTS),Mathematics Curriculum Study, 2005.32 COMPARISON OF SCHOOL COURSES
Racial/ethnic differences by course levelwere evident only among graduates incourses titled “honors” geometry.“honors” geometry classes were in courses thatwere ranked as intermediate (57 percent of White,73 percent of Black, 81 percent of Hispanic, and63 percent of Asian/Pacific Islander graduates).A larger percentage of Black (73 percent) andHispanic (81 percent) graduates who took “honors”geometry classes were in intermediate courses,compared to White graduates (57 percent). Therewere no measurable differences at any course levelamong White, Black, and Hispanic graduates whotook either “informal” or “regular” geometry.Table 6 shows the breakdown of geometry classesby course level, school course descriptions, andstudent race/ethnicity. For graduates in classeslabeled “honors,” 37 percent of White graduates hadrigorous courses, compared to 21 percent of Blackgraduates and 17 percent of Hispanic graduatesin similarly titled courses. One-half or more ofgraduates in each racial/ethnic subgroup who tookTABLE 6. Percentage of graduates who took geometry classes, by course level, school course description,and student race/ethnicity: 2005School course descriptionand student race/ethnicityGeometry course 673*21*Hispanic281*17*Asian/Pacific Islander26335Informal geometryAsian/Pacific IslanderRegular geometryAsian/Pacific IslanderHonors geometry‡ Reporting standards not met.* Significantly different (p .05) from White graduates.NOTE: Details may not sum to total because of rounding and the use of integrated mathematics textbooks in nonintegrated geometry courses.“Informal”geometry is a course that does not emphasize proofs.“Honors” geometry is a course that covers more advanced geometry topics and/or more in-depthanalysis of geometry topics, including courses labeled honors, gifted and talented, and college preparatory. Black includes African American, Hispanicincludes Latino, and Asian/Pacific Islander includes Native Hawaiian. Race categories exclude Hispanic origin.SOURCE: U.S. Department of Education, Institute of Education Sciences, National Center for Education Statistics, High School Transcript Study (HSTS),Mathematics Curriculum Study, 2005.ALGEBRA I AND GEOMETRY CURRICULA 33
Coursework and PerformanceGraduates who took beginner, intermediate, or rigorous algebra I or geometrycourses and their subsequent mathematics coursetaking and performance on theNAEP mathematics assessment are shown in this section of the report. The patternfor subsequent mathematics coursetaking is associated with both algebra I andgeometry course level. Graduates who took rigorous algebra I courses had a higheraverage NAEP algebra score (146) than graduates who took beginner algebra Icourses (137). Graduates who took rigorous geometry courses more often took acalculus course and achieved higher NAEP mathematics scores than graduateswho took beginner or intermediate geometry courses.ALGEBRA I AND GEOMETRY CURRICULA 35
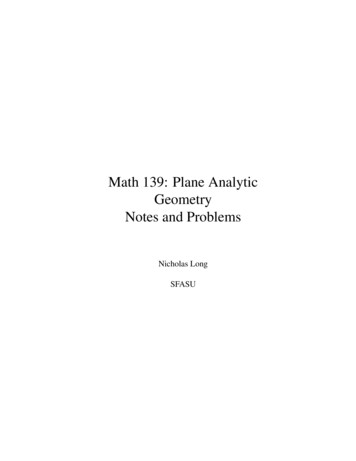
COURSE LEVELS AND HIGHEST COURSE TAKENGraduates who took beginner algebra Icourses more likely had algebra I orgeometry as their highest mathematicscourse.Figure 8 shows the highest level mathematicscourse taken by graduates given the course levelof the algebra I class they took while in high school.A higher percentage of graduates who took abeginner algebra I course went on to have thatcourse or a geometry course as their highest levelmathematics course than graduates who took anintermediate or rigorous algebra I course. Of thehigh school graduates who had a beginner algebra Icourse, 14 percent had that class as their highestlevel mathematics course, which was higher thangraduates who had an intermediate or a rigorouscourse. Similarly, a larger percentage of graduates(26 percent) who took a beginner algebra I coursehad geometry as their highest level mathematicscourse compared to graduates who had an intermediate (18 percent) or a rigorous course (16percent). Fewer graduates who took beginneralgebra I courses had algebra II as their highestlevel mathematics course taken than graduates whohad intermediate or rigorous courses. About 32percent of graduates who took a beginner algebra Icourse had algebra II as their highest mathematicscourse taken, compared with 45 percent ofPERCENTFIGURE 8. Percentage distribution of highest level mathematics course taken by graduates,by algebra I course level: BEGINNER1658*INTERMEDIATECalculusAdvanced mathematicsAlgebra IIGeometryAlgebra IRIGOROUSALGEBRA I COURSE LEVEL* Significantly different (p .05) from rigorous.NOTE: Details may not sum to total because of rounding.SOURCE: U.S. Department of Education, Institute of Education Sciences, National Center for Education Statistics, High School Transcript Study (HSTS),Mathematics Curriculum Study, 2005.36 COURSEWORK AND PERFORMANCE
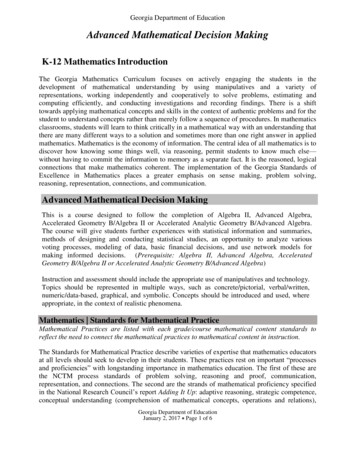
PERCENTFIGURE 9. Percentage distribution of highest level mathematics course taken by graduates,by geometry course level: NER183516INTERMEDIATE15CalculusAdvanced mathematicsAlgebra IIGeometryRIGOROUSGEOMETRY COURSE LEVEL* Significantly different (p .05) from rigorous.NOTE:Details may not sum to total because of rounding.SOURCE: U.S. Department of Education, Institute of Education Sciences, National Center for Education Statistics, High School Transcript Study (HSTS),Mathematics Curriculum Study, 2005.graduates who took intermediate algebra I coursesand 46 percent of graduates who took rigorousalgebra I courses. There were no significantdifferences in the percentages of graduates whotook an intermediate or rigorous algebra I coursewho went on to take a geometry course or higheras their highest level mathematics course.A higher percentage of graduateswho took rigorous geometry coursestook advanced mathematics coursescompared to graduates who tookbeginner and intermediate courses.took while in high school. A larger percentageof graduates who received a rigorous geometrycourse took a calculus course in high school(18 percent) than those graduates who receivedbeginner or intermediate courses (8 and 13percent, respectively). However, a largerpercentage of graduates who received a beginnergeometry course had that course as their highestlevel mathematics course (25 percent) thanthose graduates who took an intermediate orrigorous geometry course (16 percent and 15percent, respectively).Figure 9 shows the highest level mathematicscourse taken by high school graduates giventhe course level of the geometry class theyALGEBRA I AND GEOMETRY CURRICULA 37
COURSE LEVELS AND NAEP ASSESSMENT SCORESGraduates in rigorous algebra Icourses performed better on NAEP thangraduates in beginner algebra I courses.White graduates obtained higher scoresacross all algebra I course levels thanBlack or Hispanic graduates.The average NAEP algebra scores for 2005 highschool graduates, by the course level of thealgebra I classes taken and student race/ethnicity,are shown in figure 10. Graduates who tookrigorous algebra I courses earned an averageNAEP algebra score of 146. This average scorewas nine points higher than the average scoreof 137 earned by graduates who took beginneralgebra I courses.Score differences were also evident when the datawere examined by student race/ethnicity. Whitegraduates who took rigorous algebra I coursesearned an average NAEP algebra score of 151,which was 17 points higher than the averagescores obtained by Black graduates and 19 pointshigher than the average score obtained byHispanic graduates who took rigorous algebra Icourses. Significant achievement gaps were alsoFIGURE 10. A verage NAEP algebra score of graduates, by student race/ethnicity and algebra Icourse level: 2005300ALGEBRA SCALE SCORE170160150137** gorousIntermediateBeginner1100ALL GRADUATESWHITEBLACKHISPANICRACE/ETHNICITY* Significantly different (p .05) from corresponding White graduates.** Significantly different (p .05) from rigorous.NOTE: Average NAEP algebra scale scores are shown. Asian/Pacific Islander graduates are included in the calculation of average NAEP algebra scores for“All Graduates” but are not reported separately because sample size does not meet reporting standards across course levels. Black includes AfricanAmerican, Hispanic includes Latino, and Asian/Pacific Islander includes Native Hawaiian. Race categories exclude Hispanic origin.SOURCE: U.S. Department of Education, Institute of Education Sciences, National Center for Education Statistics, National Assessment of Educational Progress,High School Transcript Study (HSTS), Mathematics Curriculum Study, 2005.38 COURSEWORK AND PERFORMANCE
seen among White and Black graduates andWhite and Hispanic graduates who took beginnerand intermediate algebra I courses.and by student race/ethnicity. There was aneleven-point gap in the average geometry scoresbetween graduates who took rigorous (159)and beginner (148) geometry courses. As wasthe case with algebra I, White graduates earnedhigher NAEP geometry scores than Black orHispanic graduates, regardless of geometrycourse level.Graduates in rigorous geometry coursesalso performed better on NAEP.Figure 11 shows the average NAEP geometryscore for 2005 high school graduates by thecourse level of the geometry classes they tookFIGURE 11. A verage NAEP geometry score of graduates, by student race/ethnicity andgeometry course level: 2005GEOMETRY SCALE 1100ALL GRADUATESWHITEBLACKHISPANICRACE/ETHNICITY* Significantly different (p .05) from corresponding White graduates.** Significantly different (p .05) from rigorous.NOTE: Average NAEP geometry scale scores are shown. Asian/Pacific Islander graduates are included in the calculation of average NAEP geometry scores for“All Graduates” but are not reported separately because sample size does not meet reporting standards across course levels. Black includes AfricanAmerican, Hispanic includes Latino, and Asian/Pacific Islander includes Native Hawaiian. Race categories exclude Hispanic origin.SOURCE: U.S. Department of Education, Institute of Education Sciences, National Center for Education Statistics, National Assessment of Educational Progress,High School Transcript Study (HSTS), Mathematics Curriculum Study, 2005.ALGEBRA I AND GEOMETRY CURRICULA 39
Technical NotesOverviewchapters used in each course were aggre-with special education diplomas, certificatesThe 2005 High School Transcript Study (HSTS)gated to create the course summary measures.of attendance, or certificates of completionMathematics Curriculum Study (MCS) bringsA factor analysis of the course summarieswere excluded from the analysis.together information from three sources—was conducted to identify the patterns in thestudents, schools, and textbooks—to providemathematics content coverage across courses,a more in-depth look at high school graduates’while a discriminant analysis was conducted toalgebra I and geometry courses.The study usedclassify the courses into four content categories.textbook data collected as part of the 2005HSTS, which is associated with the NationalLastly, the student analyses, the third step,Assessment of Educational Progress (NAEP).involved generating student summary mea-Information from algebra I and geometry text-sures, classifying students’ coursework intobooks used by schools across the nation servedcourse levels, and defining broad categoriesas an indirect measure of the curriculum taughtof curriculum topics. The course summaryin these courses. Two mathematics curriculummeasures were matched to students by themeasures—curriculum topics and coursecourses the students took, as listed on theirlevels—were created from the textbook datatranscripts, which allowed for the studentand formed the basis of the study’s results.summary measures to be created. Similar to theThese measures, along with the HSTS tran-course analyses, a factor analysis of the studentscript data, student and school demographicsummaries was conducted to identify thedata, and the NAEP 2005 twelfth-grade math-patterns in the mathematics content coverageematics assessment data, were the dataacross students, while a discriminant analysissources for the findings listed in this report.was conducted to classify the students’coursework into one of three course levelsA series of analyses were conducted for the(beginner, intermediate, rigorous) and antextbooks collected, corresponding courses,integrated category. The student summaryand students who took the courses to createmeasures were also used to create sixthe curriculum topic and course level reportingcurriculum topic categories, which were alsomeasures. The textbook analyses, the first step,used as a reporting measure.The study meth-involved coding chapter review questions andodology is summarized in this section of thecreating chapter summary measures. Reviewreport. The forthcoming Technical Report willquestions for each chapter of a textbook,provide full details of the study methodology.not the entire textbook, were coded for theirSamplingThe 2005 NAEP HSTS sampling procedureswere designed to achieve a nationally representative sample, including both public andprivate school graduates in the Class of 2005.Consistent with the 2005 NAEP national assessments, in the 2005 HSTS, students were selectedfor participation based on a stratified two-stagesampling plan. In the first stage of sampling,schools were selected, and students withinschools were selected in the second stage.The weighting procedures for this study takeinto account the stratified sampling methods.The MCS uses graduates from the publicschool samples of the 2005 NAEP HSTS. Thesamples included the full student sample,which included approximately 37,900 publicschool students with transcript data, and asmaller sample, which only included theapproximately 27,200 public school studentswho participated in the NAEP mathematicsand science assessments. A full descriptionof the sampling plan is beyond the scope ofthis Appendix. More sampling informationabout the 2005 NAEP HSTS can be found inThe 2005 High School Transcript Study User’sGuide and Technical Report (Shettle et al. 2008).All public schools that participated in thecovered) and performance expectations (i.e.,Target Populationand Analytic Samplethe tasks required to answer the question).TheThe HSTS has been conducted periodicallythat identified the textbooks used for eachchapter review questions have been found tosince 1990. The MCS is a component of themathematics course they offered. Schoolsbe representative of the chapter content andHSTS administered in 2005. The target popu-that did not offer algebra I and/or geometrychallenge level (Schmidt 2012). Chapterlation for the 2005 study included students incourses (or comparable courses such assummary measures were created to reflectpublic schools in the United States who wereintegrated mathematics I and/or integratedthe combined content of the chapter reviewenrolled in the twelfth grade during the 2004-mathematics II) or did not complete the text-questions for each textbook chapter.05 school year, who graduated in 2005 withbook forms were not eligible for the MCS. Higha regular or honors diploma, and who took anschool graduates who did not take algebra I inThe course analyses, the second step, involvedalgebra I course and/or geometry course (orhigh school were not included in the algebragenerating course summary measures andan equivalent course, such as integratedI analysis. High school graduates who didcreating categories of course content. Themathematics) in high school. Private schoolsnot take geometry in high school were notchapter summary measures of the textbookwere not included in the analysis. Graduatesincluded in the geometry analysis. Aboutcurriculum topics (i.e., the mathematical topics40 TECHNICAL NOTES2005 NAEP HSTS were asked to fill out forms
17,800 public high school graduates fromHSTS public schools that participated in thean indicator of whether the textbook was thethe 2005 NAEP HSTS were included in theNAEP twelfth-grade mathematics assessment,main or supplemental textbook used for theMCS analyses. Around 12,500 graduatesthe weighted school response rate was aboutmathematics course. The lists also includedwere part of the algebra I sample, while88 percent.what chapters from the textbook were taughtaround 15,900 graduates were part of thein the course.geometry sample. The analyses for this reportIn addition to the school response rates,was limited to textbook data matched to algebraweighted student response rates were calculatedAround half of the textbooks selected for codingI and geometry courses. Approximately 5,700by comparing the weighted percentages ofhad been coded in prior mathematics textbookstudents linked to the NAEP twelfth-grade math-students that were analyzed with textbook datastudies conducted by the Center for Researchematics assessment had textbook data matchedwith all eligible students. For the full studentin Mathematics and Science Education, formerlyto algebra I and/or geometry courses, ofsample, eligible students were defined asthe U.S. Trends in International Mathematicswhich 4,900 students were included in thepublic high school graduates who attendedand Science Study (TIMSS) National ResearchMCS analyses.the schools that had textbook data that couldCenter at Michigan State University (MSU).be matched to algebra I and/or geometryThese previously coded textbooks wereAs part of the 2009 NAEP HSTS, publiccourses. From the 550 public high schoolsincluded in the sample because (1) schoolsschools were asked again to fill out forms thatwith textbook data matched to algebra I and/were still using the textbooks; and (2) whenidentified the textbooks used for each math-or geometry courses, there were 21,100new editions of textbooks were compared toematics course offered. However, no further workeligible students, of which 17,800 studentspreviously coded editions, no changes werehas been conducted beyond the collection ofwere included in the MCS analyses. Amongfound in the chapter review questions. In boththese textbook lists. Therefore, no informationthese eligible students, the weighted studentinstances, the curriculum topics and perfor-from the 2009 data collection was includedresponse rate was around 85 percent.mance expectations coded in prior studiesin this report.were unchanged and, therefore, adopted forSimilar to the school response rates, a separateSchool and StudentResponse Ratesthe current study.weighted student response rate was calculated for students in schools linked to the NAEPTo maximize student coverage, textbooks2005 twelfth-grade mathematics assessment.were selected for coding as part of this studyFor the smaller NAEP-linked sample, eligiblebased on the number of 2005 NAEP HSTSstudents were defined as public high schoolparticipants in courses using those textbooks.graduates who attended the schools that hadTextbooks used by only one or two schools weretextbook data that could be matched to algebranot sampled for coding to prevent possibleI and/or geometry courses and participated indisclosure of schools and students that partici-the NAEP twelfth-grade mathematics assess-pated in the NAEP HSTS and the MCS. Becausement. From the 520 public high schools in theinformation about the textbooks used byNAEP-linked sample that had textbook dataschools is publicly available, at least threerate was about 85 percent.matched to algebra I and/or geometry courses,schools had to have used an algebra I, geometry,there were 5,700 eligible students, of whichor integrated mathematics textbook for it to beAs this report includes an analysis of NAEP4,900 students were included in the MCSincluded in the current study.Among the 640 public schools that participatedin the 2005 NAEP HSTS, 550 schools had textbook data matched to their algebra I and/orgeometry courses. A weighted school responserate was calculated by comparing the weightedpercentages of schools that had textbookdata with all 2005 NAEP HSTS participatingpublic schools. Among all 2005 NAEP HSTSpublic schools, the weighted school responsetwelfth-grade mathematics assessment scores,and since not all public schools in the HSTSparticipated in that assessment, a separateweighted school response rate was calculatedanalyses. Among these eligible students, theweighted student response rate was around87 percent.Steps of the Analysis ProcessThe discussion of the series of analysis stepsto conduct the MCS is broken into three sections:based on the 2005 NAEP HSTS public schoolsTextbook Collectiontextbook analyses, course analyses, and studentlinked to the NAEP 2005 twelfth-grade math-About 120 textbooks—50 algebra I or first-analyses. Figure A1 on the following pagesematics assessment. Of the 590 publicyear integrated mathematics textbooks anddisplays an overview of the steps of the studyschools that participated in both the 200570 geometry or second-year integrated math-analyses as a flow chart.NAEP HSTS and 2005 NAEP twelfth-gradeematics textbooks—were selected for codingmathematics assessment, 520 schools hadfrom the textbook lists provided by schools astextbook data matched to their algebra I and/being used in algebra I and geometry coursesor geometry courses. Among 2005 NAEPacross the nation. The textbook lists includedALGEBRA I AND GEOMETRY CURRICULA 41
Steps of the Analysis ProcessThe Mathematics Curriculum Study used information from algebra I and geometry textbooks used in schools across the nation to characterize themathematics content of these two courses. A series of analyses were conducted for the textbooks collected, the corresponding courses, and thestudents who took the courses to create the curriculum topic and course level measures that were used for reporting. The following flow chart illustratesthe overall analysis steps and the text briefly describes what occurred in each step. A more detailed description of the analysis steps follows in theremaining pages of the Technical Notes.STEP 1: Textbook Analysisfor the algebra I and geometry courses. Thetopic groupings were aggregated to 17 andDetailed on pages 44-45resulting factors, five for algebra I and six forused as input for the factor analyses. A separategeometry, were used in the course discrimi-factor analysis was conducted for the algebranant analysis.I and geometry courses. The resulting factors,Code Chapter Rev
One-half or more of the high school graduates enrolled in "informal," "regular," and "honors" geometry classes had an intermediate course. ("Informal" geometry is a course that does not emphasize proofs.) Fifty-four percent of graduates in classes that schools described as "informal" geometry, 68 percent of graduates in