Transcription
The rise of analytics in thejewellery industryFor private circulation onlySeptember 2018Risk Advisory
The rise of analytics in the jewellery industryContentsForeword 02Areas of growth 03Use of advanced analytics 08What needs to be measured 09How analytics help decode insights from data 11Contact 1201
The rise of analytics in the jewellery industryForewordIn the last few years, the jewellery industry has witnessed a lot of disruptive innovation with advancements in technology.Earlier, the jewellery business was restricted to family owned or proprietor-run entities. However, nowadays, the jewelleryindustry is transforming by leaps and bounds and aligning itself with the advancing corporate culture. There used to belesser number of stores, but with rapid growth and consumerism, there is a proliferation in the retail outlets and franchiseestores along with an increase in the presence of online players through e-Commerce websites and applications. Besides, thedecision-making by businesses in this sector was purely based on instincts and unverified presumptions. With the availabilityof data, businesses can now take decisions based on actionable insights and calculated inferences.With the shift in operational structure, humongous amounts of data are being generated which include sales data, customerdata, expense data, warehouse data, etc. Analytics tools and methods used earlier such as the MIS are becoming less utileto handle such enormous amount of data, and are failing to analyse it for generation of insights. In order to overcomethis technological barrier, advanced analytics tools are being used to provide actionable insights to enable more informeddecision-making.The jewellery industry has a lot to benefit from the potential of data driven insights and advanced analytics, something thatother players in the retail sector are already leveraging. With an increase in sales and customer base on an ongoing basis,the amount of data being generated is also enormous. It is important for businesses to make sense of this data and generateinformation that can empower strategy and operations. Data, when processed and analysed effectively, can act as the fuelthat drives the engine of transformation for businesses.We are also seeing a sharp rise in predictive analytics techniques that help in anticipating what the customer base ismore likely to get attracted to in times to come. This paper focuses on the important aspects of various analytics andpredictive techniques that can be leveraged by the jewellery industry to scale the business to greater heights andprevent various risks involved in the business.02
The rise of analytics in the jewellery industryAreas of growthThe jewellery industry is well-poised for a glittering future. Sales are projected to grow by a huge proportion in the comingyears. However, the fast growing industry is at its dynamic best, and, as such, the jewellery business cannot simply continuewith the status quo and expect more profits. The market has observed major changes in customer behaviour and purchasingpatterns which dictates that businesses have to be proactive and responsive to the changing trends and developments in theindustry. This in turn has given impetus to the adoption and implementation of advanced analytics and highlighted the needfor data driven insights in the sector.Some of the key areas that the jewellery businesses would need to focus on include:KPI analysisKey areasWhat are thekey parameterswhich conveyimportantinsights?OutletperformanceWhich outletsare performingwell and in whichareas, and whatimprovementneeds to bedone?InventoryoptimisationCustomerprofilingSales Analysis/ForecastingAre the stockouts andoverstockingavoided?What kindof customersegments arecontributing tothe growth ofthe businessand what is thefrequency andrecency?What is theimprovementin sales yearon year withrespect to factorslike revenue,expenses,promotions, omer footfallat the storecan highlightthe yield ofmarketingspends.ProductAnalysisWhat kind ofjewellery isdriving moresales?‘What if ’pricinganalysisWhat is theeffect ofchanges in thekey parametersto sectorslike volume ofsales, margins,etc.?ManagementReports for anytime-periodhighlightingcontent such asshopper traffic,transactions,returns,conversion,sales, etc.03
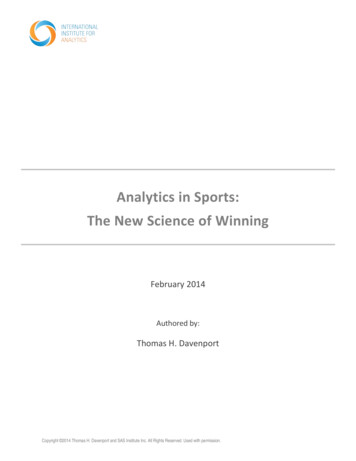
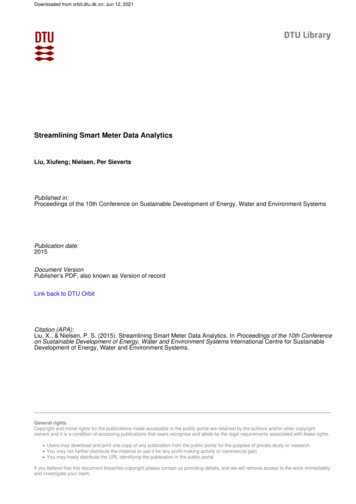
The rise of analytics in the jewellery industryAnalytics is relevant throughout the entire breadth of thejewellery industry at different levels of involvement, andfor a multitude of businesses. All kinds of analysis rightfrom descriptive to predictive and prescriptive have criticalapplications in the jewellery industry.present real-time inventory status and the in-store salesrelated information. Retailers can transfer slow-movingitems at one store to another that may have a greaterdemand. Stock levels at showrooms can be optimisedin accordance with the historical trends and real-timedemands.1. KPI analysis Key performance indicators are important for any businessbecause these help it focus on common goals, and ensurethose goals stay aligned within the organisation’s effortsand expertise. This focus will help a business stay on task,and work on meaningful projects that will assist in reachingthe objectives faster.3. Customer Profiling Analysing customer transactions, visits and interactionswill enable businesses to understand customer behaviour,engagement rate with the brand, frequency, recency,product returns, loyalty towards the brand, and repeatvisitor ratio. At the heart of any analytics project lie certain keyperformance indicators pertaining to that particular data.KPIs define the key parameters in the data that have asignificant impact on the analytics. Therefore, KPI analysisplays a vital role in analytics.4. Sales Analysis A complete sales analytics and expense report derivedbased on two critical parameters (stores and products) canhelp analyse sales and expenses according to seasonality,location, product type, etc.2. Inventory optimization Jewellers maintain high-value inventory of jewelleries andaccessories. Neither out-of-stock nor overstock is goodfor the business. Reordering and other item requirementscan be complex to manage. Any delay or negligence inrestocking may result in loss of business. By integratinganalytics in the in-store point-of-sales system, we canSales discovery dashboard allows one to measure and monitorsales performance by product categories, product groups,showrooms, regions, and sales personnel over selected period.Business managers can use filtering and drill-down functionsto isolate sales laggers, and identify probable root causes sothat resolution plans can be put forward to move sales laggersup the charts.Qualifier Algorithm & Forecasting Analyzes history Selects algorithm Displays which algorithm was selectedOptimization & Rationalization System rationalize inventory mix Sets optimal stocking quantityInventory Analysis System checks inventory position v/s SQ Determines items needing replenishment Analyzes excess and inactive stockReplenishment Creates shortage and excess plans/ reports buys Returns POs,Transfers,Work orders to Host ERP04 High moving Slow moving Random demand Lead time Order frequency Service levels ActiveExcessObsoleteShortage New BuyTransfersProductionRepairs
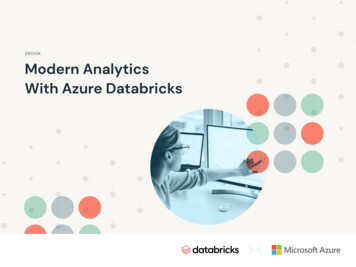
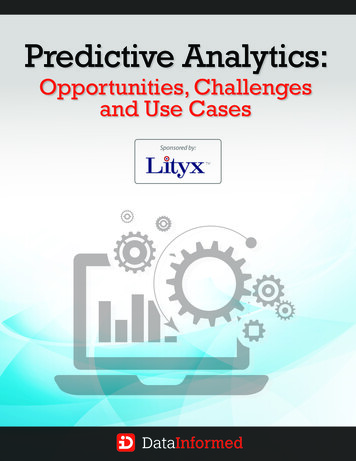
The rise of analytics in the jewellery industryKPI DashboardSales ales OverviewClear 50.005.00%50.000.00%Apr May Jun JulOct Nov DecJanFeb MarSales DetailsStore – Differentiated View20.0015.005.000.00Aug Sep Oct Nov Dec Jan Feb MarSalesMargin0.0020.00 40.00 60.00 80.00 100.00 120.00 140.00 160.00Margin %Product ProfitabilityStore-Wise SalesProductSales (Cr)Margin (Cr)Margin %Margin % TotalNo. of InvoicesGold 969.14 184.140.19053.39%88515Diamond 152.29 31.980.2109.27%15374Bullion 83.07 17.440.2105.06%8386Coin 69.22 13.840.2004.01%6655Platinum 66.46 13.290.2003.85%6389 443.03 84.180.19024.41%40464SilverKPI DashboardAug Apr May Jun“What-If” Pricing AnalysisMonthly Sales & Margin200.00ChannelsStore 1Store 2Store 3Store 4Store 5Q4Sales es OverviewClear anchiseCorporateExhibitionE-CommerceShowroomsStore 1Store 2Store 3Store 4Store .00100.0010.00%15.0050.005.00%10.0050.000.00%Apr May Jun JulSalesAug Sep Oct Nov Dec Jan Feb MarOct Nov DecMarginMargin %Sales 2017-18JanFeb MarSales DetailsStore – Differentiated View5.000.000.0020.00 40.00 60.00 80.00 100.00 120.00 140.00 160.00Product ProfitabilityStore-Wise SalesStoreAug Sep“What-If” Pricing AnalysisMonthly Sales & Margin200.00Apr May JunSales 2016-17VarianceStore 1 180.52 174.63 5.89Store 2 166.96 161.34 5.62Store 3 124.00 113.34 10.66Store 4 110.00 103.12 6.88Store 5 101.00 97.34 3.66Store 6 98.00 95.00 3.00Store 7 97.00 93.00 4.00Store 8 95.00 92.39 261Store 9 89.00 83.22 5.78Sales 2016-1705
The rise of analytics in the jewellery industry5. ‘What if’ pricing analysis ‘What If’ analysis includes the domains which use predictiveanalysis using innovative technologies such as machinelearning in coherence with advanced analytics techniquesto depict probable future scenarios based on yesteryeardata and insights. “What If” analysis enables businesses to understand thevarious scenarios and their probable outcomes, which alsomakes them anticipate the future trends and their businessneeds as a whole, and take necessary prescriptive steps to getthe desired results.6. Outlet performance Businesses having multiple outlets can use the power ofanalytics and advanced analytics to analyse data of variousoutlets to derive useful insights pertaining to performanceof various outlets, areas that need improvement, etc.Machine learning algorithms can be implemented on theoutlet data using advanced analytics, and multiple modelscan be built to predict how a particular outlet is going toperform in future. The results can be selected from themodel with the best accuracy.7. Marketing/Branding performance Data having information about the funds spent onvarious marketing and branding campaigns, and the06corresponding sales, can be used to build dashboardswith the help of any data visualisation tool. This will helpidentify the most effective marketing techniques, andgain insights for future planning of the marketing andbranding strategy.8. Product analysis Product analysis is essentially concerned with theinsights from the product data that tell the user aboutwhat kind of jewellery products are being preferred bycustomers, and thereby contributing to the sales morethan other products. Supervised and unsupervisedlearning can be used to identify hidden trends andpatterns in the product sales. Different types ofclassification, clustering and association algorithms canbe implemented on the product/sales data and betterinsights can be derived from these models.9. Management Reports can be generated from the data visualisationdashboards and new approaches can be taken by themanagement based on these insights. Time seriespredictions can be made for shopper traffic, revenuedistribution, etc. using machine learning and deep learning.Hence, analytics can help glean crucial information thatcan help formulate the right strategies that align withorganisational goals.
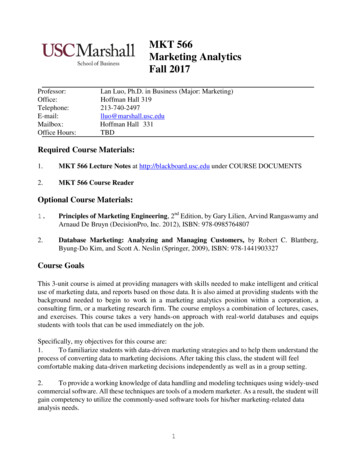
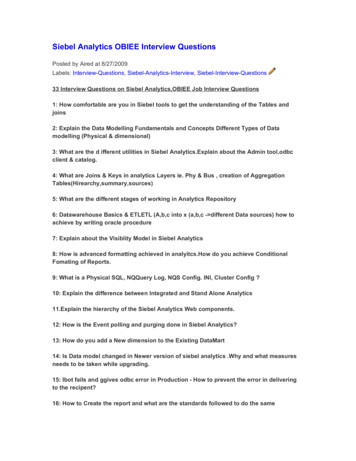
The rise of analytics in the jewellery industryVarious metrics are used to measure the marketing/branding performance. Some of the metrics are shown in theinfographic below.PredictiveLIKELIHOOD OF OUTCOMEAdaption RatesRate of Growth : MarketLeading IndicatorsBUSINESS OUTCOMEMarket ShareLifetime ValueOutcome basedEFFICIENCYCampaign ROIProgram : People RatioProgram : Total SpendAwareness : Demand RatioOperationalCOUNTINGPreset HitsClick-through RatesActivity basedKPI DashboardSales 4Apr May JunJulAug SepOct Nov Dec“What-If” Pricing AnalysisSales OverviewJanFeb MarSales DetailsClear SelectionProductGoldDiamondCoinsWhat if Price-15 -101-50510%15What if Price-15 teExhibitionE-CommerceShowroomsStore 1Store 2Store 3Store 4Store 5ProductGoldDiamondZoneEastWestNorthMargin changePrice 3,636.48What-IfPrice5.0%What if Revenue 67.790What if Margin 30.249VolumeWhat-IfVolumeRevenueWhat-If RevenueMarginWhat-If Margin 3,672.84 18,70,519.9018,70,519.90 7,82,24,24,420.12 7,82,24,24,420.12 1,02,03,16,228.71 95,22,95,146.8012,100.9512,100.95 4,01,02,46,157.80 4,01,02,46,157.80 52,30,75,585.80 48,82,03,880.08Bullion 3,636.48 3,672.841,34,454.601,34,454.60 56,22,82,683.38 56,22,82,683.38 7,33,41,219.57 6,84,51,804.93Coin 3,636.48 3,672.841,84,692.941,84,692.94 77,23,77,018.18 77,23,77,018.18 10,07,44,828.46 9,40,28,506.56Platinum 2,923.00 2,952.235,618.765,618.76 1,88,87,167.36 1,88,87,167.36 24,63,543.57 2,99,307.33 41.69 42.115,61,565.185,61,565.18 2,69,25,337.56 2,69,25,337.56 35,12,000.55 2,77,867.18Silver 2,88,173.25 2,91,054.9807
The rise of analytics in the jewellery industryUse of advanced analyticsAdvanced analytics refers to state-of-the-art techniques and modern tools used in the field of data science. Predictiveanalytics, data mining, big data analytics, machine learning and deep learning are some of the categories of analytics that fallunder the vast field of advanced analytics. These technologies are widely used in industries such as marketing, healthcare,risk management and economics.Advanced Analytics taPreparationData Access RequestData& DiscoveryTransformationAdvanced analytics is changing the waymany organisations approach theircustomer interactions and the veryprocess of doing business. The abilityfor organisations to use their data topredict consumer buying behaviours andanticipate the activity and requirementsof their own assets, thus enablingthem to make fact-based decisions, hasbecome incredibly powerful.Advanced data analytics is being usedacross industries to predict futureevents. Marketing teams use it to predictthe likelihood that certain web userswill click on a link, healthcare providersuse prescriptive analytics to npatients who might benefit from aspecific treatment, and cellular networkproviders use diagnostic analytics topredict potential network failures,enabling them to do preventativemaintenance. Similarly, the power ofadvanced analytics can also be leveragedby the jewellery industry in numerousways.The advanced analytics processinvolves mathematical approachesto interpreting data. Classical as wellas modern statistical methods, andmachine-driven techniques such asdeep learning are being used to identifypatterns, correlations and in data sets. Based on these, users cananticipate and forecast future trends;for example, identifying which group ofweb users is most likely to engage withan online ad or determining the profitgrowth over the next quarter.Advanced analytics has becomemore common in this era of big data.Predictive analytics models –and, inparticular, machine learning models–require extensive trainings to identifypatterns and correlations before theycan make a prediction. The growingamount of data managed by enterprisestoday opens the door to these advancedanalytics techniques.
The rise of analytics in the jewellery industryWhat needs to bemeasured?Sample insights:The client is a jewellery retail chain in India and was seeking deeper insights into customer purchasing behaviour, and theeffect of campaigns on various products.It was looking for details around: Seasonality effects on each department/product category; Effects of discounts and offers on sales.KPI DashboardSales es OverviewClear anchiseCorporateExhibitionE-CommerceShowroomsStore 1Store 2Store 3Store 4Store 5ZoneEastWestNorthQ3Q4Apr May JunJulMonthly Sales & 5.00%50.00Apr May Jun JulSalesAug Sep Oct Nov Dec Jan Feb MarMargin0.00%Margin %JanFeb MarSales DetailsStore – Differentiated View10.005.000.000.0020.00 40.00 60.00 80.00 100.00 120.00 140.00 160.00Product ProfitabilityStore-Wise SalesStoreOct Nov Dec“What-If” Pricing Analysis150.00200.00Aug SepSales 2017-18Sales 2016-17VarianceStore 1 180.52 174.63 5.89Store 2 166.96 161.34 5.62Store 3 124.00 113.34 10.66Store 4 110.00 103.12 6.88Store 5 101.00 97.34 3.66Store 6 98.00 95.00 3.00Store 7 97.00 93.00 4.00Store 8 95.00 92.39 261Store 9 89.00 83.22 5.78Sales 2016-17Examples: Seasonality is not always a singular effect. Retailers experience both annual and weekly seasonal cycles. November brings in the highest revenue as compared to the other months. Discount offered during November, December and January, is greater as compared to the other months. A leading jewellery retailer in India wanted Deloitte to apply analytics for its expense data and provide an interactivedashboard with drilldowns. Deloitte reported key insights to the retailer’s management pertaining to:1. Region wise expenses break-up;2. Month-wise analysis of actual expenses vs. last year’s expenses; and3. Total break-up of expenses. It was observed that a major part of expenses was directed towards infrastructural costs and rentals.09
The rise of analytics in the jewellery industryKPI DashboardSales AnalysisGold 4Apr May JunJulAug SepOct Nov DecJanFeb MarDistribution of Making ChargesClear SelectionProduct800 –GoldDiamondCoins600 –400 –200 –Channels0–PlSales : Style DecECZ3.00%15.00%OctMC DRA ECZ6.00% 5.76% .01%AprCO14.76%nMargin vs Discount : Month-wiseShowroomsStore 1Store 2Store 3Store 4Store ce0.00%DiscountAnalytics reporting allows organisations to take control of their operations.KPI DashboardSales 4Apr May JunExpenses : Actual vs Last YearClear anchiseCorporateExhibitionE-CommerceShowroomsStore 1Store 2Store 3Store 4Store 5ZoneEastWestNorth10JulAug SepOct Nov DecJanFeb MarExpenses Break-up8%15010011%27%50028%26%Apr May Jun Jul Aug Sep Oct Nov Dec Jan Feb MarActualStaff CostRentalsMaterial CostInfrastructural CostOther CostsLast YearRegion Wise : Expenses BreakupRegionShowroomExpenses BudgetVarianceVariance %ExpensesLast YearVarianceVariance %EastStore 1 3.78 3.90 0.123.08% 4.10 0.327.80%EastStore 2 4.76 4.80 0.040.83% 4.99 0.234.61%WestStore 3 5.34 5.30 -0.04-0.75% 5.66 0.325.65%WestStore 4 5.47 5.40 -0.07-1.30% 5.87 0.406.81%WestStore 5 8.75 8.90 0.151.69% 8.40 -0.35-4.17%WestStore 6 7.87 8.00 0.131.63% 7.35 -0.52-7.07%SouthStore 7 6.13 5.80 -0.33-5.69% 5.99 -0.14-2.34%
The rise of analytics in the jewellery industryHow analytics help decodeinsights from dataThe amalgamation of advanced analytics techniquescoupled with machine learning and creative visualisation hastransformed the jewellery industry and paved the way forunprecedented growth for businesses in this sector.Deloitte has always been at the helm of innovation anddelivered world class service to its clientele. Analytics asa standalone domain has always been thriving at DeloitteIndia with successful implementation of creative solutionsfor complex problems. Deloitte has extensively usedanalytics to crea
2. Inventory optimization Jewellers maintain high-value inventory of jewelleries and accessories. Neither out-of-stock nor overstock is good for the business. Reordering and other item requirements can be complex to manage. Any delay or negligence in restocking may result in loss of business. By integrating