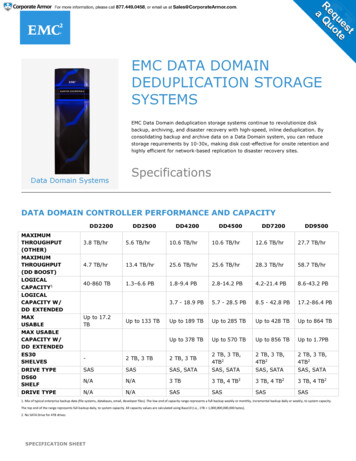
Transcription
INTELLIGENT QOS FOR EMCSTORAGE BY LEVERAGING BIGDATA ANALYTICSYangbo JiangSoftware Engineer, EMCyangbo.jiang@emc.com
Table of ContentsIntroduction . 3What is Storage QoS?. 4The Challenge of Storage QoS . 5Why use Big Data Analytics to enhance QoS? . 6A Framework to Provide Intelligent QoS . 7Framework Introduction . 7Key Technique 1: QoS data collecting . 9Key Technique 2: Predict future QoS value . 10Application of Framework . 16Apply to UQM . 16Apply to FAST VP . 17Conclusion . 19Appendix . 20Disclaimer: The views, processes, or methodologies published in this article are those ofthe author. They do not necessarily reflect EMC Corporation’s views, processes, ormethodologies.2014 EMC Proven Professional Knowledge Sharing2
IntroductionIn the storage industry, Quality of Service (QoS) is defined as the ability to providedifferent priorities to different applications and LUNs, or to guarantee a certain level ofperformance to an application. QoS is critical for preventing workloads or tenants fromadversely affecting one another and for meeting service-level objectives for storageperformance. While most storage vendors have already implemented this feature in theirproduct—such as EMC Unisphere Quality of Service Manager (UQM)—present QoSimplementations are inflexible and mechanized. Since we are now in the “Big Data” era,why not take full advantage of it to make QoS intelligent and prospective?Storage environments generate a large amount of data which may contain hidden usefulinformation that may prove valuable. Predicting customer behavior patterns andmonitoring emergencies using Big Data analytic techniques could help storageadministrators automatically adjust QoS values for applications proactively in real-time.This article describes how to build a QoS analysis framework by analyzing massive dataretrieved from existing data collection in storage and interacting with the existing QoSfeature in storage. For better analysis on such massive data, we adopt some popular BigData analysis methods, for instance, using time series analysis techniques on thesediscrete data to uncover user behavior patterns and predict future behavior, then interactwith storage to set QoS value proactively.This article will be of interest to those wishing to enhance current QoS capability in theirstorage product. Easily implemented, the analysis method in this article could beadopted to build intelligent QoS to make storage more perfect.2014 EMC Proven Professional Knowledge Sharing3
What is Storage QoS?Storage Quality of Service (QoS) refers to the ability to provide different priorities todifferent applications, LUNs, or to guarantee a certain level of performance to anapplication.The importance of storage QoS is depicted in Figure 1. Suppose that your workdaybegins at 9:00 AM and the first thing you do is check your email. During that hour,Exchange server would be very busy and will be the highest priority application.However, in the same time a movie application occupies a lot of storage bandwidth,resulting in low performance of the Exchange application. This condition is exactly whatQoS aims to resolve. With QoS, storage is able to guarantee the performance ofExchange server at a certain level bandwidth, such as 25MB/s during that hour.There are many established storage companies that offer the implementation of QoSfeature, such as IBM’s DS8000 series and Oracle’s Pillar Axiom. For mid-tier storage,EMC VNX series provides a feature called Unisphere Quality-of-Service Manager(UQM). UQM provides a capability to achieve “ideal” system response for multipleapplications based on pre-defined QoS policy by customer. The performance metricsinclude “Response time (ms)”, “Bandwidth (MB/s)” and “Throughput (IO/s)”.Figure 1: UQM application example2014 EMC Proven Professional Knowledge Sharing4
Figure 1 shows an example of UQM application. We can see the performance of OLTPapplication is impacted by the backup job. After setting throughput goal to 1400 IO/s, thesystem achieves the goal successfully after a few minutes of sampling and learning.The Challenge of Storage QoSAlthough current storage QoS implementation could help storage system allocateresources better and enhance overall customer experience, we can see there are stillchallenges to address: Difficult to achieve required QoS goal immediatelyCurrently in the implementation of QoS feature, to achieve certain performancegoal, it will1) prioritize the I/O request coming to storage2) retrieve feedback3) repeat this procedure until achieving the goalWe can see from the procedure that it takes too much time to achieve that goal.Not immediately satisfying the requested performance is a big challenge. Asillustrated in Figure 1, it took about 8 minutes to achieve that bandwidth goal. QoS values settings are not accurateCurrently, the common use of the QoS feature is that storage system attempts toachieve certain performance goals based on pre-defined QoS value setting.Actually, in most cases, the customer defines these QoS values based on arough estimation of history data and subjective experience. The result is that theperformance goal is a little higher or lower than actual needs. Therefore, thechallenge in this scenario is how to make the QoS value setting more accurate.The intelligent QoS framework introduced in this article uses a popular andclassic model to predict future QoS value instead of setting it manually. Thisapproach significantly improves accuracy.2014 EMC Proven Professional Knowledge Sharing5
Why use Big Data Analytics to enhance QoS?Big Data is high-volume, high-velocity, and high-variety information assets that demandcost-effective, innovative forms of information processing for enhanced insight anddecision making1. It could be defined with 3 Vs – volume, variety, velocity, as shown inFigure 2.Figure 2: The 3 Vs of Big DataBig data analytics is the process of examining large amounts of data of a variety of typesto uncover hidden patterns, unknown correlations and other useful information2. It helpscompanies make better business decisions by enabling data scientists and other usersto analyze volumes of transaction data as well as other data sources that may be leftuntapped by conventional business intelligence programs.There are many popular analytical techniques used for Big Data analytics. Figure 3 liststhe typical business questions and corresponding classic analytical methods.The Problem to SolveThe Category of TechniquesClassic MethodI want to group items by similarity.ClusteringK-means clusteringAssociation RulesAprioriI want to find structure in the dataI want to discover relationshipsbetween actions or items2014 EMC Proven Professional Knowledge Sharing6
I want to determine theRegressionLinear Regressionrelationship between the outcomeLogistic Regressionand the input variablesI want to assign (known) labels toClassificationNaïve BayesobjectsDecision TreesI want to forecast the behavior ofTime Series AnalysisACF, PACF, ARIMAText AnalysisRegular expression, TF-IDFa temporal processI want to analyze my text dataFigure 3: Typical business problem and methodsStorage system generates millions of performance data every day, much of which isvaluable but untapped. Big data analytics provide the “Time Series Analysis” techniqueto predict near-future performance value.Time series analysis is the analysis of data organized across units of time. It concernsthe analysis of data collected over time – weekly values, monthly values, quarterlyvalues, yearly values, etc. Usually the intent is to discern whether there is some patternin the values collected to data, with the intention of short-term forecasting3.Among various time series analysis methods, Box Jenkins methodology enablesforecasting with time series data with both high accuracy and low computationalrequirements. The technique could be applied to quickly predict the next fewobservations in a time series based on the last few observations.In this article, we use some techniques of Box Jenkins methodology to build theintelligent QoS framework. Details regarding how to use it will be discussed in theFramework section.A Framework to Provide Intelligent QoSFramework IntroductionTo address the challenges mentioned above, this article proposes an intelligent QoSframework for EMC storage to provide predict capability of storage QoS performancevalue. The framework is able to collect system performance data and predict futurevalue. The predicted result could be leveraged by other features within the storage2014 EMC Proven Professional Knowledge Sharing7
system, which means other features also could be optimized. Detailed application of thisframework will be discussed later.Figure 4: Intelligent QoS FrameworkFigure 4 illustrates the construction of the framework. It consists of 4 parts:1. Data Collection ProcessThis process continually collects the performance QoS data of these storageobjects, which would be used as input of prediction workflow. Currently, nearly allstorage products have such embedded processes or features to collect datacontinually.2. User InterfaceThe user interface is responsible for reporting, monitoring, and configuring theframework.3. Analysis EngineThis is the core component of this framework, responsible for predicting futureQoS value by building an appropriate model with input from the data collectionprocess. There are many classic and popular models that could be used topredict. In this article, we adopt a classical – ARMA – model to predict.2014 EMC Proven Professional Knowledge Sharing8
4. Internal APIThe internal API is accessed by internal features such as FAST VP, UQM, andFAST Cache, leveraging analysis engine output to help optimize featureperformance.Key Technique 1: QoS data collectingThe first step to predict is collecting history data. Most storage systems haveimplemented such a process or feature to continually collect data from the bottom.The current EMC mid-tier VNX storage provides “Unisphere Analyzer”, a tool used tomonitor and analyze current VNX/CLARiiON storage performance, enabling a customerto know current storage workload4. It continually collects the performance data of eachobject in the system, including SP utilization, SP Cache Prefetch Bandwidth, WriteBandwidth-Nonoptimal, Queue Length-Optimal, etc. Figure 5 shows a partial outputexample of Unisphere Analyzer.Figure 5: Partial output example of Unisphere AnalyzerIn this framework, we use 3 types of QoS values from the output of Unisphere Analyzer:1. Bandwidth (MB/s)2. Throughput (IO/s)3. Response Time (ms)2014 EMC Proven Professional Knowledge Sharing9
Key Technique 2: Predict future QoS valueThere are a number of models available for predicting future value. In this article, we usea classic and popular model named Autoregressive Moving Average (ARMA) to betterpredict future QoS value.ARMA model is an important and classic method of time series analysis, which providesa parsimonious description of a stationary stochastic process in terms of twopolynomials, one for the auto-regression and the second for the moving average. Givena time series of data 𝑋𝑡 , the ARMA model is able to understand and predict futurevalues in this series. The model consists of two parts; an autoregressive (AR) part and amoving average (MA) part. The model is usually then referred to as the ARMA (p,q)model where p is the order of the autoregressive part and q is the order of the movingaverage part.The general ARMA (p,q) model is as equation 1 shows5, which was described in the1951 thesis of Peter Whittle.𝑝𝑞𝑋𝑡 𝛿 𝜀𝑡 𝑖 1 𝜑𝑖 𝑋𝑡 𝑖 𝑖 1 𝜃𝑖 𝜀𝑡 𝑖(1)Where 𝛿 is a constant term, 𝜀𝑡 is an uncorrelated innovation process with mean zero.𝜑𝑖 ,i 1,2, p is autoregressive coefficient, 𝜃𝑖 i 1,2, q is moving average coefficient.Figure 6 shows a typical procedure to build the ARMA model.2014 EMC Proven Professional Knowledge Sharing10
Figure 6: Typical workflow to build ARMA modelLet’s take the storage data sample in Figure 7 to make a simple prediction about theaverage throughput value at 13:00 on 01.06, then verify the predict result.2014 EMC Proven Professional Knowledge Sharing11
hput(IO/s)01.03 08:00130001.04 10:00349801.05 12:00335601.03 09:00441201.04 11:00416801.05 13:00237301.03 10:00380001.04 12:00297601.05 14:00351901.03 11:00401301.04 13:00279101.05 15:00390101.03 12:00320401.04 14:00348101.05 16:00313101.03 13:00241201.04 15:00396101.05 17:00400101.03 14:00356701.04 16:00319101.05 18:00414201.03 15:00381301.04 17:00389701.05 19:00350001.03 16:00308701.04 18:00416001.05 20:00260501.03 17:00390801.04 19:00337901.05 21:00191001.03 18:00429001.04 20:00272101.06 08:00128001.03 19:00340101.04 21:00209401.06 09:00439001.03 20:00190401.05 08:00151101.06 10:00371201.03 21:00180701.05 09:00390401.06 11:00397101.04 08:00122101.05 10:00401101.06 12:00289401.04 09:00451601.05 11:00387101.06 13:002582Figure 7: Storage performance data sample2014 EMC Proven Professional Knowledge Sharing12
Step 1: Pre-processingWith the verification of Augmented Dickey-Fuller (ADF) test and monitor from Figure 8,we can tell it’s a stationary series, so no further action is needed to de-trend orseasonally adjust.Figure 8: Performance data sample diagramStep 2: Calculate Auto Correlation Function (ACF), Partial Auto CorrelationFunction (PACF) to identify p, qAutocorrelation is the cross-correlation of a signal with itself. Informally, it is the similaritybetween observations as a function of the time lag between them6. PACF also plays animportant role in data analyses aimed at identifying the extent of the lag in anautoregressive model7.Using Statistical Product and Service Solutions (SPSS) software, among the most widelyused programs for statistical analysis in social science8, we can get the ACF, PACFvalues as shown in Figure 9 and Figure 10.2014 EMC Proven Professional Knowledge Sharing13
Figure 9: ACF value graph of 𝐗 𝐭Figure 10: PACF value graph of 𝐗 𝐭From the ACF and PACF figures, we can see that both ACF and PACF starts to decayfrom lag 3, so we can determine p 3, q 3.2014 EMC Proven Professional Knowledge Sharing14
Step 3: Estimate coefficientAmong many popular methods to estimate parameter, in most cases the method of leastsquares is a good option to estimate these unknown coefficients.Using SPSS software, we could get the estimation of coefficient as Figure 11 shows.Figure 11: Coefficient estimation resultFigure 12: Fitting resultFigure 12 shows the comparison of fitting result and observation. We can see the effectand accuracy is very good.With the estimated coefficient values, we get the ARMA (3,3) model as Equation 2shows.2014 EMC Proven Professional Knowledge Sharing15
𝑋𝑡 3259.312 1.124𝑋𝑡 1 1.160𝑋𝑡 2 0.543𝑋𝑡 3 1.112𝜀𝑡 –1 1.075𝜀𝑡 –2 0.963𝜀𝑡 –3 𝜀𝑡(2)Step 4: Predict using modelBy applying history data to the model in equation 2, we are able to predict the averagethroughput at 13:00 on 01.06 is 2515. The actual data is 2582, so the relative error isjust 2.59%.Application of FrameworkApply to UQMUQM is the current QoS implementation in EMC VNX. The big challenge of UQM is thatcustomers can’t get the expected performance immediately because the feature takes aperiod of time to attain that goal.By being aware of the coming performance required through the intelligent QoSframework, UQM would start to attain that goal in advance. Compared to Figure 1,Figure 13 illustrates the significant effect about storage performance and customerexperience.Figure 13: Optimized UQM2014 EMC Proven Professional Knowledge Sharing16
Apply to FAST VPFully Automated Storage Tiering for Virtual Pools (FAST VP), an advanced data serverin EMC storage products, automatically relocates data of pool-based LUNs at a sub-LUNlevel to proper locations within a storage pool. It reduces provisioning uncertainly andmaximizes total cost of ownership (TCO), thereby improving system performance.Figure 14 illustrates how it works. The policy engine within the system continually tracksI/O counts on slice and compute slice temperature based on Exponential MovingAverage (EMA). It then moves the hottest data slice to the extreme performance tier(such as Flash disk) and moves the coldest data to a capacity tier (such as SAS disk).Figure 14: FAST VP relocation viewA big challenge of FAST VP is that the relocate action must always be hysteretic andpassive because one slice becoming hot from cold temperature needs a period of time,according to the algorithm.2014 EMC Proven Professional Knowledge Sharing17
By utilizing the intelligent QoS framework, FAST VP is able to know the near future I/Ocount of slice, and then take it into consideration when computing the temperature usinga modified formula as Equation 3 shows.𝑇(𝑥) 𝑇′ (𝑥) 𝜇 𝐹(𝑥)(3)Where 𝑇(𝑥) refers to temperature of slice x, 𝑇′ (𝑥) is data temperature using presentEMA algorithm, 𝜇 is a weight variable, and 𝐹(𝑥) refers to the output from framework thatthe near future I/O counts.The result is that a “will” hot slice will be proactively moved to performance tier instead ofmoving it when it is hot as Figure 15 illustrates. The result is that when the performancechallenge is coming, storage is already prepared to handle this.Figure 15: Optimized FAST VP2014 EMC Proven Professional Knowledge Sharing18
ConclusionStorage QoS is an important consideration for customers wishing to improve overallstorage performance and customer experience. Doing so, it’s necessary to address thechallenges of current QoS implementation.In this article, we proposed an intelligent QoS framework by leveraging big data analytics.This enables predicting future QoS performance value, thereby helping features withinthe storage system to become more intelligent. There are many popular predictionmethods based on actual situations. In this article, we adopted ARMA model to predict.At last we can see some applications of this framework: 1) UQM is able to proactivelyadjust performance by the prediction; 2) FAST VP could smartly calculate thetemperature by taking future performance into consideration.The framework introduced in this article could be easily implemented and applied tocurrent storage systems to make them more intelligent.2014 EMC Proven Professional Knowledge Sharing19
Appendix1. http://www.gartner.com/it-glossary/big-data/2. nition/big-data-analytics3. http://en.wikipedia.org/wiki/Time series4. https://community.emc.com/videos/37225. 93moving-average model6. http://en.wikipedia.org/wiki/Autocorrelation7. http://en.wikipedia.org/wiki/Partial autocorrelation function8. http://en.w
The current EMC mid-tier VNX storage provides “Unisphere Analyzer”, a tool used to monitor and analyze current VNX/CLARiiON storage performance, enabling a customer to know 4current storage workload . It continually collects the performance data of each object in the system, including SP utilization, SP Cache Prefetch Bandwidth, Write