Transcription
Understanding The 10 Key Reversal Candlestick Patterns
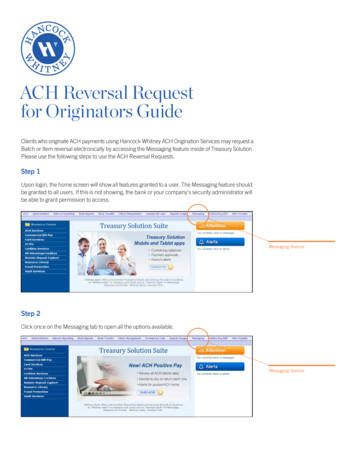
Candlestick Basics – Understanding Price Action& VolumeCandlestick charts are my personal preference for analyzing themarket. What I like about them is the fact that price patterns are easyto see. But in order to read and trade off the charts you mustunderstand how to reach candles and candlestick patters.There are 4 data points to a candle which are the open, high, low andclose values. The colored portion of the candlestick is called "thebody" (also referred to as "the real body"). The long thin lines aboveand below the body represent the high/low range and are called"shadows" (also referred to as "wicks" and "tails"). The high ismarked by the top of the upper shadow and the low by the bottom ofthe lower shadow. If the stock or etf closes higher than its openingprice, a blue candlestick is drawn with the bottom of the bodyrepresenting the opening price and the top of the body representingthe closing price. If the stock or etf closes lower than its openingprice, a red filled candlestick is drawn with the top of the bodyrepresenting the opening price and the bottom of the bodyrepresenting the closing price.While there are dozens if not hundreds of candlestick patterns outthere, most are just variations of these key reversal patterns below. Ifocus on the ten key reversal patterns which work on any time frame.
Doji Candles - (Neutral)Pattern Type: ReversalIdentification:1. Long upper and lower shadows2. Real body is small and in the middle of candleThe Psychology Behind The MoveThis candlestick has long upper and lower shadows with the Doji inthe middle of the day's trading range, clearly reflecting the indecisionof traders. This pattern does not mean much as it could be a pausebefore price continues or it could be the beginning of a trend change.While many people try to trade doji’s the fact is they don’t show ifthere is strength or weakness. Only when it occurs at a support orresistance level would it have some potential as a reversal candle.
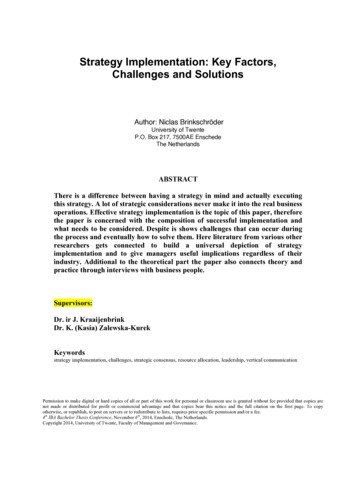
Bullish Hammer CandlePattern Type: ReversalIdentification:3.4.5.6.7.Small real body near the top of candle.Color of the body is not important.Lower shadow is at least twice the length of real body.Little or no upper shadow.Previous trend should be down (bearish).The Psychology Behind The MoveIn a downtrend or within a pullback of an uptrend, a sharp intradaysell-off is followed by a reversal which causes the stock or etf toclose near its opening price near the day’s high. This hints at thepossibility of a reversal back up. The bulls most likely were shakenout by the intraday weakness from a breakdown a short term supportlevel, and shorts start getting a little worried with the end of daybounce. This pattern is a slightly more reliable if the real body isblue, but a strong following day on solid volume is still needed toconfirm the pattern.
Hanging Man CandlePattern Type: ReversalIdentification:1.2.3.4.5.Small real body near the top of candle.Color of the body is not important.Lower shadow is at least twice the length of real body.Little or no upper shadow.Previous trend should be up (bullish).The Psychology Behind The MoveIn an uptrend or within a bounce of a downtrend, a sharp intradaysell-off with heavy volume is followed by a reversal and drift up onlight volume which causes the stock or etf to close near its openingprice near the day's high. Although the stock or etf recovers from itsintraday sell-off, it suggests that the bulls are starting to lose strength,and a reversal may occur. The pattern is a slightly more reliable if thereal body is red. Selling the following day on solid volume is stillneeded to confirm the pattern.
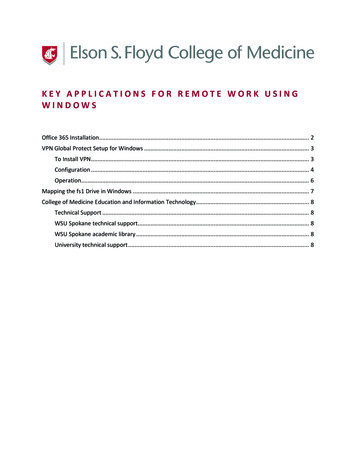
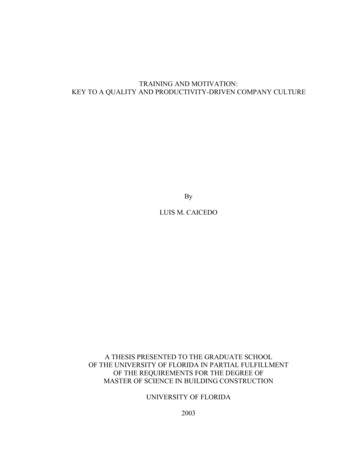
Hanging Man CandleExplained w/ Intraday ChartDaily chart on left, 60 minute chart on right.The Psychology Behind The MoveIn an uptrend or within a bounce of a downtrend, a sharp intradaysell-off with heavy volume is followed by a reversal and drift up onlight volume which causes the stock or etf to close near its openingprice near the day's high. Although the stock or etf recovers from itsintraday sell-off, it suggests that the bulls are starting to lose strength,and a reversal may occur. The pattern is a slightly more reliable if thereal body is red. Selling the following day on solid volume is stillneeded to confirm the pattern.
Shooting Start – BearishPattern Type: ReversalIdentification:1.2.3.4.5.Price gap open to the upside.Small real body formed near the bottom of the price range.Color of the body is not important.The upper shadow at least two times as long as the body.The lower shadow is small or nonexistent.The Psychology Behind The MoveIn an uptrend or within a bounce of a downtrend, the stock or etf gapsup. An attempt is made to rally the stock or etf, but the strengthsubsides and the stock or etf falls to close near the day's low and nearits opening price. The fact that the price could not hold up suggeststhe bulls may be losing strength. Although this is not necessarilyextremely bearish, it is a signe fo short term weakness, so stopsshould be moved up or profits taken on longs. For a reversal toconfirm the following day should continue lower.
Engulfing Candle Pattern – (Bullish)Pattern Type: ReversalIdentification:1. Gaps below the previous day’s low and rallies to close aboveits high.The Psychology Behind The MoveIn a downtrend or within a pullback of an uptrend, the gap down maybe the panic washout out that causes the bulls to throw in the towel.When selling subside, bottom fishers and short covering rally thestock or etf to close above the previous day’s high.
Engulfing Candle Pattern – (Bearish)Pattern Type: ReversalIdentification:1. Gaps above the previous day’s high and closed below theprevious days low.The Psychology Behind The MoveIn an uptrend or within a bounce of a downtrend, the gap up may bethe last surge of panic buying that causes the shorts to throw in thetowel and cover. Meanwhile the smart money is selling and gettingshort and the selling activity is so strong, the stock or etf closesbelow the previous day's low.
Bullish Piercing Line – (Bullish)Pattern Type: ReversalIdentification:1. Overall trend should be down2. Opens below the low of the 1st day.3. 2nd day closes within, but above the midpoint of the 1st day'scandle.The Psychology Behind The MoveIn a downtrend or during a pullback within an uptrend, the stock oretf gaps down, buyers step in and then rallies. This is more reliable ifthe gap down occurs at or just below support and the blue candle isaccompanied by a surge in volume.
Dark Cloud Cover – (Bearish)Pattern Type: ReversalIdentification:1. Overall trending should be up.2. Opens above the 1st day's high.3. 2nd day closes within the 1st day, but below the midpoint.The Psychology Behind The MoveIn an uptrend or within a bounce of a downtrend, the stock or etf gapsup and immediately sells back down. This is more reliable if the gapup occurs at or just above resistance and the red candle isaccompanied by a surge in volume.
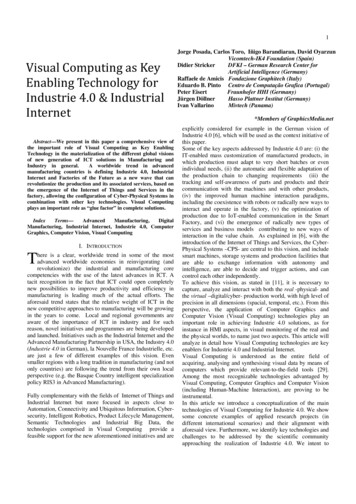
Candlestick Test Of Support – (Bullish)Major Price Support - an area of price where a stock or etf hitssupport, reverses direction with strong volume, and then retests thesame general area of support a second time fading back down onlighter/declining volume.Generally the previous low is pierced on an intraday basis triggeringthe bulls stop orders, only to have a strong rally into the close as theshorts start to cover helping the rally. The result is a high volumereversal candle.
Candlestick Test Of Resistance – (Bearish)Major Price Resistance - an area of price where a stock or etf hitsresistance, reverses direction, and then retests the same general areaof resistance a second time with lighter/declining volume.Generally the previous high is pierced on an intraday basis triggeringshort covering and breakout traders to buy. But a strong sell off intothe close or the following day causes the bulls to sell their positionsresulting in a heavy volume reversal.
Trading On News or Hot Tips Almost Always Results in a Losing TradeGenerally the information is already factored into the market. This is why we see the index or individual stocks sell offwhen positive new is released and rallies after bad news.Trade What The Technical’s Are SignalingFocus on the price and volume as it tells you the most information. If you find you’re self praying for a move to go inyour direction its best to just get out and wait for another setup.Low Risk Entry Points Are EverythingStep back and wait patiently for a setup. It is tough to watch the market fluctuate and in many cases make large moveswithout us but that is just part of trading. Wait for extreme market conditions using volume, market internals andcandlestick patterns before taking a position.PatienceStay in cash and wait for the perfect time to jump on the trade.No trader Ever Went Broke Taking A ProfitOnce you position is in the money I always like to take a little profit. This not only puts a little money back into youraccount but it lower your overall risk and relieves some of the emotions related to trading.
Bullish Hammer Candle Pattern Type: Reversal Identification: 3. Small real body near the top of candle. 4. Color of the body is not important. 5. Lower shadow is at least twice the length of real body.