Transcription
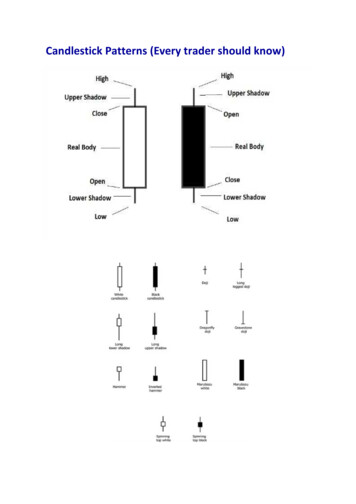
Candlestick Patterns (Every trader should know)
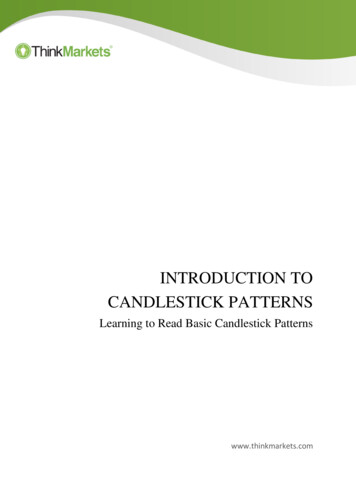
A dojirepresents an equilibrium between supply and demand, a tug of war that neither the bullsnor bears are winning. In the case of an uptrend, the bulls have by definition won previous battlesbecause prices have moved higher. Now, the outcome of the latest skirmish is in doubt. After a longdowntrend, the opposite is true. The bears have been victorious in previous battles, forcing pricesdown. Now the bulls have found courage to buy, and the tide may be ready to turn.For example INETDoji Star
A “long-legged” dojiis a far more dramatic candle. It says that prices moved far higher on theday, but then profit taking kicked in. Typically, a very large upper shadow is left. A close below themidpoint of the candle shows a lot of weakness. Here’s an example of a long-legged doji.For example KLong-legged Doji
A “gravestone doji”as the name implies, is probably the most ominous candle of all, on thatday, price rallied, but could not stand the altitude they achieved. By the end of the day. They cameback and closed at the same level. Here ’s an example of a gravestone doji:
A “Dragonfly” doji depicts a day on which prices openedhigh, sold off, and then returned to theopening price. Dragonflies are fairly infrequent. When they do occur, however, they often resolvebullishly (provided the stock is not already overbought as show by Bollinger bands and indicators suchas stochastic).For example DSGT
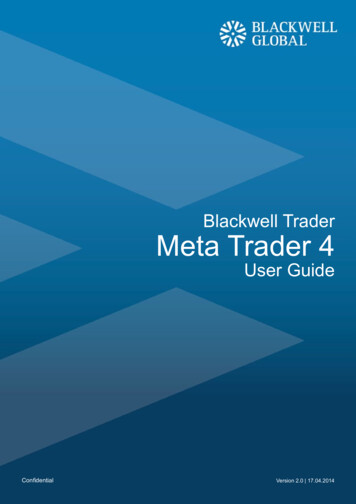
The hangman candle, so named because it looks like a person who has been executed with legsswinging beneath, always occurs after an extended uptrend The hangman occurs because traders,seeing a sell-off in the shares, rush in to grab the stock a bargain price.In order for the Hanging Man signal to be valid, the following conditions must exist: The stock must have been in a definite uptrend before this signal occurs. This can be visuallyseen on the chart.The lower shadow must be at least twice the size of the body.The day after the Hanging Man is formed, one should witness continued selling.There should be no upper shadow or a very small upper shadow. The colour of the body doesnot matter, but a black body would be more positive than a white body.For example MC
The hammer puts in its appearance after prolonged downtrend. On the day of the hammer candle,there is strong selling, often beginning at the opening bell. As the day goes on, however, the marketrecovers and closes near the unchanged mark, or in some cased even higher. In these cases themarket potentially is “hammering” out a bottom.In order for the Hammer signal to be valid, the following conditions must exist: The stock must have been in a definite downtrend before this signal occurs. This can bevisually seen on the chart.The lower shadow must be at least twice the size of the body.The day after the Hammer is formed, one should witness continued buying.There should be no upper shadow or a very small upper shadow. The colour of the body doesnot matter, but a white body would be more positive than a black body.For example KCE
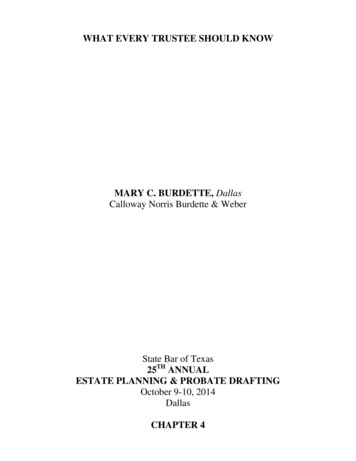
A bullish engulfing candle occurs after a significant downtrend. Note that the engulfing candle mustencompass the real body of the previous candle, but need not surround the shadow.In order for the Bullish Engulfing signal to be valid, the following conditions must exist: The stock must have been in a definite downtrend before this signal occurs. This can bevisually seen on the chart.The second day of the signal should be a white candle opening below the Close of the previousday and closing above the Open of the previous day’s black candleFor example MINT
A bearish engulfing candle occurs after a significant uptrend. Again, the shadows need not besurrounded.In order for the Bullish Engulfing signal to be valid, the following conditions must exist: The stock must have been in a definite downtrend before this signal occurs. This can bevisually seen on the chart.The second day of the signal should be a white candle opening below the Close of the previousday and closing above the Open of the previous day’s black candle.For example ECL
On the dark cloud cover day, the stock closes at least halfway into the previous white capping candle.The larger the penetration of the previous candle (that is , the closer this candle is a being a bearishengulfing), the more powerful the signal. Traders should pay particular attention to a dark cloud covercandle if it occurs at an important resistance area and if the end of day volume is strong.In order for the Dark Cloud signal to be valid, the following conditions must exist: The stock must have been in a definite uptrend before this signal occurs. This can be visuallyseen on the chart.The second day of the signal should be a black candle opening above the high of the previousday and closing more than half way into the body of the previous day’s white candle.For example SCN
The piercing pattern often will end a minor downtrend (a downtrend that often lasts between five afifteen trading days) The day before the piercing candle appears, the daily candle should ideally have afairly large dark real body, signifying a strong down day. In the classic piercing pattern, the next day’scandle gaps below the lower shadow, or previous day’s low.In order for the Piercing signal to be valid, the following conditions must exist: The stock must have been in a definite downtrend before this signal occurs. This can bevisually seen on the chart.The second day of the signal should be a white candle opening below the low of the previousday and closing more than half way into the body of the previous day’s black candleFor example SET INDEX
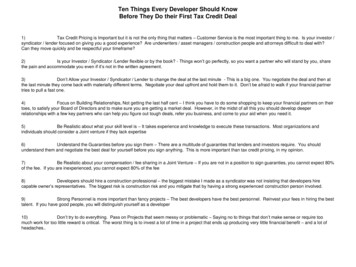
The evening star pattern occurs during a sustained uptrend. On the first day we see a candle with along white body. Everything looks normal and the bulls appear to have full control of the stock. Tn thesecond day, however, a star candle occur. For this to be a valid evening star pattern, the stock mustgap higher on the day of the star. The star can be either black or white. A star candle has a small realbody and often contains a large upper shadow. On the third day, a candle with a black real bodyemerges. This candle retreats substantially into the real body of the first day. The pattern is mademore powerful if there is a gap between the second and third day’s candles. However, this gap isunusual, particularly when it comes to equity trading. The further this third candle retreats into thereal body of the first day’s candle, the more powerful the reversal signal.For example TRUE
The morning star, that on the first day there is a large dark candle. The middle day is not a perfectstar, because there is a small lower shadow, but the upper shadow on top of a small real body gives ita star quality. The third candle is a large white candle that completes the reversal. Not how the thirdcandle recovered nearly to the highs of the first day and occurred on strong volume.In order for the Morning Star signal to be valid, the following conditions must exist: The stock must have been in a definite downtrend before this signal occurs. This can bevisually seen on the chart.The first day of the signal must be a long dark body. The second day must be a day ofindecision. The third day should be a long white candle reaching at least halfway into the bodyof the first day’s dark candle.For example VIBHA
The shooting star can appear only at a potential market top. If a shooting star occurs after a candlewith a large real body, typically it is that much stronger a warning because it shows that the pricecannot sustain high levels. The day the shooting star occurs, the market ideally should gap higher . Thestock should then rally sharply. At this point, it appears as though the longs are in complete control.Sometime during the day, however, profit taking ensues. The stock closes near the unchanged market,as shown by a small real body. Therefore a shooting star has a small real body and a large uppershadow. Typically, there will be either no lower shadow or a very small one.In order for the Shooting Star signal to be valid, the following conditions must exist: The stock must have been in a definite uptrend before this signal occurs. This can be visuallyseen on the chart.The Upper shadow must be at least twice the size of the body.The day after the Shooting Star is formed, one should witness continued selling.There should be no lower shadow or a very small lower shadow. The colour of the body doesnot matter, but a blackFor example WICE
The inverted hammer can only occur after a sustained downtrend, the stock is in all probabilityalready oversold. Therefore, the inverted hammer signifies that traders who have held long positionsin the security, most of whom are now showing large losses, often are quick to dump their shares byselling into strength .For example STEC
The bullish harami candle can occur in either bullish or bearish trends, but the colors are reversed: Alarge black body precedes a smaller white real body, and this gives out a bullish precedes a smallerwhite real body, and this gives out a bullish signal: it implies that the stock is poised to move upward.In signal: In either bullish or bearish haramis, the upper and lower shadows can be of any size, andtheoretically could even go above the real body of the clear candle day. In practice, however, theharami day’s shadows often are small and typically are contained well within the real body of theprevious day’s candle.In order for the Bullish Harami signal to be valid, the following conditions must exist: The stock must have been in a definite downtrend before this signal occurs. This can bevisually seen on the chart.The second day of the signal should be a white candle opening above the Close of the previousday and closing below the Open of the previous day’s black candle.For example CPF
In order for the Bearish Harami signal to be valid, the following conditions must exist: The stock must have been in a definite uptrend before this signal occurs. This can be visuallyseen on the chart.The second day of the signal should be a dark candle opening below the Close of the previousday and closing above the Open of the previous day’s white candle.For example BBL
Marubozu means “close-cropped” Typically, the marubozu is a long candle that implies the day’strading range has been large. A marubozu candle lacks either an upper or lower shadow. On rareoccasions it can lack both a upper or lower shadow. When a full marubozu occurs, or one that is veryclose to full, it is very well worth noting. If it is a white candle, then it signals extreme convictionamong buyers. Conversely, if it is a dark candle, then it indicates sellers were eager to flee. AS always,you should pay careful attention to the nex day’s trading to see if there is follow through. A full ornearly full marubozu implies that there is strong buying or selling interest depending on the color. Ifthere is follow through early the next day, the stock is likely to trend in that same direction for thenext few sessions. That awareness can be important for the trader.For example INTUCH
Spin top , the shadow are relatively small and the candle has a very small range. When combined withlow volume, traders may be expressing disinterest.Spinning Top High Wave Definition:A Spinning Top Wave, also called a High Wave candle, is candlestick that has an open and close pricenear each other which produces a small real body and color is of no importance. They also have longupper and lower shadows that significantly exceed the length of the body. These types of candlesticksindicate indecision and subsequent consolidation.Practical Use:Technical analysts will often watch for Spinning Top High Wave candlesticks and then "join thesidelines." After such a volatile session, traders will often wait for additional confirmation of anupward or downward price movement.For example SET INDEX
High wave candle, on the other hand, portrays a situation where there is a active tug of war betweenthe bulls and bears. This candle shows a market has lost a clear sense of direction. If it occurs on highvolume, then it indicates the market’s general confusion about the direction prices are headed High Wave candles show the confusion among tradersThe size of the real body shows the lack of consensus among traders to sustain the currenttrendIndicates an early sign of a possible shift in the current uptrend or downtrendThe candle has a small real body of either colorThe size of both shadows are particularly long, but are not required to be the exact samelengthIgnore in a trading range: price is pausing before breaking outCaution is recommended when encountering such candles
The three black crows candle formation does not happen very frequently in stock trading, but whenit does occur swing traders should be very alert to the crow’s caw. The candlestick’s metaphor is threecrows sitting in a tall tree. On the day the first black crow makes its appearance, the formation is mostpredictive if the first “crow” or dark candlestick closes below the previous candle’s real body. Twomore long-bodied consecutive down days then ensue. On each of these days, it appears as if the stockwants to regain its former strength, as the stock opens higher than the close on the previous day. Bythe end of each session, however, the sellers regain control and the stock drops to a new closing low.
The three white soldiers pattern is most potent when it occurs after an extended decline and aperiod of subsequent consolidation. When a particular stock posts a decline followed by sidewaysmovement, the appearance at that point of three white soldiers signals that higher prices are likelyahead. The first of the three white soldiers is a reversal candle. It either ends a downtrend or signifiesthat the stock Is moving out of a
stock should then rally sharply. At this point, it appears as though the longs are in complete control. Sometime during the day, however, profit taking ensues. The stock closes near the unchanged market, as shown by a small real body. Therefore a shooting star has a small real body and a large upper shadow. Typically, there will be either no .