Transcription
Process Characterization – It’s Not A Science ProjectMarch 1, 2017BioProcess Technology Consultantswww.bptc.comCONFIDENTIAL
Why Do Process Characterization? What’s the Goal? Standard answers from clients Increase process knowledge― A correct, if esoteric answer. It begs the question, “Then what?” Establish Proven Acceptable Ranges (PARs)― Better, but for what immediate and ultimate purpose? Design of Experiments Creating mathematical models relating process variables to CriticalQuality AttributesIt’s Not A Science Project!2CONFIDENTIAL
Why Do Process Characterization? What’s the Goal? From PDA Technical Report #60: Process Validation: A LifeCycle Approach, 2013 has the answer From Section 3.7― (What PC is): “Process characterization is a set of documentedstudies in which operational parameters are purposefully variedto determine their effect on product quality and processperformance”― (Almost there!): “The approach uses the knowledge andinformation from risk assessments to determine a set of processcharacterization studies to examine proposed ranges andacceptance criteria”― (Here’s the Goal or Application of PC): “The resultinginformation is used to define the PPQ ranges and acceptancecriteria”3CONFIDENTIAL
From BPTC Standard Templates for PPQ ProtocolsPC studies needed to ensure that operation at the NORs specified in PPQprotocol (and at values somewhat outside of the NOR to account formeasurement error and possible deviations) will not impact CQAs andprocess performance.4CONFIDENTIAL
From BPTC Standard Templates for PPQ ProtocolsIn addition to historical process data from full scale GMP manufacturing lots, PCstudies are required to specify acceptable CQA limits for PPQ campaign.5CONFIDENTIAL
From BPTC Standard Templates for PPQ ProtocolsIn addition to historical process data from full scale GMP manufacturing lots, PCstudies are required to specify acceptable performance for PPQ campaign.6CONFIDENTIAL
With Goal Now Defined, How Do We Design PC Program? What variables do we study? Those that are at the greatest risk of screwing up your PC campaign What variables would those be? Those that were ranked the highest during the risk assessment(e.g., the RPN score from an FMEA) OK, we have the variables we want to study, what ranges dowe study for each variable Study values a little bit outside of the Normal Operating Ranges(NORs) to account for measurement error and deviations How do we determine what the NORs are? .7CONFIDENTIAL
What is an NOR and How Do We Establish Them? One definition of NOR From TR60: “a defined range, within (or equal to) the ProvenAcceptable Range, specified in the manufacturing instructions asthe target and range at which a process parameter is controlled,while producing unit operation material or final product materialmeeting release criteria and CQAs”― NOR PAR (That’s the only guidance TR60 gives) Not a helpful definition. For example . Suppose we have data to know that a temperature between 34 and39 oC has no impact on product quality or process performance(i.e., the PAR is 34 to 39). How does this help us define NOR?― Is it 34 – 39? 35 – 38? 36.5 – 37.5? ?― Key term in NOR is “normal”. Where does the process normally run? What isa reasonable range within which to control a process parameter regardless ofPAR?8CONFIDENTIAL
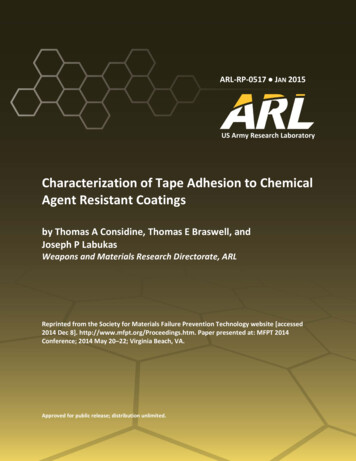
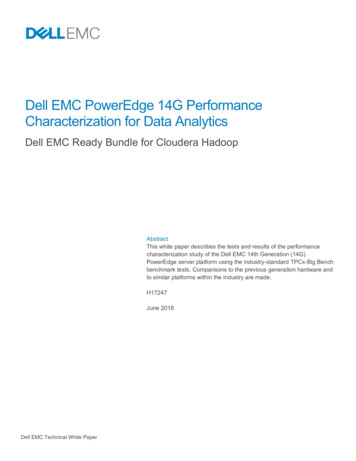
Establishing Normal Operating Ranges Another, more useful, definition of NOR “A defined range within (or equal to) the Proven Acceptable Range,specified in the manufacturing instructions as the target and rangeat which a process parameter is controlled, and that can beachieved with a high degree of assurance and reproducibility”.One way to establish NOR is from historical data― Use process data from historical batches to calculate 95%/99% toleranceintervals7.35Example: 30 batches areshown and plotted. 95%/99%tolerance interval is 6.77 to7.22. Thus, NOR is 6.77 –7.22 (as long as PAR is wider).BioRx pH or Elution pH or ? 2530Run # or Sample #9CONFIDENTIAL
Establishing Normal Operating Ranges Best way to establish NORs is from historical at-scale data Use process data from historical batches to calculate 95%/99%tolerance intervals But what if only a few historical lots have beenmanufactured, how does one establish NOR? Same idea as previous slide – propose ranges where you suspectprocess can operate 90% or 95% of the time (regardless of impacton process or product as that will be discovered during PC)Idea is to minimize the need to execute process deviations andinvestigations during commercial manufacturingExample: for process buffer pH, given the equipment, proceduresand instrument tolerances, propose a pH range for the processbuffer that can be met 90% or 95% of the time (regardless ofimpact on process or product as that will be discovered during PC)10CONFIDENTIAL
We’ve Established NORs: What’s Next for PC Program? We know what variables we want to study We know the NORs for the variables What ranges do we study for each variable? Study values a little bit outside of the Normal Operating Ranges(NORs) to account for measurement error and deviations How far outside the NORs should be studied in our DOEs? One answer: Potentially very far outside because we want to seean impact on CQA and process attributes so that the DOE resultsgenerate a mathematical model relating process variables to .It’s Not A Science Project!11CONFIDENTIAL
Mathematical Models “Don’t Do No Harm” The need for mathematical models reminds me of a linefrom the movie Western “Unforgiven” Gene Hackman as Little Bill Daggett― “Look son, being a good shot, being quick with a pistol, that don't do noharm, but it don't mean much next to being cool-headed. A man who willkeep his head and not get rattled under fire, like as not, he'll kill ya” Having mathematical models relating process variables to CQAs andperformance attributes “don’t do no harm”, but it is NOT the pointof the PC program. The point of the PC program is to:― Provide experimental support for the NORs specified in the PPQ protocols;― Provide some wiggle room to operate in the event the NORs are exceeded(i.e., deviations) & to account for measurement variability12CONFIDENTIAL
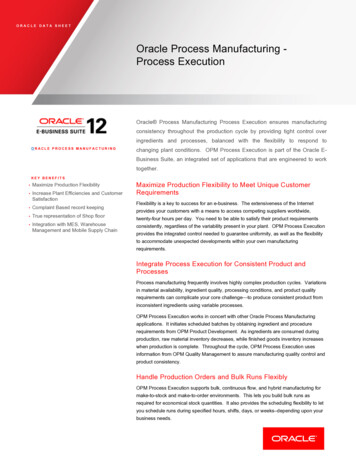
We’ve Established NORs: What’s Next for PC Program? So, how far outside the NORs should be studied in our DOEs One answer: Potentially very far outside because we want to seean impact on CQA and process attributes so that the DOE resultsgenerate a mathematical model relating process variables to . Far enough to account for measurement variability & to providewiggle room to operate in the event the NORs are exceeded so asto provide valuable information for investigations to deviations Example: If NOR for pH of column load is 6.7 to 7.3― Explore 6.5 to 7.5 during PC program6.7NORpH7.3Range studied for PC6.5 to establish PAR 7.513CONFIDENTIAL
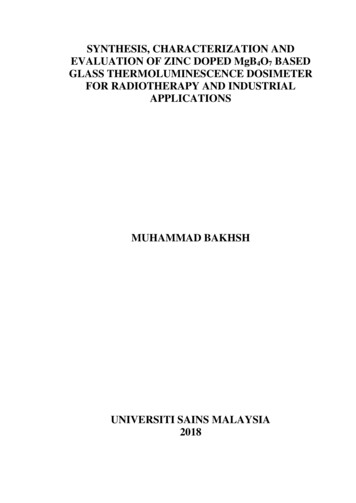
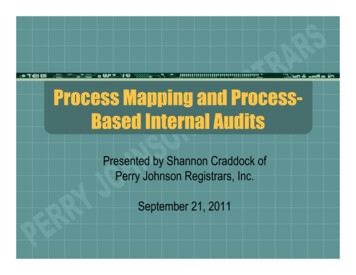
What is an PAR and How Do We Establish Them? One definition of PAR From TR60: “A characterized range of a process parameter forwhich the operation within this range, while keeping otherparameters constant, will result in producing a material meetingrelevant quality criteria.” “ . producingmaterial meetingrelevant qualitycriteria”. What isrelevant qualitycriteria? Again, can relyon historicalperformance ofclinical batches Graph showshistorical clinicalbatchesRange of acceptable performanceNOR14CONFIDENTIAL
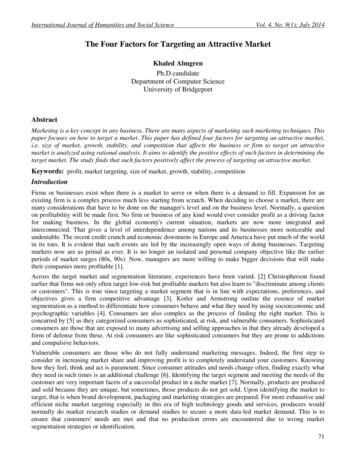
Establishing Proven Acceptable Ranges Example Characterization data shows all experiments studied met all criteriaof acceptable performance defined as that seen in clinical batchesThus, PAR is the entire range studiedNote: No mathematical models required!― No need to look at wider ranges to see an impact on performanceNORNORPARPARProcess Characterization ResultsManufacturing Scale Results15CONFIDENTIAL
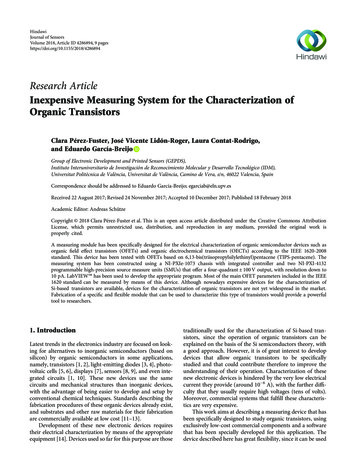
Establishing Proven Acceptable Ranges Another Example Characterization data shows some experiments failed at values lessthan the lowest boundary of the NORThus, PAR is range for which parameter gave acceptable results― Data shown could be actual data or “data” obtained from a model fit Lower end of NOR in danger of providing unacceptable quality― Need more data at lower endNORPARProcess Characterization ResultsManufacturing Scale Results16CONFIDENTIAL
Establishing Proven Acceptable Ranges Another Example Characterization data shows some experiments failed at values lessthan the lowest boundary of the NORThus, PAR is range for which parameter gave acceptable results― Data shown could be actual data or “data” obtained from a model fit Lower end of NOR in danger of providing unacceptable quality― Need more data at lower end; seems like critical process parameterNORPARProcess Characterization ResultsManufacturing Scale Results17CONFIDENTIAL
From BPTC Standard Templates for PPQ ProtocolsNote: Often times PARs are presented in PPQ protocols as well. PARsprovide helpful documentation in the event NORs are exceeded as the PARsin the PPQ protocol can be cited during the investigation and review of thedeviation.PC studies needed to ensure that operation at the NORs specified in PPQprotocol (and at values somewhat outside of the NOR to account formeasurement error and possible deviations) will not impact CQAs andprocess performance.18CONFIDENTIAL
What’s Next? We know what variables we want to study We know the NORs for the variables We know the ranges we want to study for each variable We have a strategy for determining PARs Mine historical data to determine acceptableperformance Execute the studies: DOEs, OFATs Advice regarding DOE execution Don’t fall in love with JMP softwareJMP say tell you can study 7 variables with 8 experiments – DON”TBELIEVE IT!19CONFIDENTIAL
DOE Example 7 variables with 8 experiments. The design is as follows: Suppose the average result is 10 and the first variable has a 20%impact and the second variable has a 12% impact and the resultsare ideal with no variance.Run #12345678 Var 11-11-11-11-12Var 211-1-111-1-10Var 31111-1-1-1-11.2Var 41-1-11-111-10Var 51-1-111-1-110Var 611-1-1-1-1110Var 71-11-1-11-110Result13.29.213.29.210.86.810.86.8If process results, effect of variable 1 would be exactly 2 and theimpact of variable 3 would be exactly 1.2. All other variables arezero.20CONFIDENTIAL
DOE Example 7 variables with 8 experiments. The design is as follows: Now assume some random varianceRun## Var 1 Var 2 Var 3 Var 4 Var 5 Var 6 Var 7 ResultRun1 11 11 11 11 11 11 11 1 13.213.52 2-1 -11 11 1-1 -1-1 -11 1-1 -1 9.29.03 31 1-1 -11 1-1 -1-1 -1-1 -11 1 13.213.04 4-1 -1-1 -11 11 11 1-1 -1-1 -1 9.29.45 51 11 1-1 -1-1 -11 1-1 -1-1 -1 10.811.26 6-1 -11 1-1 -11 1-1 -1-1 -11 1 6.86.77 71 1-1 -1-1 -11 1-1 -11 1-1 -1 10.810.58 8-1 -1-1 -1-1 -1-1 -11 11 11 1 6.86.6201.2 0.037500002.06250.11251.23750.1875-0.088-0.038 Still get essentially the same result. The most important variablesare #1 and #3. The values for the rest are due to experimentalvariance.21CONFIDENTIAL
DOE Example 7 variables with 8 experiments. The design is as follows: Now suppose for 1 variable – just one – you get an unusually highvariance .Run #12345678Var 1 Var 2 Var 3 Var 4 Var 5 Var 6 Var 7 11-110.5-1-1-1-11116.61.7 0.11250.475 1.23750.875 0.03750.4 0.18750.55 -0.0880.275 -0.038-0.42.0625 Now the story becomes a little muddled: is variable #5 significant?Are variables 2 and 4? The story becomes muddled all because of 1bad point.22CONFIDENTIAL
DOE Advice Even if only had 3 variables and 8 experiments, one badpoint can make it appear as if you have interacting effectswhen you may not Here is my advice: Critical: Ensure that your experimental systems andassays are reliable before executing DOEs. One bad pointcan muddle your results and at worse, mislead you!!! Critical: Know your experimental variance beforeexecuting DOEs so that you know what level of effects aresignificant compared to variance. Helpful: Run center-points along with the DOE as controlsto provide a check that experiment ran appropriately23CONFIDENTIAL
DOE Advice Here is my advice: Helpful: Run duplicates if you can. Even runningduplicates for just some of the runs can be helpful. Helpful: If the results indicates that you have many 2factor interactions or if all the effects are relatively closeto one another and no one effect stands out, besuspicious that one or two bad points may have muddledthe results Critical: Leave time available to re-run experiments or toexecute more experiments to explore a variable spacewith higher resolution.24CONFIDENTIAL
Summary From FMEA, determine what variables you want to study Prioritize variables with high RPNs Establish NORs for these variable from historical runs and/orequipment tolerances Determine the ranges you wish to study Ranges a tad larger than the NORs Determine a strategy for establishing PARs Mine historical data to determine acceptable performance Execute the studies: DOEs, OFATs Don’t fall in love with JMP softwareEnsure your experimental systems are reliable & know the variance25CONFIDENTIAL
BioProcess Technology Consultants www.bptc.com CONFIDENTIAL Process Characterization –It’s Not A Science Project March 1, 2017File Size: 959KBPage Count: 25