Transcription
Dell EMC PowerEdge 14G PerformanceCharacterization for Data AnalyticsDell EMC Ready Bundle for Cloudera HadoopAbstractThis white paper describes the tests and results of the performancecharacterization study of the Dell EMC 14th Generation (14G)PowerEdge server platform using the industry-standard TPCx-Big Benchbenchmark tests. Comparisons to the previous generation hardware andto similar platforms within the industry are made.H17247June 2018Dell EMC Technical White Paper
Table of ContentsRevisionsDateDescriptionJune 2018Initial releaseAuthorNicholas Wakou is a Senior Principal Performance Engineer with Dell EMC Global Solutions Engineeringspecifically on the Big Data Analytics team. Nicholas's role, interest and activity are focused on thecharacterization and optimization of the performance of Dell EMC Cloud and Big Data solutions.Nicholas is involved and engaged with Industry efforts to define and manage performance benchmarkstandards. He is active on the SPEC (www.spec.org) Cloud committee and several committees of the TPC(www.tpc.org). Nicholas represents Dell Technologies on the Board of Directors of the TPC and on itsTechnical Advisory Board (TAB). Previously, he was Chair of the TPC Public Relations standing committee.AcknowledgementsThis paper was produced by the following members of the Dell EMC Big Data Analytics engineering team:Author: Nicholas WakouSupport: KaiCheng Wu, Todd Littlefield, Shelley HeburnOther: Michael Woodside, Scott Powers, Eric Wang, Dale McDonaldThe information in this publication is provided “as is.” Dell Inc. makes no representations or warranties of any kind with respect to the information in thispublication, and specifically disclaims implied warranties of merchantability or fitness for a particular purpose.Use, copying, and distribution of any software described in this publication requires an applicable software license. 2018 Dell Inc. or its subsidiaries. All Rights Reserved. Dell, EMC, Dell EMC and other trademarks are trademarks of Dell Inc. or its subsidiaries. Othertrademarks may be trademarks of their respective owners.Dell believes the information in this document is accurate as of its publication date. The information is subject to change without notice2Dell EMC PowerEdge 14G Performance Characterization for Data Analytics
Table of ContentsTable of ContentsRevisions.2Author.2Acknowledgements .2Executive Summary .5Introduction .6Goals and Methodology .7Benchmarking Plan .7System Under Test (SUT).8Hardware Configuration .8TPCx-Big Bench .10TPCx-Big Bench Overview .10Queries .10Business Use Cases .10Technical Dimensions .11Benchmark Phases .12Load Test.12Power Test .12Throughput Test .12Benchmark Execution .12Benchmark Execution for Internal Engineering Analysis .13Benchmark Execution for Publication .14Metrics .15Performance Metric .15Price/Performance Metric .15System Availability Date .15Performance Results .16Optimizations for Performance .16BIOS and OS Settings .16Hadoop Optimization Settings .16Performance Tuning .19Application-level Tuning .19Concurrent Throughput Phase Streams .21Bottleneck Investigation .22IO Capacity Limits .22Resource Usage .233Dell EMC Technical White Paper
Table of Contents14G Performance Result Summary .26Competitive Landscape .2614G/13G Comparisons.27Performance Comparisons.29Price/Performance Comparisons .30Industry Comparisons .31Conclusion .34A4References .35Dell EMC PowerEdge 14G Performance Characterization for Data Analytics
Executive SummaryExecutive SummaryThis Dell EMC publication describes the tests and results of the performance characterization study of theDell EMC 14th Generation (14G) PowerEdge server platform using TPCx-Big Bench benchmark tests asspecified by the Transaction Processing Performance Council. Comparisons to the previous 13th generationplatform and to similar platforms within the industry are made. These tests were conducted by the Big DataAnalytics team which is part of Dell EMC Global Solutions Engineering. The results of the benchmark testswere validated by a TPC certified auditor and published by the TPC.This white paper is targeted at technical professionals (analytics consultants, technical support staff, ITarchitects and specialists) who are responsible for delivering solutions and support for Dell EMC PowerEdgeand Cloudera Hadoop for data analytics.The results of this performance characterization study show that, as of the time of publication, the Dell EMC14G hardware platform outperformed the competition and offered the best price/performance for ClouderaHadoop workloads. Specifically, the published and independently validated results show that, as of the timeof publication of this paper, the Dell EMC Ready Bundle for Cloudera Hadoop on PowerEdge 14G servers:* Provides the #1 price/performance in the industryDelivers the #1 performance compared to HPEDelivers up to 11% overall better performance compared to HPEDell EMC is an active member of the TPCx-Big Bench Technical Committee, and continues to collaboratewith other stakeholders within the industry to maintain the TPCx-BB specification. With work such as thisstudy, we continue to advance the state of the technology of high performance data analytics1.1Based on Dell EMC testing using TPCx-Big Bench for Scale Factor 10000, March 2018. Dell EMC test results validatedby InfoSizing, an independent 3rd party. See http://www.tpc.org/tpcx-bb/results/tpcxbb perf results.asp for additionaldetails.5Dell EMC Technical White Paper
IntroductionIntroductionThis report is based on benchmarking tests that were carried out on the Dell EMC 14G PowerEdgeR640/R740xd Reference Architecture (RA) of the Dell EMC Ready Bundle for Cloudera Hadoop. As Big DataAnalytic Systems (BDAS) mature, the pressure to measure and determine the best performance achieved onthose systems rises. This information is used to identify gaps in an organization’s performance processes,tune and optimize these systems and additionally to compare to other vendor offerings in order to achieve acompetitive advantage.This paper explains the goals and methodology of the performance testing, describes the system under test,provides background on the TPCx-Big Bench testing methodology, and lastly, details the performance testresults with comparisons to both the previous generation results and to other competitive industry results thathave previously been published.6Dell EMC PowerEdge 14G Performance Characterization for Data Analytics
Goals and MethodologyGoals and MethodologyThe goals of this report are to gain an in-depth understanding of the performance of the RA using data pointsand workloads that are typical in a Big Data environment, and to identify points of differentiation relative toother industry solutions. Characterization of the Dell EMC Big Data Analytics solution is performed using industry standardbenchmark tests, with a process that includes the following steps:o Obtaining baseline performance data for the hardware platformo Assessing the performance impact of some hardware components on the Reference Architecture(RA)o Identifying and clearing bottlenecks that may occuro Tuning and optimizing the performance of the clusterBenchmarking PlanIn general, the Dell EMC Big Data analytic benchmarking plan encompasses three categories of benchmarktests: engineering analysis, comparative analysis, and business recovery. This benchmark review usedindustry-standard testing methodologies and workloads to obtain an in-depth understanding of the RA and toperform comparative analysis of other vendor solutions.These categories and the tests they include are listed below. Note that the functionality and quality Assurance(QA) tests and the business recovery scenarios are performed as part of the solution testing but were notincluded in the scope of this performance characterization study. 7Engineering Analysiso Functionality and quality assurance (QA) testso Characterizationo Stress testingo Bottleneck investigationo Performance tuningComparative Analysis for Marketing Purposeso Industry-standard tests and workloads TPCx-Big Bench used for this reviewBusiness Recoveryo Failure scenario testso Time taken to recover from system faultso Durability testsDell EMC Technical White Paper
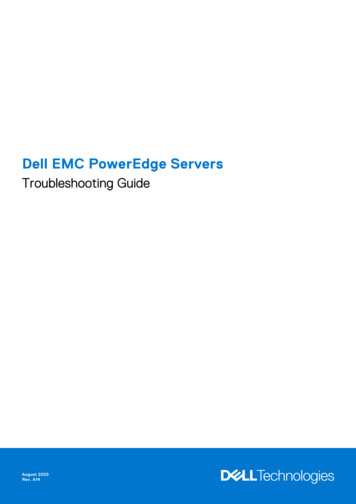
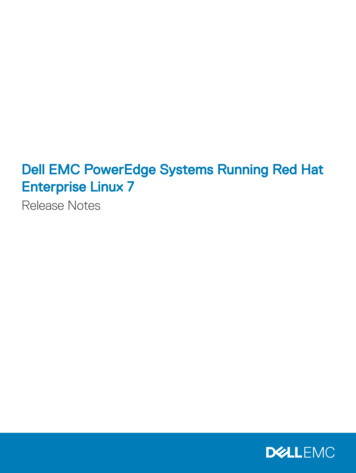
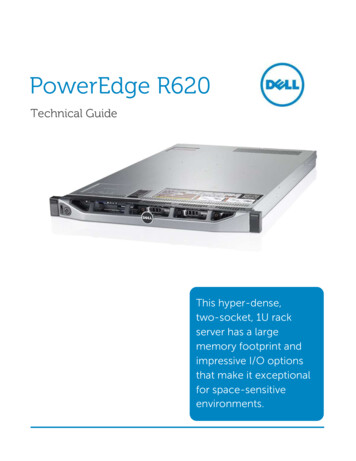
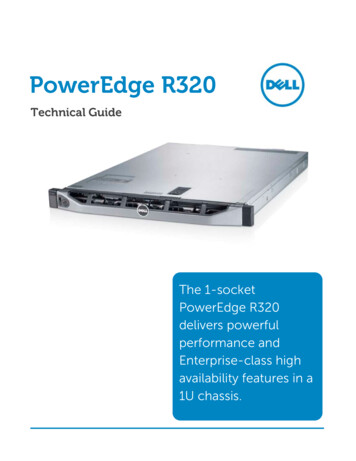
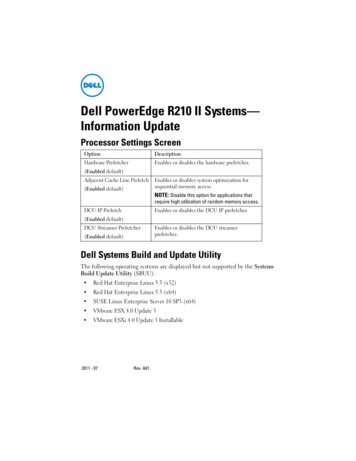
System Under Test (SUT)System Under Test (SUT)This benchmark review was undertaken on a 14G Dell EMC PowerEdge R640/R740xd hardware platform.System Under TestHardware ConfigurationThe following tables and figures describe the SUT’s: Table 1 Hardware ConfigurationTable 2 Software StackFigure 2 Network Switch ConfigurationHardware ConfigurationDell EMC 14G Performance Cluster8ManagementWorkerSUT118ProcessorsIntel Xeon Gold 6134 3.2G 8cIntel Xeon Platinum 8160 2.1G 24CProcessors/Cores/Threads 2/16/3236/864/1728Memory (GB)/Worker192384Storage/Worker8x1TB HDD 2x480GB JBOD SSD 22x1.8TB HDD 240GB BOSS cardTechnical White Paper
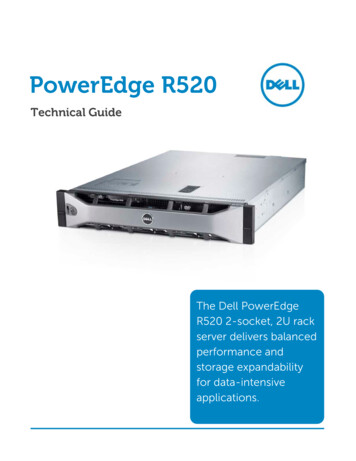
System Under Test (SUT)Software StackComponentVersionOperating SystemRed Hat Enterprise Linux 7.3HadoopCloudera Distribution of Hadoop CDH 5.13.1Cloudera ManagerCloudera Manager 5.13.1JavaJava Hotspot 64-Bit Server build 1.7.0 67-b01Network Switch Configuration9Dell EMC PowerEdge 14G Performance Characterization for Data Analytics
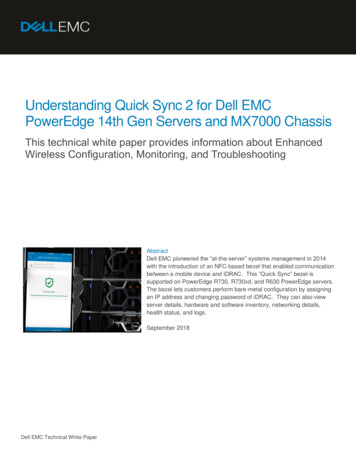
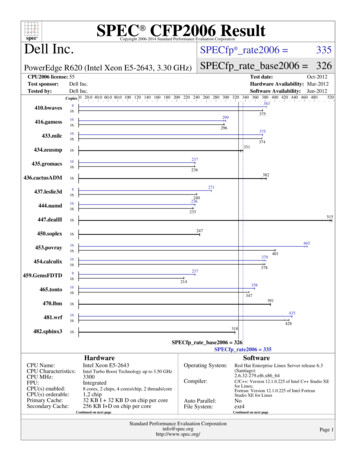
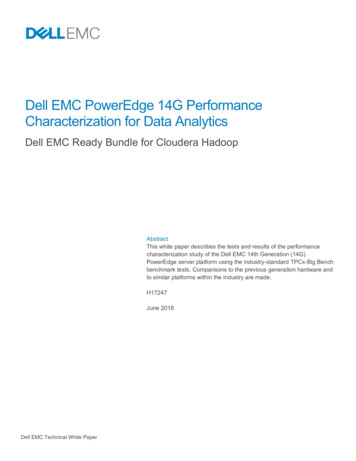
TPCx-Big BenchTPCx-Big BenchThe TPCx-Big Bench (TPCx-BB) benchmark standard and workloads were used to characterize and measurethe performance of the SUT.TPCx-Big Bench OverviewTPCx-BB is an application benchmark for Big Data Analytic Systems (BDAS). Big Data systems arecharacterized by three cornerstone aspects; volume, velocity, and variety.Volume refers to the size of the Big Bench Dataset that is based on a single scale factor and is predictableand deterministic. Scale Factors are used to scale data from 1TB to up to Petabytes of data.Velocity refers to the ability of the Big Data system to stay current through periodic refreshes, commonlyreferred to as Extraction, Transformation and Load (ETL).Variety refers to the ability to deal with differently organized data, from un-structured to semi-structured andstructured data. A high-level view of the data model is presented below in Figure 3.TPCx-BB Data ModelQueriesTPCx-BB features 30 complex queries. These queries are designed along one business dimension and threetechnical dimensions that cover different business cases and technical perspectives [3].Business Use CasesBased on the McKinsey report [1] on big data, ten queries (query1 – query10) were identified that fall into fivemain categories of a retail business:1. Marketing2. Merchandising3. Operations10Dell EMC Technical White Paper
TPCx-Big Bench4. Supply Chain5. New Business Models (price comparison)Technical DimensionsThere are three technical dimensions to the analysis: Data Source DimensionProcessing Type DimensionAnalytic Technique DimensionData Source DimensionThis dimension measures the type of input data the query is targeting. There are three types of input data inBig Bench: StructuredSemi-structuredUnstructuredFor example, Query 1 uses semi-structured web click streams as data source, while Query 3 does sentimentwords extraction on un-structured product reviews data. In addition to using a single data source, data sourcecombinations are covered in the queries as well. For example, user click analysis (semi-structured) beforestore purchasing (structured) joins the two largest data sources, as is the case in Query 4.Processing Type DimensionThis dimension measures the type of processing appropriate for the query. This dimension covers the twocommon paradigms of declarative and procedural languages. In other words, some of the queries can beanswered by declarative languages, others by procedural languages and others by a mix of both. For TPCxBB, examples of declarative languages are SQL and similar constructs like Hive-QL. Map-Reduce is anexample of a procedural language and Pig Latin has a mix of declarative and procedural constructs. Note thatwhile some of the queries can be expressed in either declarative or procedural languages, there are queriesthat can only be expressed through procedural programming.Analytic Technique DimensionThis dimension measures different techniques for answering business analytics questions. In general, threemajor categories of analytic techniques were identified: statistical analysis, data mining and simple reporting.1. Statistical analysis involves correlation analysis, time series, regression, etc. Statistical analysis isexemplified in Query 5, 9 and 10.2. Data mining categories use classification, clustering, association mining, pattern analysis and textanalysis. Examples of data mining queries include Query 1, 2, 3, 4, 7 and 8.3. The reporting category represents a small but significant part of business analytics. This categorycovers the ad hoc queries and those that do not belong to statistical analysis or data mining. Mostreporting queries are simple tasks that can be expressed in simple SQL and come from TPC-DS.Query 6 is an example of a reporting query.11Dell EMC PowerEdge 14G Performance Characterization for Data Analytics
TPCx-Big BenchBenchmark PhasesTPCx-BB defines 3 phases of the benchmark test: Load TestPower TestThroughput TestThe three tests run sequentially, and are not permitted to overlap.Load TestDuring the load test, the test database used to execute the three phases is built. This phase consists thefollowing processes:1. Data Generation2. Relocation: Copy to final Database Location3. Data PreparationPower TestThe Power test determines the time the SUT can process all 30 queries which must run sequentially inascending order.Throughput TestThe Throughput test runs 30 queries using concurrent streams. Each stream runs
specifically on the Big Data Analytics team. Nicholas's role, interest and activity are focused on the characterization and optimization of the performance of Dell EMC Cloud and Big Data solutions. Nicholas is involved and engaged with Industry effo