Transcription
Q1 2021 Earnings ReviewApril 28, 2021Note: See slide A15 for related notes
Information Regarding This PresentationFORWARD-LOOKING STATEMENTSThis presentation includes forward-looking statements. Forward-looking statements are based on expectations, forecasts, and assumptions by our management andinvolve a number of risks, uncertainties, and other factors that could cause actual results to differ materially from those stated. For a discussion of these risks,uncertainties, and other factors, please see the “Cautionary Note on Forward-Looking Statements” at the end of this presentation and “Item 1A. Risk Factors” in ourAnnual Report on Form 10-K for the year ended December 31, 2020, as updated by subsequent Quarterly Reports on Form 10-Q and Current Reports on Form 8-K.GAAP AND NON-GAAP FINANCIAL MEASURESThis presentation includes financial measures calculated in accordance with Generally Accepted Accounting Principles (“GAAP”) and non-GAAP financial measures.The non-GAAP financial measures are intended to be considered supplemental information to their comparable GAAP financial measures. The non-GAAP financialmeasures are defined and reconciled to the most comparable GAAP financial measures in the Appendix to this presentation.ADDITIONAL INFORMATIONCalculated results may not sum due to rounding. N / M denotes “Not Meaningful.” All variances are year-over-year unless otherwise noted.REPORTING CHANGESEffective with 2021 reporting, certain costs for the benefit of the global enterprise previously reported in Automotive are now reported in Corporate Other, and costsand benefits related to connectivity previously reported in Mobility are now reported in Automotive. Prior period results have been updated to be consistent with 2021reporting. For details, see Slides A12 - A14 of the Ford Motor Company Q4 & Full Year 2020 Earnings Presentation.In addition, consistent with our adoption of ASU 2019-12 as of January 1, 2021, we no longer allocate a portion of our consolidated U.S. current and deferred taxexpense to certain U.S. subsidiaries. As a result, Ford Credit’s income tax expense is reduced, and since this ASU was adopted on a retrospective basis, 875M oftax sharing payments from Ford Credit to Ford Motor Company in 2020 are now reclassified as distributions from Ford Credit and included in Adjusted Free Cash Flow.2
The PlanTo Stay in the Game We Must:Turn around automotive operations, compete like a challengerTreat customers like familyCreate must-have products and servicesSimplify everythingModernize everywhereCare for each otherTo Grow and Win We Will:Capitalize on our strengthsDisrupt ourselvesPartner for expertise and efficiencyLead the electrification revolution in areas of strength3
First Quarter HighlightsTurn Around Automotive Adjusted EBIT of 4.8B and a margin of 13.3% (10.8% excluding gain on Rivian), despite significantdisruption of semiconductor supply chain; North America EBIT margin of 12.8%, Europe 4.8% Overseas operations delivered EBIT of 0.5B, an improvement of 1.0B year over yearMust-Have ProductsAnd ServicesElectrification Revolution All-electric Mustang Mach-E on sale in NA and Europe; China accepting preorders for locally-built vehicles Continue to build-out connected services, including Ford Telematics, FORDLiive and BlueCruise 1B investment in new electric vehicle manufacturing center in Cologne, Germany Ford European passenger vehicles completely all-electric by 20304
First Quarter Financial ResultsAdj. FCFRevenueAdj. EBITAdj. EBIT MarginAdj. EPS (0.4)B 36.2B 4.8B13.3% 0.89Up 1.8BUp 1.9BUp 5.4BUp 15.1 pptsUp 1.12Lincoln Vehicles5
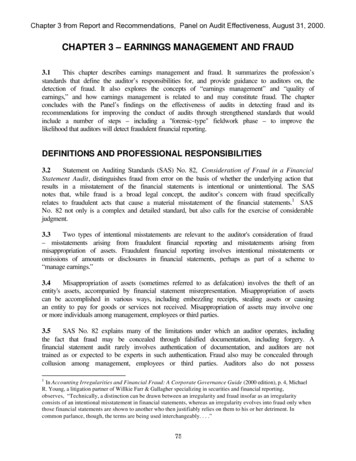
The Plan: Must-Have Products And ServicesBronco High reservation-to-order conversion ratewith 70% new customers to Ford Majority of orders for higher trim series(Outer Banks, Wildtrak, Badlands andFirst Edition) Expanding capacity to meet customerdemandNote: See slide A15 for related notesFord Telematics Announced Ford Telematics Essentials;utilizes connected vehicle data to givecustomers access to vehicle health insightssuch as diagnostic trouble codes, oil life,engine hours and recalls Will allow fleets to track and plan maintenanceand repair services with local dealersPro Power Onboard Available across the F-150 lineup, featuringmore exportable power than any light-dutyfull-size pickup, allowing the vehicle to beused as a mobile generator Dealers in Texas loaned F-150 pickups withPro Power Onboard to deliver power to manyof those impacted by the February poweroutages6
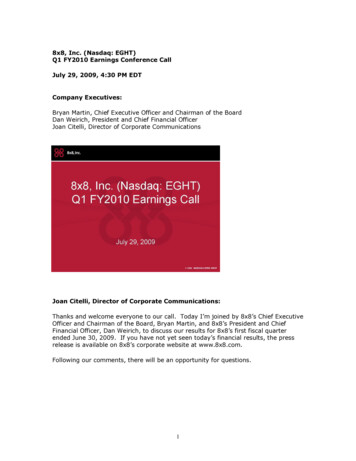
The Plan: Must-Have Products And ServicesMustang Mach-E All-electric Mustang Mach-E on sale inNorth America and Europe Charging network continues to grow with16,000 charging stations in NA and over174,000 in the EU Accepting preorders from China customersthrough direct sales network; local productionto begin later this year Announced China charging network withState Grid and NIO; first automaker to offer“plug-and-charge” convenience in ChinaNote: See slide A15 for related notesFORDLiive Launched FORDLiive in Europe, a connecteduptime system to help Ford commercialvehicle operators increase their productivityby maximizing vehicle uptime The system is available for all Ford connectedcommercial vehiclesBlueCruise BlueCruise allows hands-free highway drivingon more than 100,000 miles of prequalifiedsections of divided highways in North Americacalled Hands-Free Blue Zones Over-the-Air software updates will enableBlueCruise capability on F-150 and MustangMach-E vehicles later this year Over 500,000 miles of development testingcompleted; BlueCruise will give drivers thecomfort and confidence of hands-freehighway driving7
The Plan: LeadElectrificationRevolution Investing 1B in a new electric vehiclemanufacturing center in Cologne,Germany as part of 22B* electrificationinvestment Ford’s first European-built, volumeall-electric passenger vehicle for Europeancustomers will be assembled in Colognestarting in 2023 By mid-2026, all Ford European passengervehicles will be plug-in hybrid orall-electric; completely all-electric by 2030 By 2024, all Ford European commercialvehicles will be zero-emission capable.By 2030, two-thirds of commercial vehiclesexpected to be all-electric or plug-in hybrid* 2016 - 20258
Cash Flow,Cash BalanceAnd Liquidity ( B)A djusted Free Cash FlowCa sh B alance & L iquidityLiquidity 6.6 45.5 Q1 Adjusted FCF of (0.4)Bdriven by:‒ Adverse timing differencesbetween accrual-based EBIT andcash flows, primarily for customerallowances‒ Higher inventory as a result of theglobal semiconductor shortage 46.9 47.2 30.8 31.3Q4Q1 39.8 1.9 35.4 0.5 35.1 39.3 34.3 29.5 (0.4) (2.2) Ended Q1 with a cash balance of 31.3B and ample liquidity of 47.2B 22.3 (4.8)Q42019Q1Q2Q32020Q4Q1Q420212019Q1Q2Q3202020219
Revenue AndEBIT MetricsWholesale Units ( 000) &R evenue ( B) Q1 wholesale units down 6%, drivenby the global semiconductorshortageA djusted E BIT ( B) &E BIT Margin ( %)Wholesale Units 4.8 39.7 Revenue up 6%, driven by highernet pricing, favorable mix andstronger currencies, offset partially bylower volume 37.5 34.3 36.0 36.2 3.61,3541,126 Adjusted EBIT of 4.8B, up 5.4B,driven by:– Higher net pricing 19.41,178 1.71,238 0.51,062645 (0.6)– Higher Ford Credit EBT (1.9)– Investment gain of 0.9B basedon Rivian’s January Series Ffunding roundQ4Q12019Q2Q3Q42020– Lower structural costs Adjusted EBIT Margin of 13.3%,up 15.1 ppts; 10.8% excludingRivian gainQ1Q420212019Adj. EBIT MarginYoY:Revenue(5)%(15)%(50)%1%(9)%6%Wholesale Units (8)%(21)%(53)%(5)%(9)%(6)%YoY:Adj. EBIT1.2%(67)%Adj. Margin (2.3) pptsQ1Q2Q3Q42020(1.8)%(10.0)%(126)%N/M(7.9) ppts (14.3) ppts9.7%Q120214.8%13.3%103%N /MN /M4.9 ppts3.6 ppts15.1 ppts10
Q1 2021 Results( B) 4.8 3.4 Company Adjusted EBIT of 4.8B,up 5.4B, driven by improvement inAutomotive, Ford Credit andCorporate Other 3.3 1.0 Corporate Other includes 0.9B gainon our investment in Rivian 0.6 (0.2) Special Items of (0.4)B reflectsprimarily global redesign actions inSouth America and EuropeB / (W)Q1 2020Q4 2020 (0.5) (0.4)AutomotiveMobilityFord CreditCorporateOtherCompanyAdj. EBITInterestOn DebtSpecialItems 3.62.1 0.10.1 0.90.1 0.90.8 5.43.1 (0.2)0.0 (0.1)4.6 (0.7)Taxes /Net Income /Non-Controlling(Loss)Interests(GAAP) 0.2(1.7) 5.36.111
Q1 2021 Adjusted EBIT ( B)Nor thAmericaQ1 2020YoY Change:Volume / MixSouthAmericaEuropeChinaTotalAutoIMGTotalCompany 0.4 (0.1) (0.1) (0.2) (0.0) (0.2) (0.6) (0.5) (0.1) (0.2) 0.0 (0.0) (0.8) (0.8)Net .80.8Exchange0.10.0(0.0)0.00.10.20.2JVs / Other0.10.00.10.20.00.40.4Total Automotive 2.6 0.0 0.5 0.2 0.2 3.6 3.6Mobility0.1Ford Credit0.9Corporate Other0.9Total ChangeQ1 2021 2.9 (0.1) 0.3 (0.0) 0.2 3.4 5.4 4.8IndustryShare / Stock / Mix 1.1(1.9)Material / FreightWarrantyCommoditiesStructuralPension / OPEB (0.1)0.4(0.1)0.40.2JVsOther 0.20.212
North AmericaWholesale Units (000)681Q1 Headlines Wholesales declined 14% YoY, driven by semiconductor supply constraints Revenue up 5%, reflecting strong customer demand for new product portfolio andhigher industry-wide net pricing on lower dealer inventories from semiconductorshortage EBIT of 2.9B, up 2.6B; EBIT margin 12.8% New product portfolio, including successful launch of F-150, Mach-E and Bronco Sport,aided profitable growth; 70% of Mustang Mach-E customers new to Ford Semiconductor shortage accelerating modernization of sales processes, transitioning tolean inventory sales model with higher turn rates and leveraging new customer orderingcapabilities Improved quality processes gaining traction; warranty expense down 0.4B533YoYQ4 2019Q1 2020Q2 2020Q3 2020Q4 2020Q1 2021(8)%(18)%(61)%2%(21)%(14)% 22.0 23.0Q4 2020Q1 2021Revenue ( B) 25.3 25.3 21.8 10.9Q4 2019Q1 2020Q2 2020Q3 2020(2)%(14)%(54)%8%Q1 Key Performance Indicators(13)%5%EBIT ( B) 3.2 0.7 U.S. retail average transaction price increased by 2,934 per unit YoY cost performance of 0.4B, driven by lower warranty expense540272YoY U.S. market share 13.1%, 1.3 ppts lower YoY. Quality of share improved, with retail up1 ppt to 9.9% and fleet share down, driven by lower rental sales651619 2.9 1.1 0.4 (0.9)Q4 2019EBIT YoY (64)%EBIT Margin 2.8%Q1 2020Q2 2020Q3 2020Q4 2020Q1 2021(83)%1.7%(156)%(8.6)%59%12.6%53%4.9%N/M12.8%13
South AmericaWholesale Units (000)74Q1 Headlines59 EBIT of (0.1)B, our best quarterly EBIT since Q3 2013; marks the sixth consecutivequarter of YoY EBIT improvement Significant restructuring of the business progressing as planned Accelerating transition to a lean, de-risked and asset-light business model focused onportfolio strengths with growth of Ranger pickup, Transit van and key imports48631814YoYQ4 2019Q1 2020Q2 2020Q3 2020Q4 2020Q1 2021(17)%(13)%(81)%(39)%(15)%(70)%Revenue ( B) 1.0 0.9 0.7 0.6 0.4 0.2YoYQ4 2019Q1 2020Q2 2020Q3 2020Q4 2020Q1 2021(22)%(21)%(75)%(39)%(10)%(40)%Q1 Key Performance IndicatorsEBIT ( B) Strong Ranger performance with Q1 segment share of 16.8%, up 2.3 ppts Structural costs down 33% YoY; achieved 0.8B annual structural cost reductionsince 2018 Headcount down 5% YoY (0.1) (0.1)Q3 2020Q4 2020 (0.1) (0.2) (0.2)Q4 2019 (0.1)Q1 2020Q2 2020Q1 2021EBIT YoY 12%28%19%34%40%35%EBIT Margin (18.2)% (15.4)% (68.1)% (17.0)% (12.2)% (16.7)%14
EuropeWholesaleWholesaleUnits*Units (000)(000)341Q1 Headlines Moving to the next phase of Europe transformation with a commitment to anall-electric futureYoY278Q4 2019Q1 2020Q2 2020Q3 2020(2)%(25)%(58)%(20)%Q4 2020Q1 2021(1)%(4)% 7.1 7.1Revenue ( B) Announced electrification plan for Cologne; next-generation 1T Transit / VW allianceproduct to be manufactured by our low-cost Turkey JV 7.0 6.2 5.7 3.6 Further reduced Western European headcount; now 11K lower since the start of thetransformationYoYQ4 2019Q1 2020Q2 2020Q3 2020Q4 2020Q1 2021(1)%(16)%(51)%(10)%1%13% 0.4 0.3Q4 2020Q1 2021N/M5.8%N/M4.8%Q1 Key Performance IndicatorsEBIT ( B) EU20 commercial vehicle share 15.9%, up 1.0 ppt; utility mix 30.4%, up 11.5 ppts 0.1 Net pricing up 0.2B (0.1) Structural costs down 0.2B (0.7)EBIT YoYEBIT Margin* Includes Ford brand vehicles produced and sold by our unconsolidated affiliate in Turkey(about 11K units in Q1 2020 and 17K units in Q1 2021). Revenue does not include these sales239154 EBIT of 0.3B, up 0.5B on 4% lower wholesales; EBIT margin of 4.8% Commercial vehicle share reached a record high; launched new FORDLiive connecteduptime system in our segment-leading commercial vehicle business339288Q4 2019Q1 2020Q2 2020153%1.0%N/M(2.4)%N/M(18.5)% (0.4)Q3 2020N/M(7.8)%15
ChinaWholesaleWholesaleUnits*Units (000)(000)JV VolumeQ1 Headlines159 EBIT improved 0.2B to about breakeven, marking the fourth consecutive quarter ofYoY EBIT improvement, driven by strength of Lincoln, Ford near-premium utilities &commercial vehicles Lincoln best-ever Q1 retail sales; market share nearly doubled YoY. Completedlocalization of Lincoln products with launch of the Nautilus, driving a significantly lowercost base13981202169164156146Q2 2020Q3 2020Q4 2020Q1 202122%27%85% 0.8 0.8Q4 2020Q1 202115019014072TotalChina YoYQ4 2019Q1 2020(7)%(29)%34%Revenue ( B) Commercial vehicles sales achieved best-ever Q1 retail sales; now 48% of Ford’s totalChina sales with strength in light truck, van and bus, and pickup segments 1.0 0.6 0.8 1.0 Further shifted Ford sales mix towards higher margin near-premium utilitiesYoYQ4 2019Q1 2020Q2 2020Q3 2020(38)%(31)%(12)%15%Q1 Key Performance Indicators39%EBIT ( B) Total China market share 2.3%, up 0.1 ppts; total utility mix 33%, up 9 ppts (0.1) Dealer network return on sales remains positive (0.1) (0.0) (0.1) (0.2) 90% of Lincoln produced locally, up 66 ppts A significant improvement in JV net income to 0.1B with net income margin of 4%* Wholesale units include Ford brand and Jiangling Motors Corporation (JMC) brand vehicles producedand sold in China by our unconsolidated affiliates. Revenue does not include these sales(17)%Q4 2019 (0.2)Q1 2020Q2 2020EBIT YoY62%(91)%11%EBIT Margin (21.2)% (40.6)% (16.9)%Ford Equity Income / (Loss) (0.0) (0.1) 0.0Q3 202079%(5.7)% 0.1Q4 202068%(8.2)% 0.1Q1 202194%(1.8)%16 0.0
International Markets GroupWholesaleWholesaleUnits*Units (000)(000)98Q1 Headlines78 EBIT of 0.2B, up 0.2B; achieved best quarterly EBITYoYQ4 2019Q1 2020Q2 2020Q3 2020(22)%(27)%(64)%(18)% 2.4 Investing 1B to modernize our South Africa manufacturing, expanding our Rangercapacity to meet customer demand in more than 100 global markets 2.0 2.0Q1 2021(5)%5% 2.5 2.3Q4 2019Q1 2020Q2 2020Q3 2020Q4 2020Q1 2021(19)%(25)%(60)%(11)%5%15%Q1 Key Performance IndicatorsEBIT ( B) Total share 1.7%, up 0.2 ppts 0.2 0.1 Ranger total segment share 14.4%, up 1.4 ppts (0.0)Q4 2019 (0.1) (0.1) (0.2)EBIT YoY N / MEBIT Margin (7.1)%* Includes Ford brand vehicles produced and sold by our unconsolidated affiliate in Russia(about 3K units in Q1 2020 and 2021). Revenue does not include these salesQ4 2020 1.0YoY Structural costs down 18%82Revenue ( B) FordPass launched in South Africa on Ranger; connected functionality enhancescustomer experience Everest total segment share 14.5%, up 0.6 ppts9336 All markets are profitable, except India Ranger recognized as Car of the Year in Thailand and best-selling pickup in Vietnamand Cambodia76Q1 2020Q2 2020N/M(115)%(1.3)% (14.6)%Q3 2020Q4 2020Q1 2021181%3.6%64%(2.4)%N/M8.9%17
MobilityEBIT ( B)Q1 Headlines Ford AV LLC celebrated its third anniversary in Miami with the additionof a new 140,000 square foot command center In partnership with Ford, Argo AI is now simulating ride-hail and deliveryoperations across six cities in advance of multiple customer pilotprograms launching later this yearYoY (0.2) (0.3) (0.2)Q2 2020Q3 2020Q4 2020Q1 2021(43)%(2)%8%31% (0.3) (0.3) (0.3)Q4 2019Q1 2020(43)%(27)% Spin progress continues; unit economics improved by more than 60%compared with a year agoQ1 EBIT YoY ( B)Q1 2020Autonomous VehiclesOther MobilityTotal ChangeQ1 2021 (0.3) 0.10.0 0.1 (0.2)18
Ford CreditEBT ( B) 1.1Q1 Headlines EBT of 1.0B, up 0.9B, reflecting non-recurrence of increase in credit loss reserves dueto COVID-19 and strong auction performance Portfolio performing well – loss-to-receivables (LTR) remains low, reflecting historically lowlosses; auction values, at record-high levels, improved significantly from a year ago 0.6Q4 2019 0.5Q1 2020Q2 2020Q3 2020Volume / MixFinancing MarginCredit LossLease ResidualExchangeOtherTotal ChangeQ1 2021 (0.0)0.00.60.40.0(0.1)0.9 1.0* U.S. 36-month off-lease auction values at Q1 2021 mix ROE 22%, up 22 ppts0.37%0.22%0.15%Q1 Key Performance Indicators0.0Q1 20210.62%0.30% Q4 2020U.S. Retail LTR Ratios (%)0.63%Q1 2020 1.0 0.0 Balance sheet and liquidity remain strongQ1 EBT YoY ( B) 0.9Q4 2019 Net liquidity 33.7B, up 5.6BQ1 2020Q2 2020Q3 2020Q4 2020Q1 2021Auction Values (Per Unit)* Managed leverage 7.3 21,340 Distributions 1.0B, up 0.7B 18,905 19,235Q4 2019Q1 2020 19,835Q2 2020Q3 2020 21,925 20,450Q4 2020Q1 202119
Cash Flow And Balance Sheet ( B)Q1Balance Sheet2020Company Adj. EBIT excl. Ford Credit (0.7) 3.9Capital SpendingDepreciation and Tooling AmortizationNet Spending (1.8)1.4(0.4) (1.4)1.2(0.1)ReceivablesInventoryTrade PayablesChanges in Working Capital 0.5(1.1)(0.5)(1.2) Ford Credit DistributionsInterest on Debt and Cash TaxesAll Other and Timing Differences*Company Adjusted FCFGlobal Redesign (incl. Separations)Changes in DebtFunded Pension ContributionsShareholder DistributionsAll Other (incl. Acquisitions & Divestitures)Change in Cash (2.2) r. 31Company Excl. Ford CreditCompany Cash BalanceLiquidityDebtCash Net of Debt 30.846.9(24.0)6.8 31.347.2(25.9)5.5 0.9(6.6)(5.7) (6.5)Pension Funded Status1.0(0.4)(3.5)Funded PlansUnfunded PlansTotal Global Pension 0.3(7.0)(6.7) (0.4)Total Funded Status OPEB (6.6) (0.3)1.9(0.2)(0.0)(0.4)0.50.3(0.4)0.2 2020D ec. 312021Q1 Adjusted FCF Of (0.4)B Driven By Adverse TimingDifferences And Higher Inventory* Includes timing differences between accrual-based EBIT and associated cash flows (e.g., marketing incentive and warranty payments to dealers, pension and OPEB income or expense) and non-cash investment gains20
Special Items ( B)Q1Global Redesign20212020Global RedesignEurope excl. RussiaIndiaSouth AmericaRussiaChinaSeparations and Other (Not Included Above)Subtotal Global Redesign NA Hourly Buyouts / OtherPension and OPEB Gain / (Loss)Pension and OPEB RemeasurementPension Settlements and CurtailmentsSubtotal Pension and OPEB Gain / (Loss)Total EBIT Special ItemsCash Effects of Global Redesign (Incl. Separations)(0.1)(0.0)(0.0)0.0(0.0)(0.0)(0.1) (0.2) (0.1)(0.3)0.0(0.0)(0.0)(0.4)Potential 2022 Actions and Cash EffectsPotential 2021 Actions and Cash EffectsRecorded 2018 - 2020 111.45 1 2.2 - 2.71.9 2(0.0) 0.0(0.0)0.0 0.1(0.0)0.0 (0.3) (0.4) (0.2) (0.3) 7 7.1 3.0 - 3.5 1.6EBIT ChargesCash Effects2021 Global Redesign Primarily South America; Total Global Redesign Of 10B EBIT Charges And 5B Cash Effects Through 202121
2021 Outlook ( B)2021 Outlook2020ActualAdjusted EBIT 5.5 - 6.5 2.8Adjusted FCF 0.5 - 1.5 0.7Capital Spending 6.0 - 6.5 5.7Pension Contributions 0.6 - 0.8 0.6Global Redesign EBIT Charges 2.2 - 2.7 3.4Global Redesign Cash Effects 3.0 - 3.5 0.522
Perspectives On 2021Tailwinds / HeadwindsTailwinds:Non-recurrence of COVID shutdown-relatedvolume losses net of structural cost offsets,strong must-have products, Rivian gain,warranty and material costs, strong newvehicle demandHeadwinds: Global semiconductor shortage; highercommodity costs, up about 2.5B YoYSegment And Regional EBIT All Automotive Business Units improved except IMG;Mobility flat; Ford Credit EBT improvedGlobal Semiconductor Shortage Ford lost about 200K units or 17% of plannedproduction in Q1; outlook assumes about 50% ofplanned production lost in Q2 (700K units) and about10% losses in second half
with 70% new customers to Ford Majorityof orders for higher trim series (Outer Banks, Widtl rak, Badlands and First Edition ) Expanding capactiy to meet customer demand Note: See slide A15 for related